Marketing Results: How to Efficiently Measure And Communicate Them

How to communicate your digital marketing results efficiently with reporting
The main priority for marketing agencies is to be able to communicate their marketing efforts and results to their clients efficiently.
To help them do so, we've compiled a list of different tips to communicate digital marketing strategy and marketing results with effective reports, so that agencies can really improve their relationships with clients and bring their reporting game to the next level.
Let's dig in!
Tip 1: Have a clear and concise report
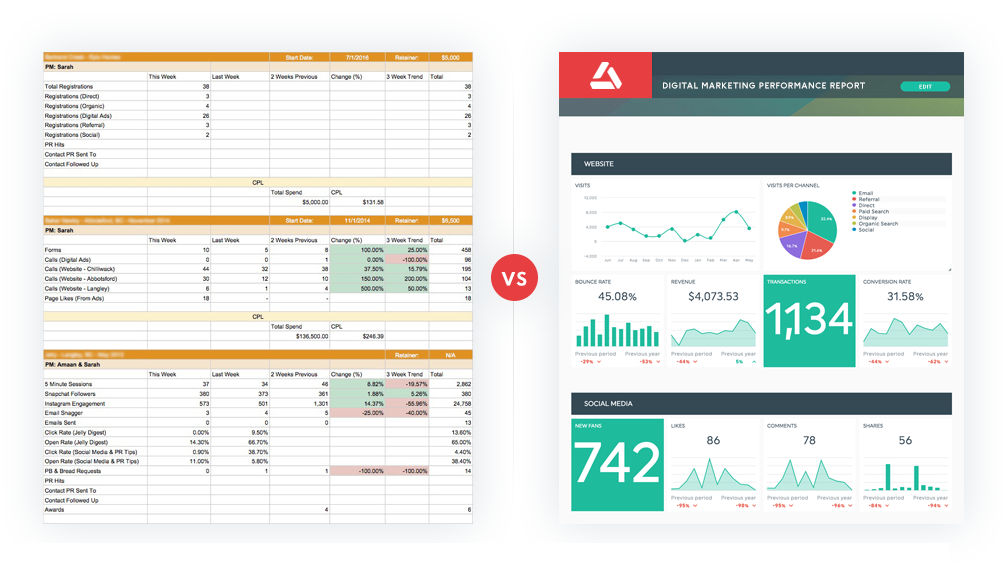
I’m sure you’ve already seen (or even used) excel spreadsheets with basically just lists of different numbers as marketing reports.
As a marketer, you can look at that spreadsheet and know exactly what’s going on in the different marketing campaigns. However your clients are most likely not marketing experts like you, maybe they are business owners or CEOs, and they might not have a marketing team able to interpret the data. so a spreadsheet with just lists of numbers can be quite confusing for them. On top of that, they don’t want to spend any time analyzing the report! That's why they hired you, after all!
With a clear report, your amazing marketing performances will be easy-to-understand for your clients. And it'll be easier for you to explain your marketing results.
Now, how can you create a clear report? Well, there are basically 4 things to keep in mind:
Add a variety of graphs and charts
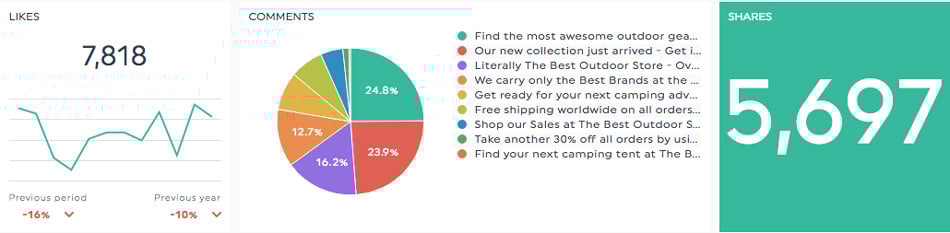
Data visualization is all about graphs. with it, your clients can see at a glance the most important information and the trends of their marketing strategy through time.
Make sure to choose the right type of graph for each of your KPIs; for example, a historical graph for your conversion rate, a pie chart for new vs returning visitors, or mobile devices vs desktop users, lists for your best-performing landing pages, and a simple number for your social media fans.
Use a variety of styles to make it more visually appealing, don't use just historical graphs for example, and play with the sizes and dispositions to put the emphasis where it counts.
Use these graphs and charts in your DashThis report.
Put headers and sections
By sectioning your report, you make things clearer and easier to navigate.
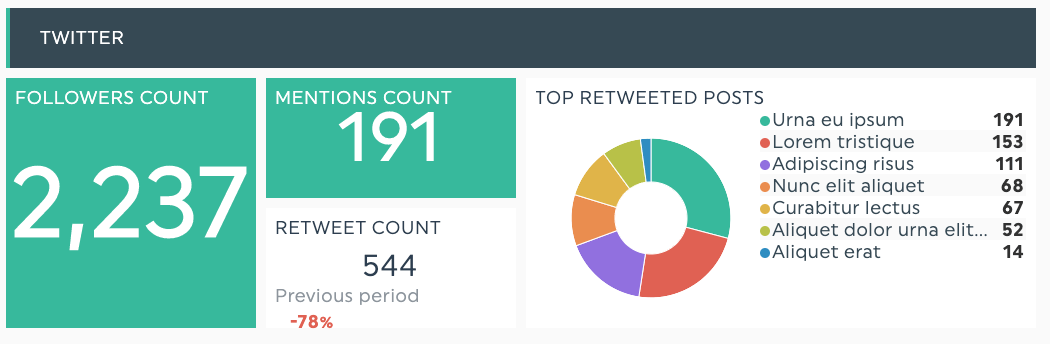
You can have one section that summarizes the report, and then separate your report by either the different channels or campaigns.
For example, you could have a PPC report, with a section for Google ads, Facebook ads, Bing ads, and any other platform you use or a social media report with a section for Facebook, Linkedin, Twitter, and more.
This way you can very easily compare your different channels and convey the information to your clients very clearly.
You can also create one overview report with the key points from all your different marketing strategies from email marketing, SEO, PPC, social media marketing, content marketing, website traffic and analytics, etc.
Use headers and sections with DashThis.
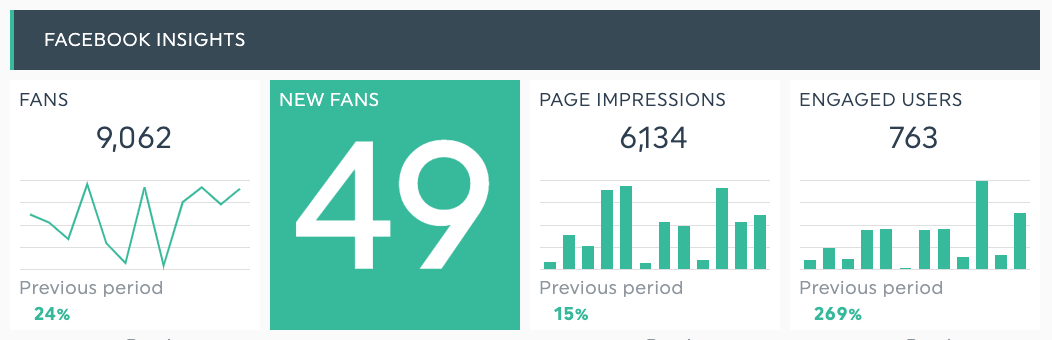
Use images of ads and posts
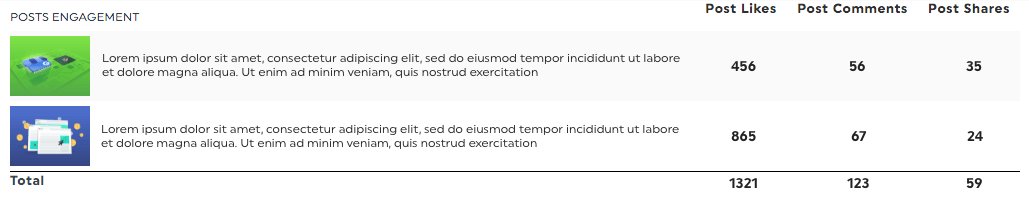
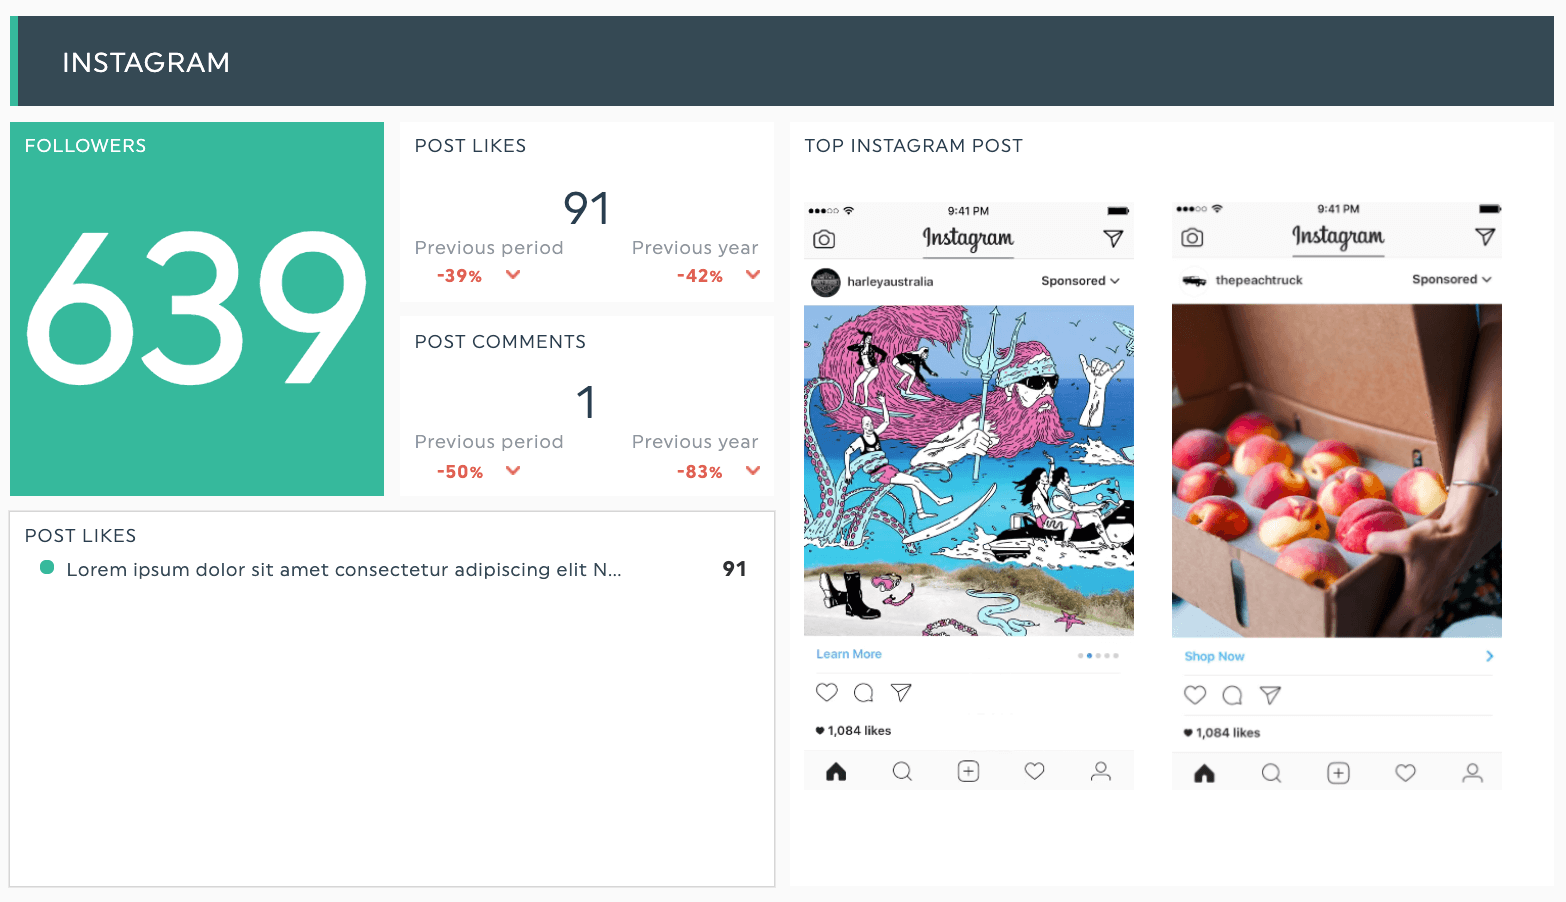
As they say; an image is worth a thousand words.
Images and infographics are popular for a reason. It’s one thing to say our XYZ campaign worked out great, but if you have multiple inbound marketing campaigns, on multiple different platforms, it can get a little confusing.
By adding images of your different ads or social media posts in your report, with their performance, it’s very easy for your client to understand the campaign you are talking about.
Use images in your DashThis report.
Less is more
Make sure your reports only contain the data that’s in line with your client's objectives so they don’t get lost in unimportant metrics.
Let's say your marketing plan involves working on email campaigns, lowering the unsubscribe rate and getting qualified leads, as well as increasing the organic search traffic through search engine optimization and a new content strategy, why show the number of LinkedIn followers, tweets, or Facebook fans?
It only adds noise to your report.
The more data you put in, the more confusing it can get for your clients, so keep it to the point and actionable with only high-quality data.
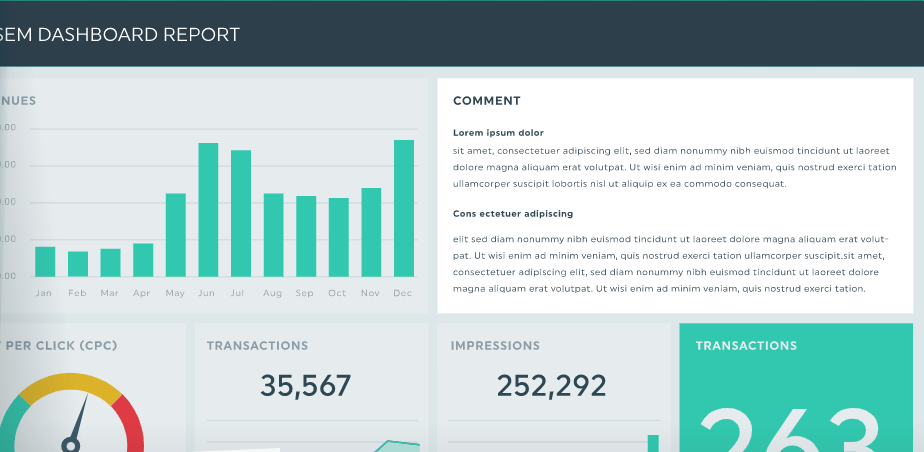
Tip 2: Add comments and notes
Add comments and notes in your DashThis report.
It’s really important to add comments to your report, because your conclusion and your analysis is what’s truly valuable for your client.
They don’t really need to know if they gained 20 followers or 4 backlinks, they need to know what that means for their bottom line.
By explaining the marketing results directly in your report, you use your report as a way to show your client how valuable you are.
One of the best ways to use your reports as a communication tool is to add notes directly alongside the different graphs, or sections, to see them in context.
So for example you could add a note right beside a graph, explaining this particular data.
You could also have a comment box for each section of your report, explaining the performance of each campaign, social media channel, or marketing strategy for the month.
You could also have one bigger comment section, either at the beginning or end of the report, to explain your analysis of the client’s data more in-depth.
Tip 3: Send the reports periodically
I always recommend sending reports monthly, if you simply send one report every year, that wouldn't be the best way to nurture your relationship, however, sending your reports regularly, and taking this opportunity to make sure your clients are doing great, that they are aware of all your digital marketing efforts and next steps, that shows how much you care, and how dedicated you are to them.
Sending your report is not something that you should overlook, it’s one of the best opportunities you have to build a strong customer relationship. It's how you prove to your clients, on a regular basis, that you are valuable, and worth every single penny they give you.
If that’s not client retention 101, I don’t know what is!
You can save time by automating the process with a marketing automation tool. You could, for example, have your automated reports, automatically updated, sent every 1st of the month without having to lift a finger.
If you have very clear comments in your report as discussed previously, you can simply leave them a note that if they have any questions at all, you are there to answer them. However, if there are more explanations needed, once the report is sent, you should call your clients to discuss the data and make sure everything is well understood.
Make sure you explain everything thoroughly, that you discuss not only what happened this month but also the next steps you are leaning towards so that your clients feel safe, and well taken care of.
Tip 4- Be transparent and accountable
Like for any other type of relationship, transparency is crucial in a client-agency relationship. It’s one of the most important things to do in order to foster a great relationship with your clients. No need to lie or hide bad marketing results. Instead, if you educate your clients, and explain the results, they will most likely understand you better and the relationship will only get better as time goes by.
Your clients will respect you way more if you don’t try to hide bad results but instead work hand in hand with them to find solutions.
Reports are a great way for you to explain the data to your clients, and it enables you to be transparent and accountable because you both look at the same data. You can both see exactly how your marketing campaigns are doing and make sure you are both on the same page, in real-time.
So those are the things you can do to use reporting to better communicate your results to your clients, and also foster a better relationship.
How can reports improve your bottom line?
You might be thinking that reporting is pretty much just a cost, right?
In fact, reporting can actually help you make more money!
First off, is using a reporting tool a waste of your money, or an investment?
How much does manual client reporting cost you?
Let’s do a quick calculation.
Let’s say you have 25 clients, and it takes on average 2 hours per monthly report.
That means 50 hours a month, and at a $35 per hour wage, that's about $21 000 per year that you are spending solely on reports!
How much a reporting tool can cost you?
It depends on the tool you use, but for DashThis, with the same number of reports: it would only cost $2 750 per year.
That means a whopping $18,5K of savings every year, PLUS all the time you will now save that can be better invested in billable hours to your own clients.
So I’d invite you to try this calculation with your own number of clients, wage, and time spent on reporting so that you can see for yourself. Building reports from scratch is most likely a waste of time (and therefore money) for your business.
Alright! Now that this is out of the way, how can you not only SAVE money with reporting, but MAKE money?
You convert more clients
We can all agree that as an agency, how you present yourself is a very big part of getting new clients. You need to show that you’re a professional, that you know what you’re doing, and that you offer top-notch services.
Your professional-looking report is a plus-value that your competition may not have. A report that's just plain out boring, like a PDF with lists of numbers, is not such a selling point, however a good looking interactive report with nice graphs and maybe even some white-labelling showing off your own branding, really shows your professionalism and places you above competitors.

Get your own white label report with DashThis.
You retain current clients
This one is all about what we discussed previously: fostering a good client-agency relationship.
If your clients know that you are there for them, that you are transparent, accountable, and are really looking out for them, they will most likely stay and do business with you.
So make sure your clients stay by nurturing your relationship through clear communication and great reports.
You upsell more clients
It depends on each client and their very own situation, but if the results you are showing could be better with some new investments, why not let them know as you send them their reports?
And if everything is going great? Well, why not invest even more in campaigns that are bringing business?
You can easily use your report to show your clients that new smart investments could bring even better results! For example, you can use tangible KPIs such as the Number of phone calls their business received because of your latest campaign, and show them that if they put a bigger budget on this particular campaign, they could double the conversions, and therefore increase their sales.
To wrap up
Showing off your marketing results in a good-looking, clear, concise, informative report is of utmost important, so make sure you use the perfect reporting tool for your needs.

Ready to automate your reporting?
Read More
Don’t miss out!
Follow us on social media to stay tuned!
Automate your reports!
Bring all your marketing data into one automated report.
Try dashthis for free