9 Common Mistakes in Data Analysis (+Tips on How to Avoid for Better Reporting)

Worldwide, there are around 54 million data analysts.
Data analysis is a vital part of business management, with 53% of businesses saying data access is now more critical. Data analytics can help you make improvements that help both customers and employees. But it’s not enough to know how to analyze data; you also need to know how to avoid mistakes.
Mistakes in data analysis can be costly. They can lead you to make poor decisions or overlook something important. So, in this article, we’ll look at nine common mistakes data analysts make and tips on how to avoid them. Read on to find out:
- What is data analysis?
- The four types of data analytics
- Why is data analysis important?
- Nine common mistakes data analysts make
- Data analysis best practices
What is Data Analysis?
Data analysis is the process of extracting insights from data. It includes a variety of strategies and objectives, but usually involves looking at where you were, where you are, or where you could end up. For example, if you run a VoIP call center, you might analyze data to:
- Compare your current first call resolution with your previous FCR to see if you’ve improved.
- Estimate next month’s call volume by analyzing your call volumes from previous years.
- Find inefficiencies that are affecting call center performance.
Often, data analysts use machine learning or automated software to help them analyze large data sets faster.
The 4 Types of Data Analytics
There are four main types of data analytics you can use:
- Descriptive analytics.
- Diagnostic analytics.
- Predictive analytics.
- Prescriptive analytics.
Let’s go through them before we look at why data analysis is important for your business.
1. Descriptive
Descriptive analytics describes what has already happened, such as:
- How your revenue grew over the past year.
- How many sales your marketing campaign generated
These analytics answer the question “What happened?”, so they give useful insights into how your business performed. For instance, you can use descriptive analytics in a report of your customer satisfaction survey to stakeholders.
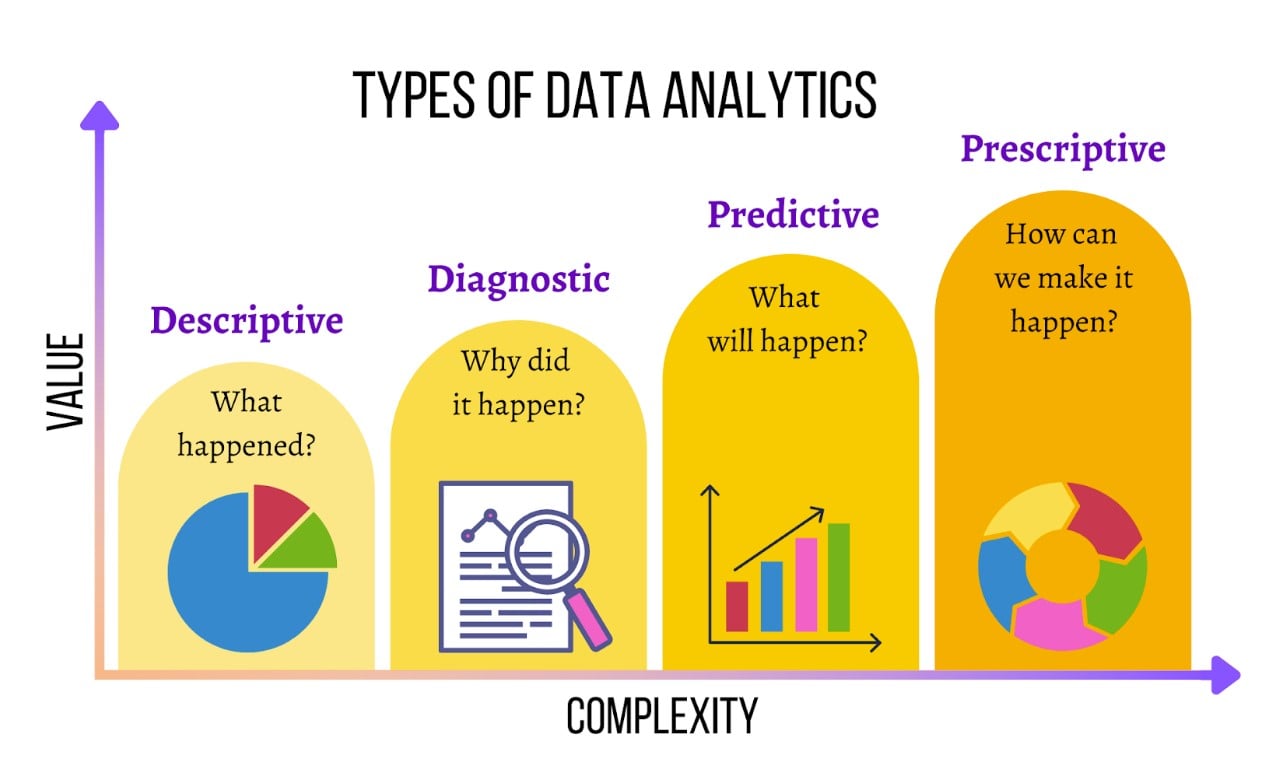
2. Diagnostic
Diagnostic analytics build on descriptive analytics to help you answer why things happened. For example, why your revenue grew or why your marketing campaign generated X number of sales. Diagnostic analytics are ideal for businesses looking to make improvements. After all, once you understand why something happened, you can take steps to rectify it.
3. Predictive
Predictive analytics predict what’s likely to happen based on past data. They identify and classify patterns and calculate if they are likely to recur. For instance, you could use predictive analytics to estimate next year’s revenue based on previous year-on-year growth. These analytics use several statistical techniques, including decision trees, regression, and neural networks.
4. Prescriptive
Prescriptive analytics are the most valuable and complex as they use past data to suggest a course of action. They use machine learning and AI to estimate the probability of different outcomes. For example, prescriptive analytics can suggest when to order extra stock based on past surges in demand. So they help companies make informed decisions.
Why is Data Analysis Important?
80% of companies use data across several departments, from R&D to customer support and product management. Why? Data analysis has many benefits, such as:
- Better marketing: By analyzing your marketing campaign performance, you can find out what worked and what didn’t. This will help you create more effective campaigns in the future.
- Smarter decisions: Using insights from data analytics, you can make smarter business decisions that drive higher growth and revenue.
- Greater efficiency: Data analytics can show you where there are inefficiencies. You can then streamline your business processes and improve productivity.
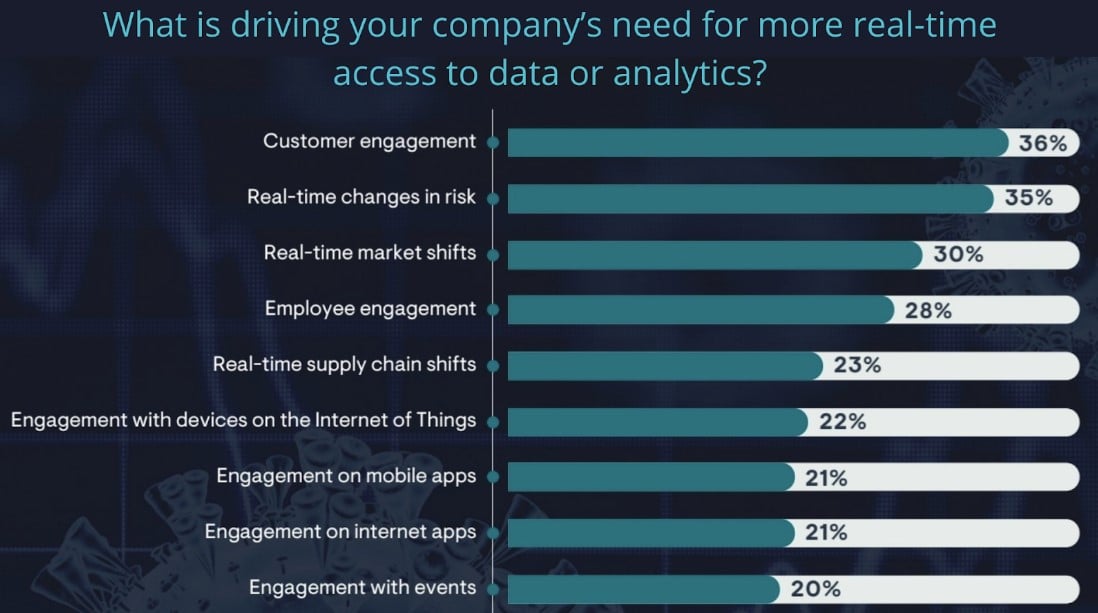
- Happier customers: Analytics can also help you improve customer service. How? By giving you insights into customer expectations and satisfaction. In fact, 36% of businesses say customer engagement is driving their need for greater access to data.
9 Common Mistakes Data Analysts Make
Finding and preparing data are the most common data activities, which over 90% of data analysts perform. These are also the tasks most prone to mistakes. In fact, analysts waste over 44% of their time each week on unsuccessful activities. So, to be productive, you need to know which common mistakes to avoid. Let’s take a look.
1. Sample is biased or too small
If your sample is too small or biased towards one group, you may miss important information or draw incorrect conclusions. For instance, say you are user testing app functionality. Only testing with right-handed people will miss usability issues for left-handed people.
You need to ensure your sample is large enough to give you a full picture of your customers. Also, you should look at the demographics of your target audience and make sure your sample matches those demographics. That way, your sample should be representative of your customers.
2. Goals and objectives are not clearly defined
Your goals and objectives shape all aspects of your analysis, from collecting data to writing your report. So, before you start, you need to define the goal of your analysis and your objectives based on that goal. For instance, your goal could be to compare the performance of your new multi line office phone system with your old single line phone system. Your objectives could then be to:
- Collect data on key performance indicators for the same month for your new and old phone systems.
- Test whether there is a significant difference between the KPIs for your new and old phone systems.
- Prepare a stakeholder report detailing your findings.
3. Confusing correlation with causation
If you notice a correlation between two variables, it’s tempting to think one causes the other. But that’s not always the case. There are many reasons two variables correlate, such as:
- A causes B, or vice versa.
- A and B are both caused by another factor, C.
- A causes C, which causes B, or vice versa.
- The correlation is purely a coincidence.
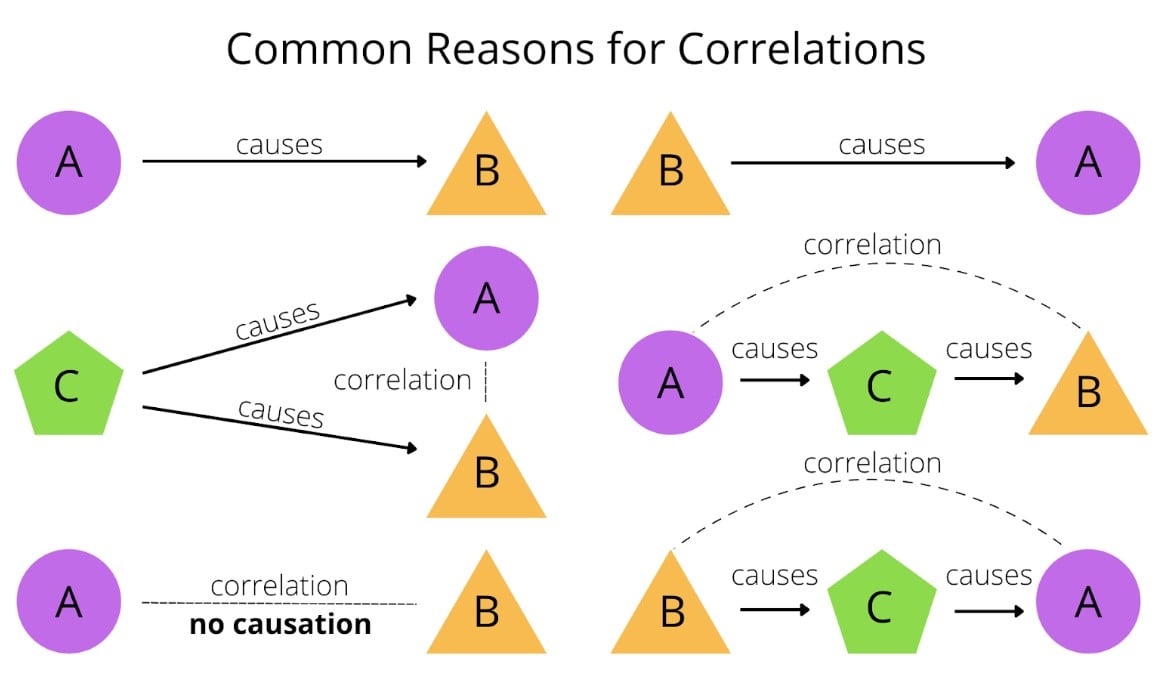
To find out whether two factors are related, you should look at the context. Are there any other factors that could cause the correlation? Don't assume a connection without conducting more research.
4. Using the wrong benchmarks for comparison
Data analysis involves comparing your results with a benchmark. This could be a different time period, such as the previous month, or a different organization or product. But using the wrong benchmark can hide a genuine increase or decrease in your metric or KPI.
For example, let’s say you compare your small business instant messaging engagement with the engagement for a large business. You might think your engagement is much lower than it should be. But if you compare your engagement with another small business, you may find your engagement is actually above-average.
5. Presenting results without adequate context
When you write your analytical report, you need to put your results into context.
- How do they relate to your goals and objectives?
- How do they compare to the results of similar studies?
- Where do your results fit in the wider market?
Context helps you and your readers interpret your results and gauge their significance. You should conduct market research both before and after your analysis, and keep up-to-date with the latest industry trends.
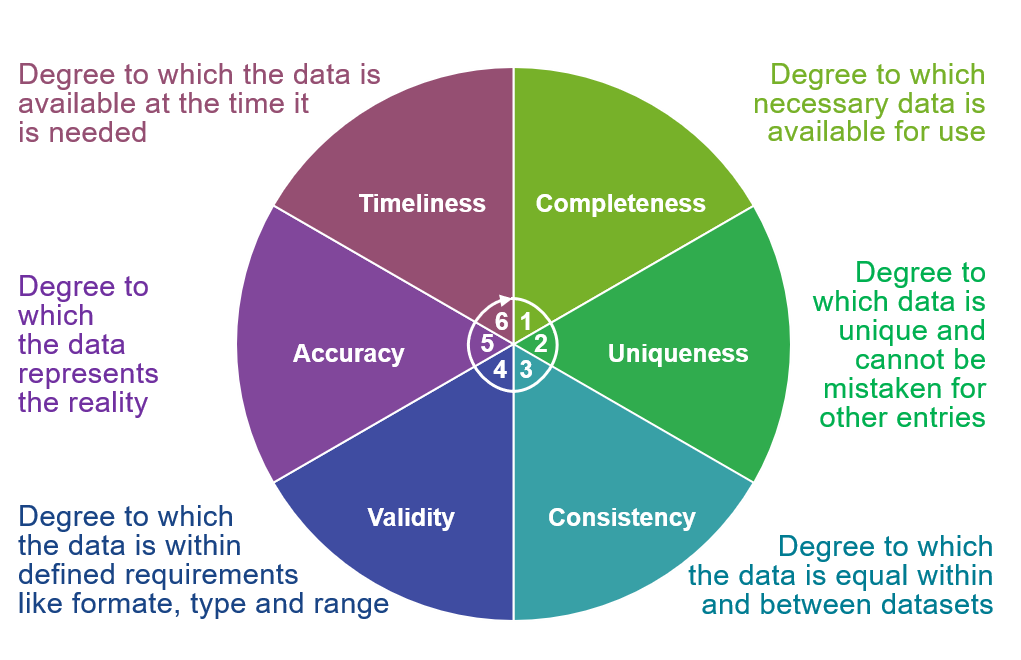
6. Using unreliable data
There are many reasons data may be unreliable, including:
- Missing or duplicated data
- Abnormal or incorrect values
- Rounding errors
- Data is second-hand or out-of-date
To ensure your data is high quality, you need to check that it is: Complete, Unique Consistent, Valid, Accurate, and Timely. Use data from the original source, and make sure it's no more than one or two years old. You should also check your data for missing values and other errors before beginning your analysis.
7. Not standardizing the data
Data analysts get data from a variety of sources, including spreadsheets (50%), SaaS apps (33%), and cloud databases (40%). This data is usually formatted in different ways. For instance, some data might be in percentages and some in fractions. If you don’t standardize how the data is formatted, it can affect the results of your analysis.
You need to ensure all your data is labeled and formatted the same way. That way, it’s easier to catalog and compare. Some programs will automatically format the data for you, for example, Excel has an AutoFormat option.
8. Not fully understanding your metrics and KPIs
Before you start your analysis, you need to ensure you’re clear on what is a KPI and which ones are relevant to your study. You should also write a short definition of what each metric means. This will help both you and your readers since metrics can have different labels and meanings. For instance, bounce rate can mean:
- The percentage of website visitors who leave after only viewing one page.
- The percentage of emails that couldn’t be delivered to the addresses on your mailing list.
Defining your KPIs beforehand ensures they are clear to you and your readers.
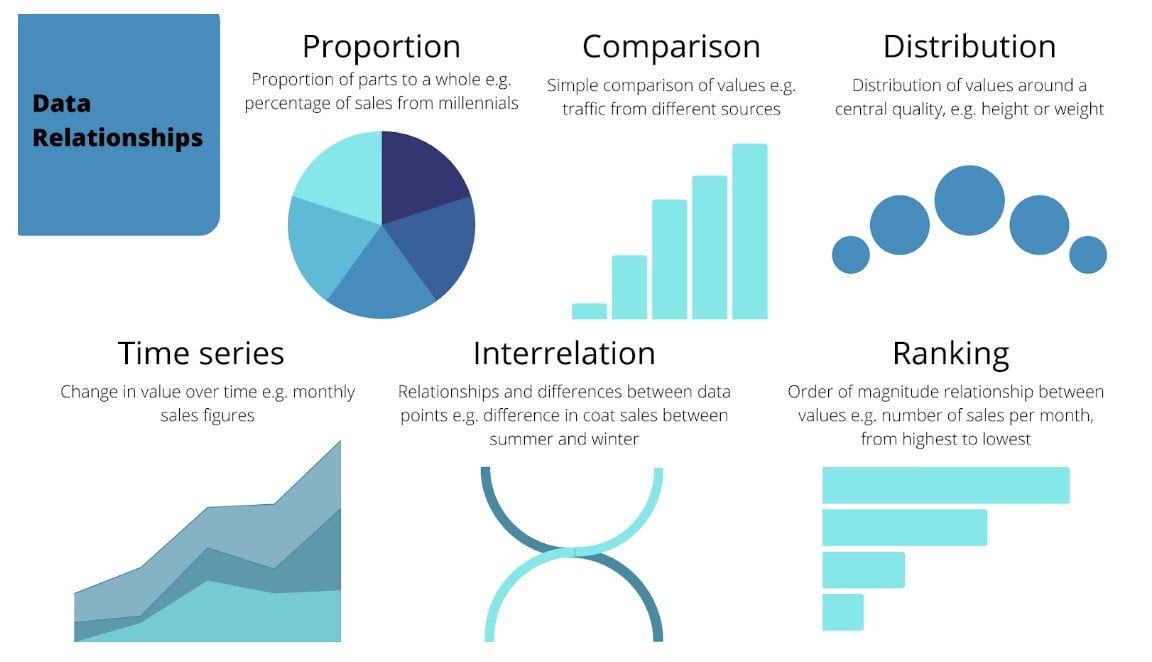
9. Visualizing data the wrong way
There are many ways you can visualize data, from tables to pie charts. Visualizing your data helps you see patterns and relationships more clearly. You can also use them in a report, infographic, or business communication guide. But if you pick the wrong visualization method, you could end up with a misleading picture of your data.
To choose the right visualization, think about how the data is related and how many variables you have. You can use color to distinguish between variables or highlight key findings. Plus, you can use size to indicate value or emphasize importance. Play around with different visualizations until you find the one that makes the most sense.
Data Analysis Best Practices
Now let’s look at some best practices to help you avoid mistakes and improve the quality of your analyses.
Standardize your processes
You should standardize processes like data collection and data entry. For instance, you could create a set of company guidelines for employees to follow. Standardizing processes has several benefits:
- It ensures all your employees know what’s expected of them.
- It helps employees work quickly while reducing the risk of errors.
- It makes it easier to automate data entry and other processes.
Get a second opinion
Once you have completed your analysis, you should check your work for errors. But it’s easy to miss things when you’re so familiar with the data. It’s a good idea to ask a colleague or supervisor to check your work too, as they might spot something you missed.
Use data profiling tools
Data profiling ensures the data you analyze is complete, unique, valid, consistent, accurate, and timely. Data profiling software can identify common data errors and flag them for review, so you're less likely to use unreliable data. Some software will even clean your data automatically.
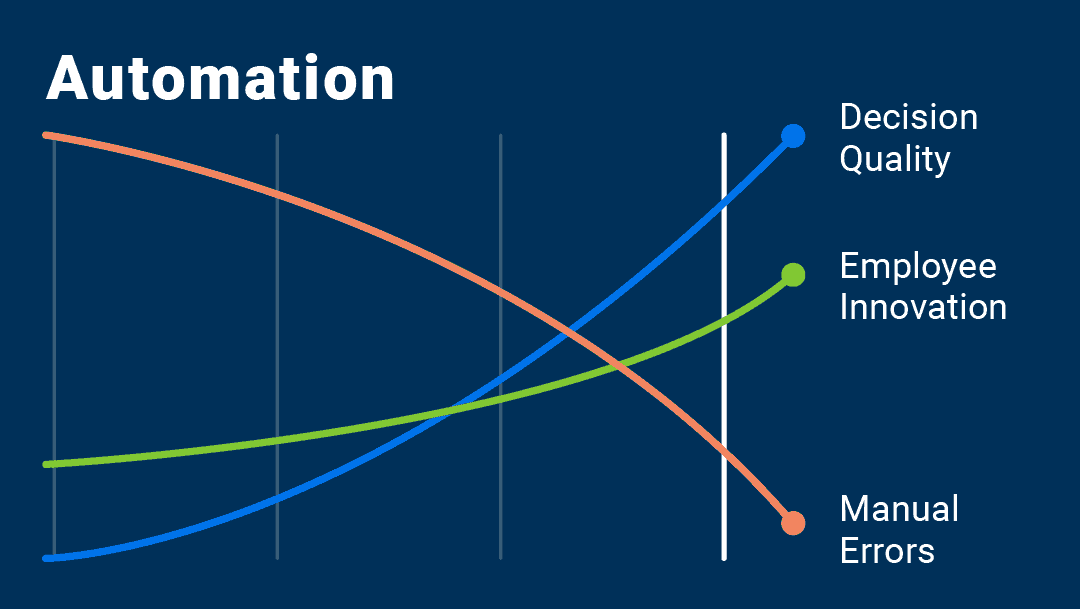
Use automation
Nowadays, businesses can automate a variety of processes to save time and improve efficiency. For instance, referral program software for small businesses can automatically track customer referrals. But what about data analysis? On average, data workers spend 7 hours per week on manual tasks like updating formulas and spreadsheets. This not only costs time, but also leads to mistakes.
Automating repetitive processes like data entry and validation can significantly reduce errors. Software can automatically flag missing data and typos, create data labels, and validate models. This saves time and allows employees to focus on innovation and gleaning insights from the data.
Prioritize accuracy over speed
It's no secret that speed is part of how we work. On average, half of all business decisions require a response within one minute. But some tasks require more accuracy than speed, like coding angular app structure or writing a report.
In data analysis, accuracy is vital. So, while setting deadlines is important, you shouldn't put undue pressure on your analysts. To avoid data analysis errors, you should foster an environment that prioritizes accuracy. Plus, if you automate as many tasks as possible, you can save time and reduce errors.
In a Nutshell
Data analysis is an important business skill. It can give you insights into your business performance and highlight areas for improvement. But it’s easy to make mistakes, and errors in data analysis can be costly. By following the best practices we outlined, you can improve your reporting and generate actionable insights. You can use these insights to enhance your business and boost your revenue.

Ready to track your data?
Read More

Don’t miss out!
Follow us on social media to stay tuned!
Automate your reports!
Bring all your marketing data into one automated report.
Try dashthis for free