How to Write the Best Analytical Report (+ 6 Examples!)

Creating an analytical report from scratch doesn’t need to be a time-consuming process. In this guide, you’ll learn how to present data in a report that excites clients to read.
- What is an Analytical Report?
- How to Write an Analytical Report?
- Analytical Report Examples
- - Executive Report Template
- - Digital Marketing Report Template
- - SEO Report Template
- - Ecommerce Report Template
- - Social Media Report Template
- - PPC Report Template
- Create Your Analytical Report On DashThis Today
What is an Analytical Report?
An analytical report is a business report for stakeholders to determine the best course of action.
For instance, a CMO might review a business executive analytical report to identify a specific issue caused by the pandemic before adapting an existing marketing strategy.
Marketers often use business intelligence tools to create these informational reports.
In terms of layout, these types of business reports could range from text-heavy documents (e.g., Google Docs with screenshots, Excel spreadsheets) to visual presentations.
Go on, do a quick search on Google. You’ll see that many marketers create these text-heavy documents with a formal writing style. It’s also common to see a table of contents on the first page.
In some cases, like this analytical report example below, it’s a spreadsheet chock-full of numbers and screenshots.
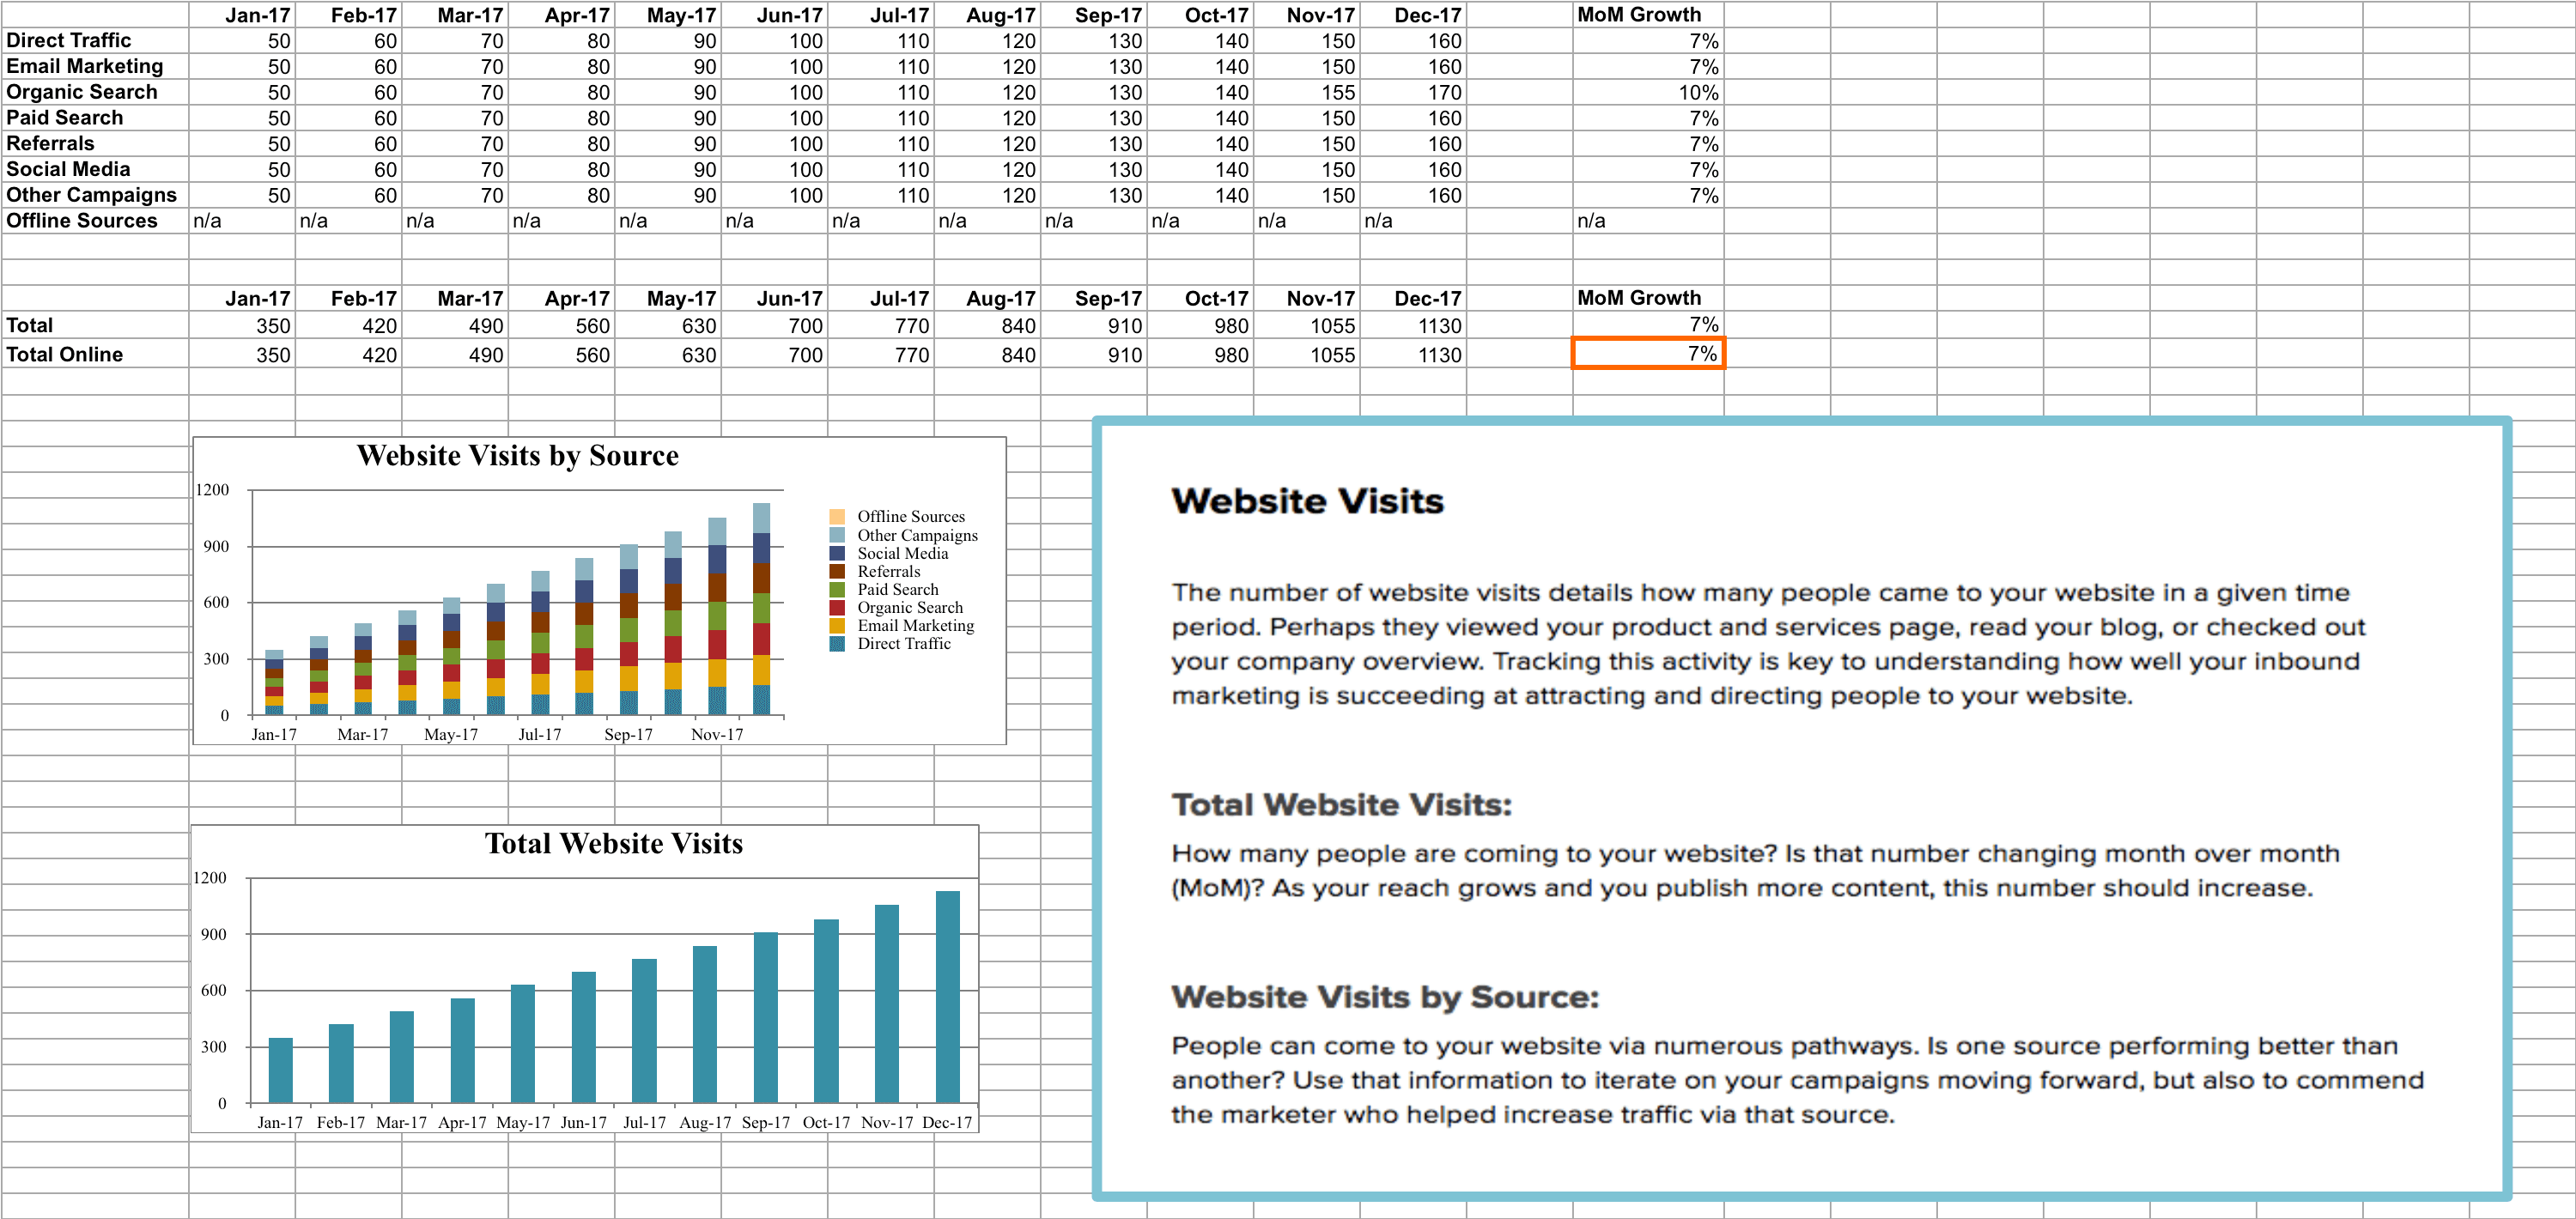
On the flip side, we have the visual-driven analysis report that wows clients at first glance.
Grab this ecommerce sales analytical report template with your own data!
What you see here is an ecommerce sales report template created from data visualization tools like DashThis.
Instead of a rush of text that competes for attention, your clients see a collection of beautiful graphs that transform their historical data into actionable insights.
This is made possible by integration and automation. DashThis gathers all your marketing data in one automated report, saving you hours of work. Start your 15-day FREE trial today to create reports in the blink of an eye.
How to Write an Analytical Report?
We’re here to squash your worries:
As a marketer, you don’t need to master every research method on the planet to learn how to create a marketing report.
That business analysis methodology book you’ve been reading? Go ahead and put it back on the bookshelf. Heck, you don’t even need to learn report writing. Let’s leave predictive analysis and whatnot to the data scientist!
It takes only a few minutes to create an analytical report on DashThis:
- Connect your integration(s)
- Select a dashboard (either start from scratch or choose a template from our 40+ dashboard examples)
- Pick your desired key performance indicators (KPIs)
When you click a KPI, DashThis automatically gathers the data from the appropriate channel
DashThis allows you to connect all marketing channels in a single report.
Need to create an SEO and social media report? Just select a dashboard and click your desired KPIs accordingly.
You can also customize the overall look of your analytical report. Whether it’s a client’s logo, color theme, or misplaced metrics, simply click to change or drag and drop as you wish.
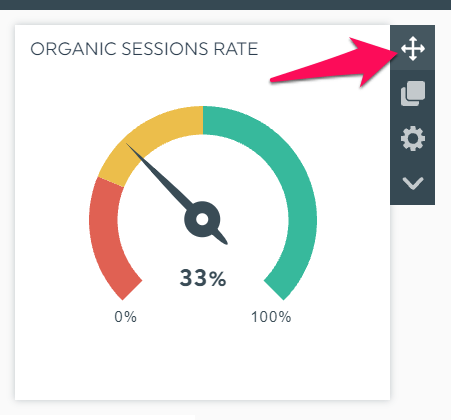
Besides dragging and dropping the widgets, you can also duplicate them or add notes to provide more information on a particular trend
Struggling to explain your insights via email or video?
Use the Comment widget to recommend your action plan. Clients will be able to review the results and your high-level insights in one place.
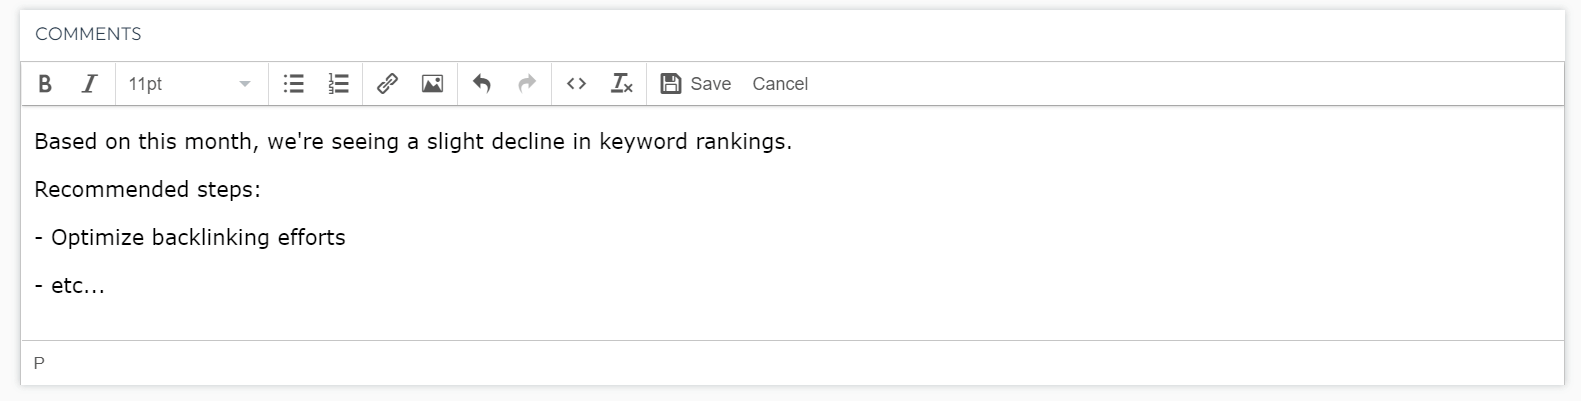
The Comment widget works similarly to a standard text editor. You can change the format of the text or add an image to help clients visualize the information.
With an automated marketing reporting tool like DashThis, you never have to wonder how to write an analysis report ever again. Our AI Insights feature turns your dashboards into clear, actionable takeaways. With AI Insights Pro, you can ask custom questions in Chat Mode and get analysis tailored to your goals.
Start your 15-day FREE trial today.
Analytical Report Examples
Executive Report Template
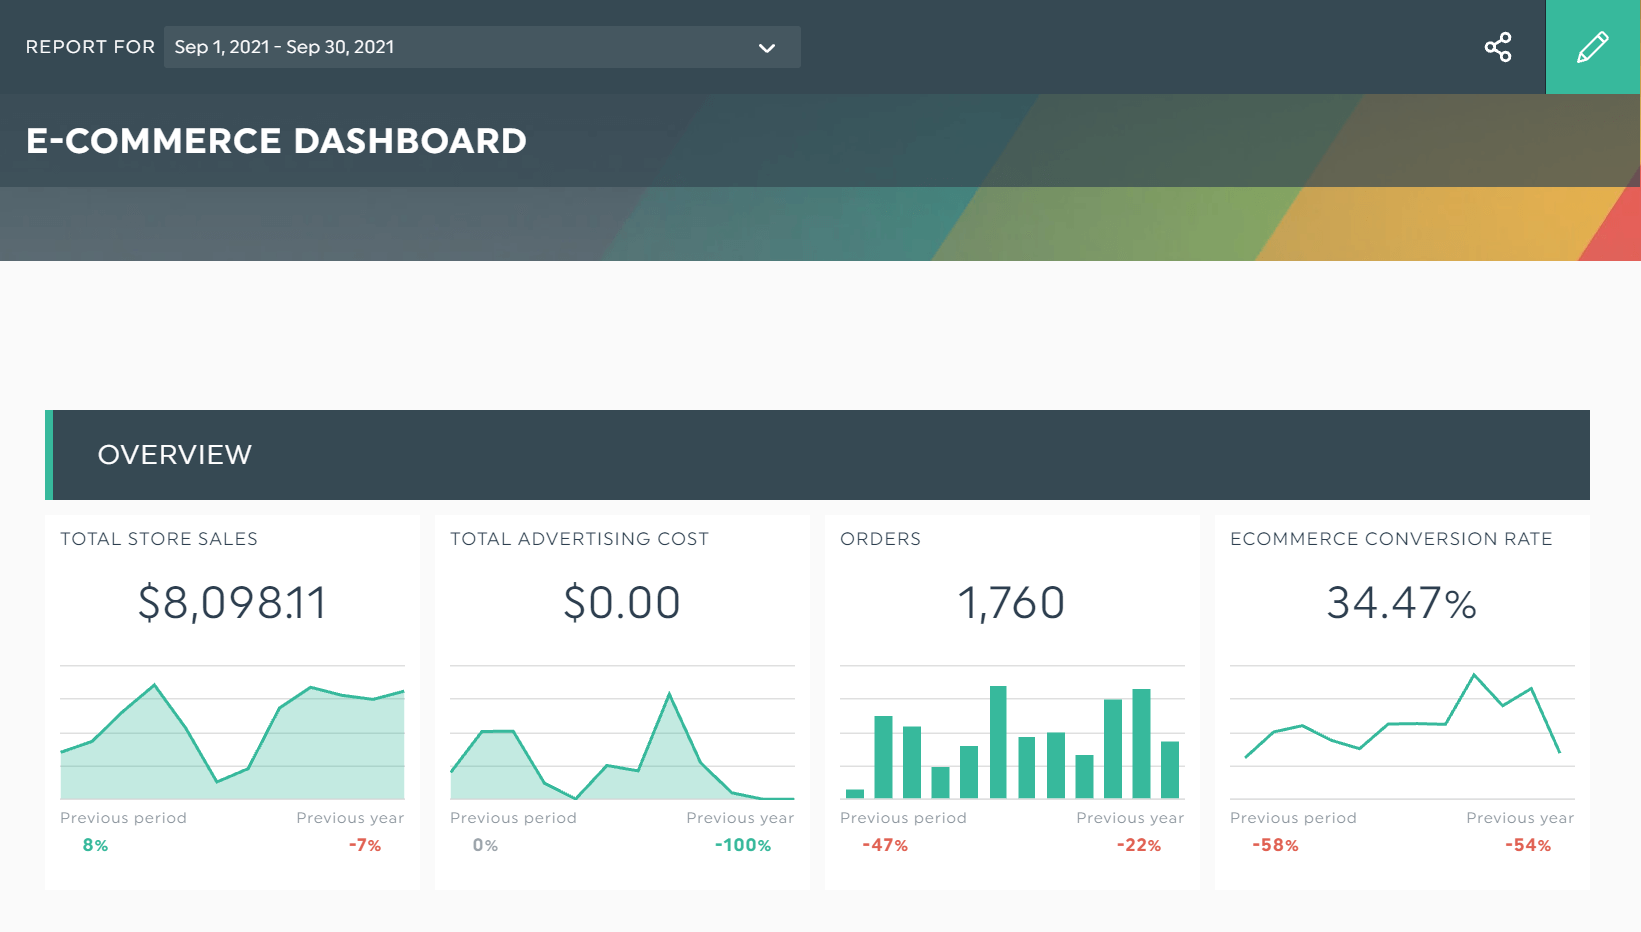
An executive report is the crystal ball to every C-suite executive. Here we have a dashboard that instantly informs of the business’s bottom line.
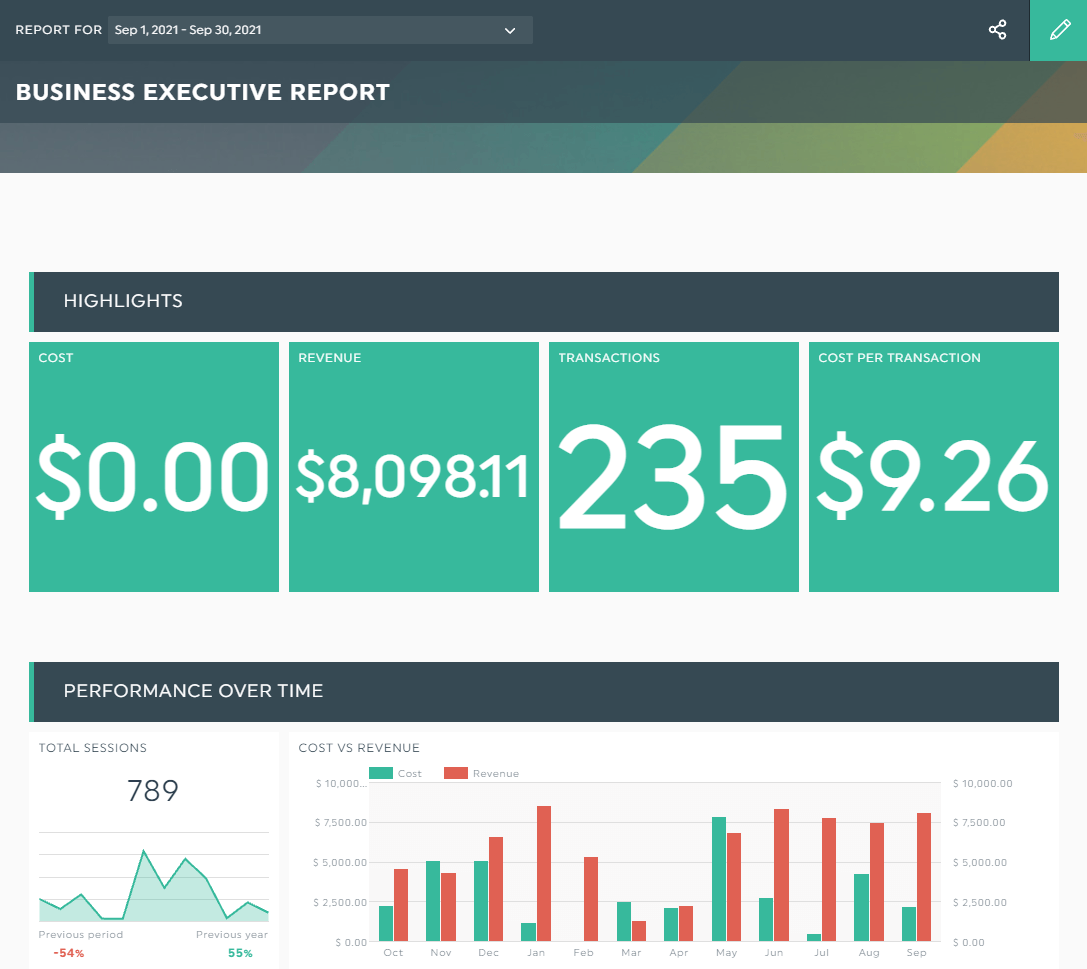
Grab this business executive analytical report with your own data!
The Highlights tab shows the total revenue in September, breaking down the number of transactions and the cost of each.
As you scroll down the report, you’ll see a cost vs. revenue comparison chart.
For any executive who wants to speed up decision-making, like adapting their business processes for effective cost containment, these graphs and charts are a bonanza of insights.
Digital Marketing Report Template
According to PFL’s multichannel marketing report in 2020, 77% of marketers report the best response rates when they use four to six marketing channels.
Should you use these many channels for marketing your business? There's only one way to tell, and it's using a digital marketing dashboard to determine your best-performing channels once and for all.
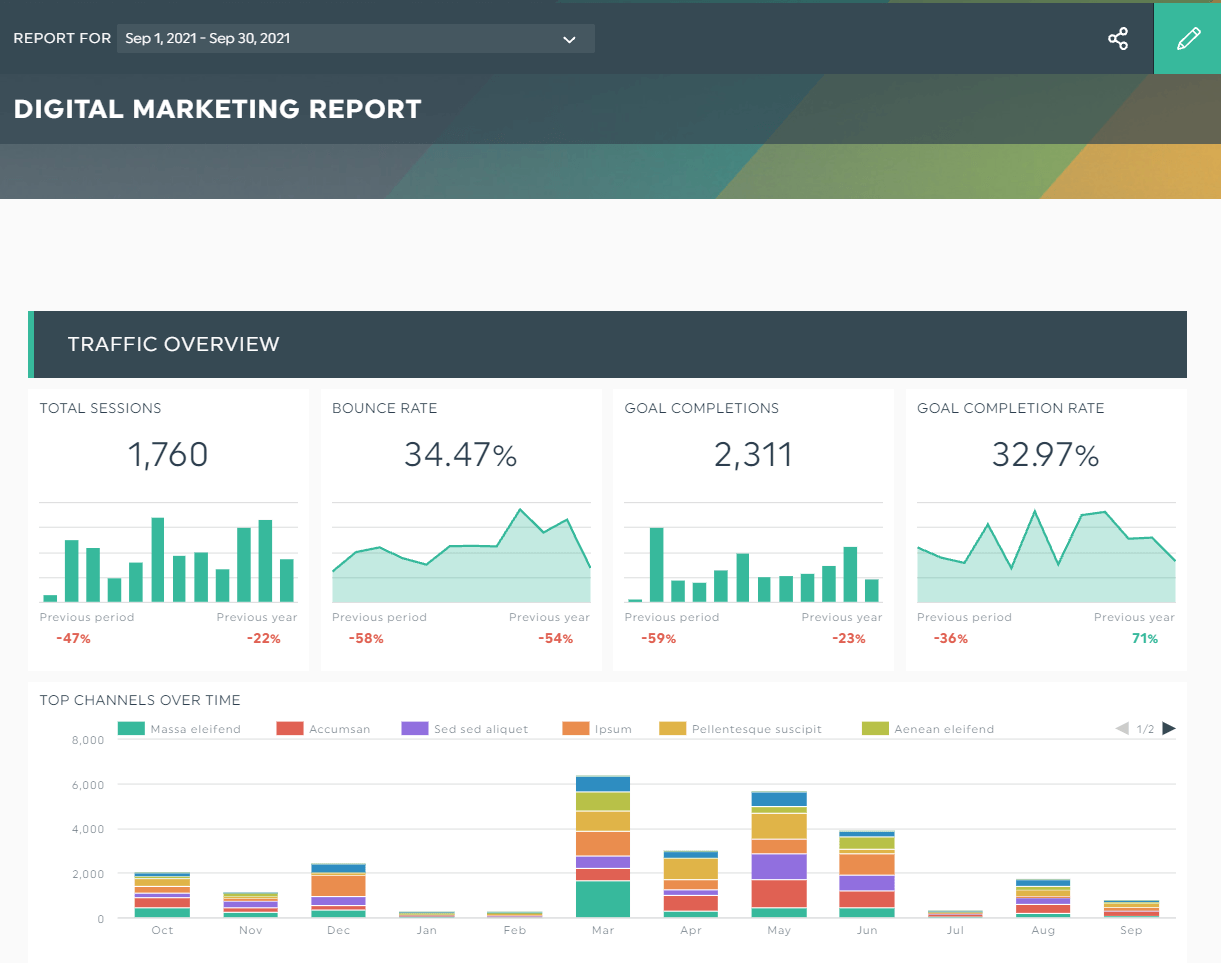
Grab this digital marketing analytical report with your own data!
If you want to improve the user experience and understand how customers find you, look no further than these digital marketing KPIs.
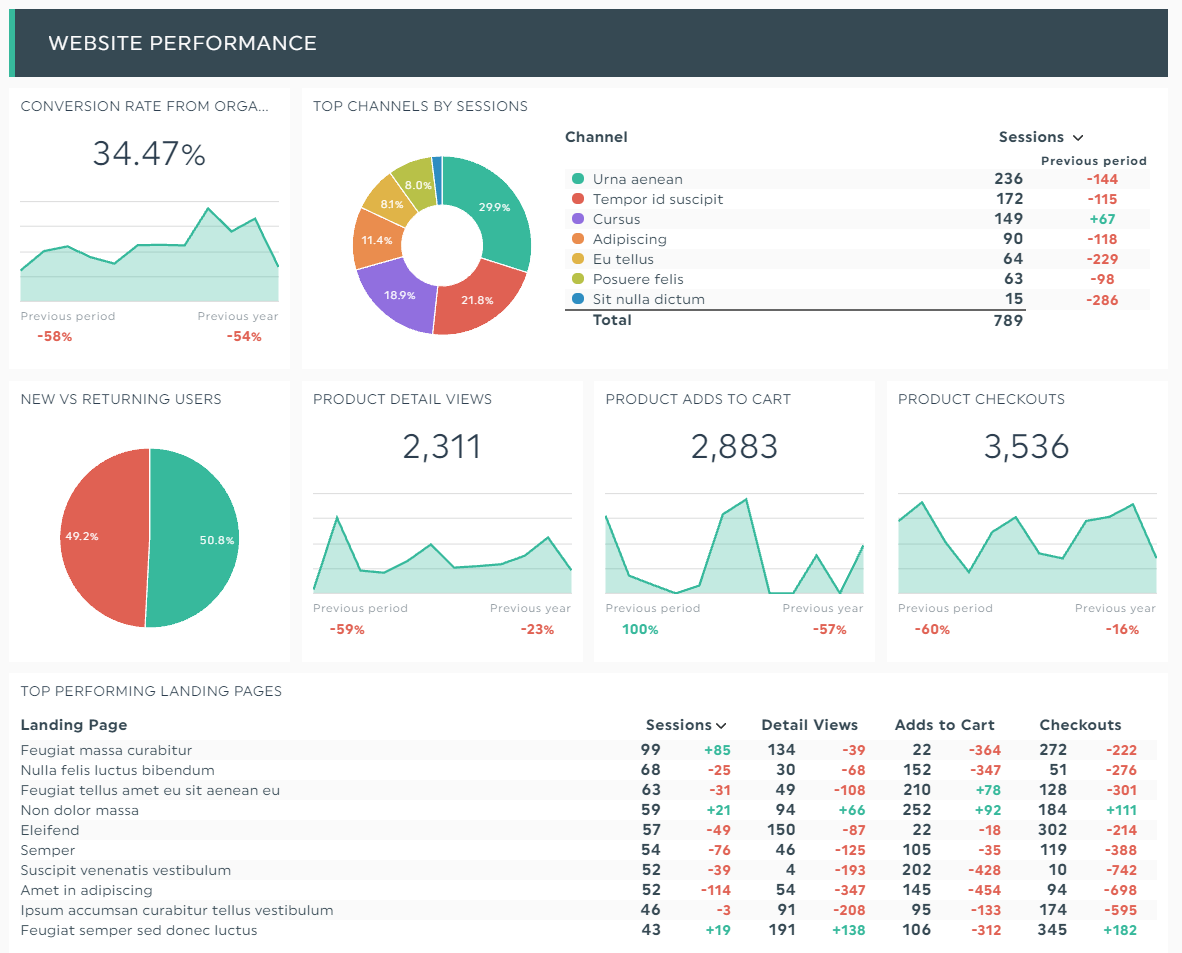
SEO Report Template
SEO can be mind-blogging for folks without expertise. All the more reason you want to create an interactive SEO report template while explaining your strategy to clients.
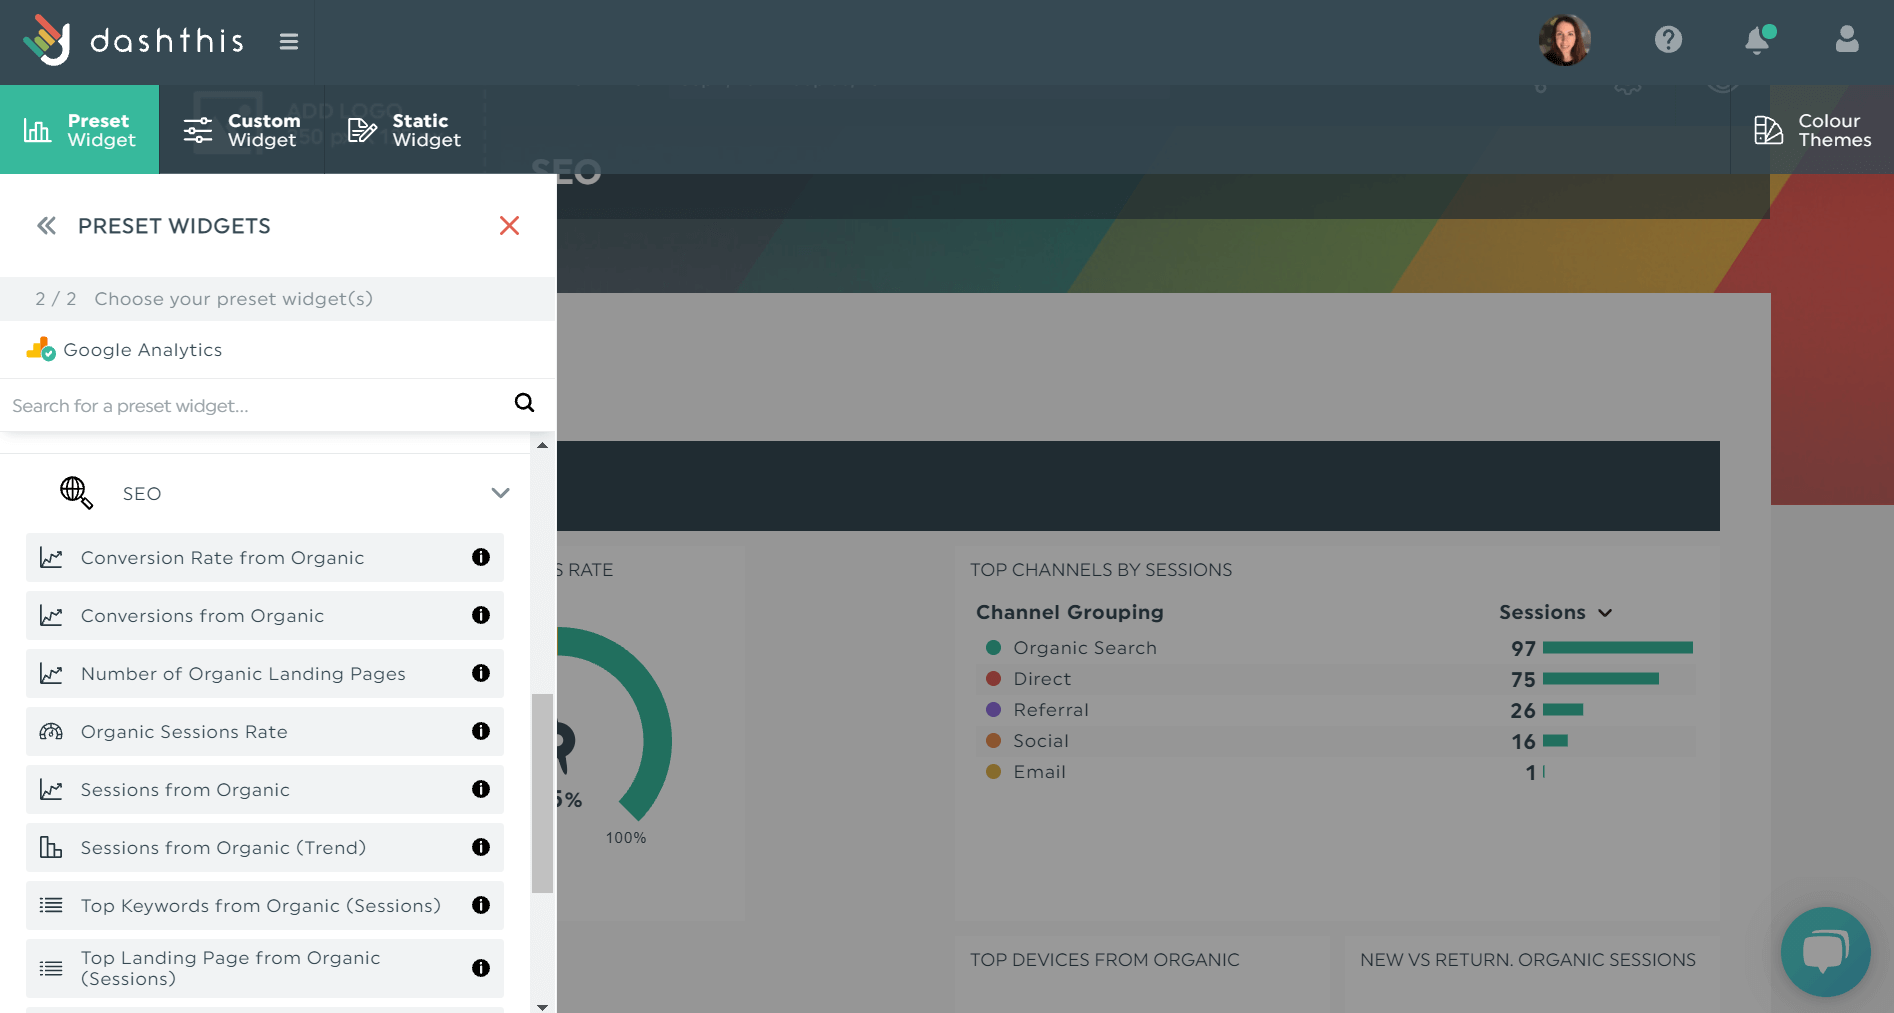
This SEO dashboard shows the breakdown of organic traffic, including conversion rate and the top channels by session.
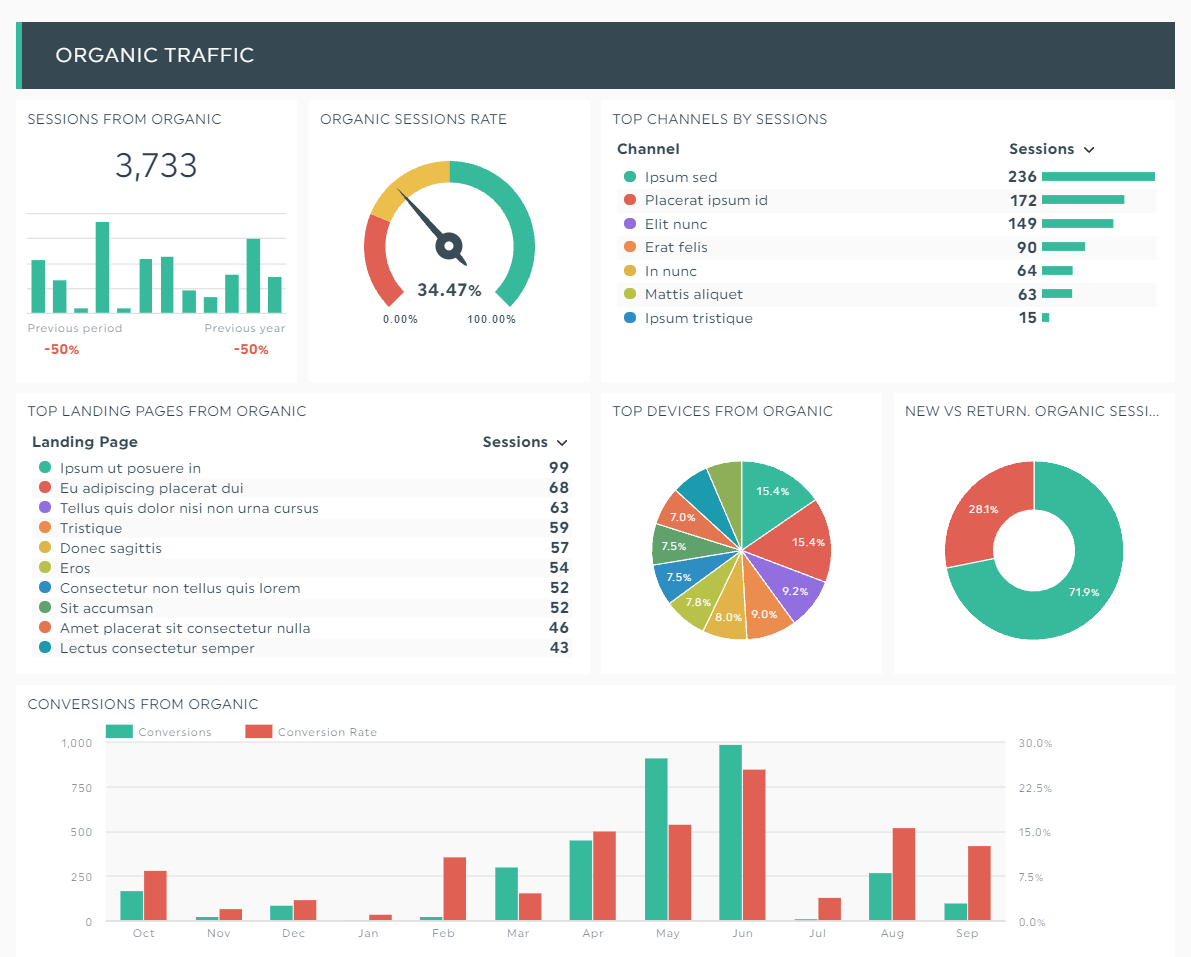
Grab this SEO report template with your own data!
It’s a breeze to back up your SEO strategies with a visual dashboard.
For instance, if you’d been using different techniques for different landing pages, you can easily show clients how these results stack up against each other, along with your proposed solutions, to improve their rankings.
Ecommerce Report Template
Google Analytics is the secret weapon to growing your ecommerce store.
Note how the ecommerce report below untangles large amounts of information by transforming them into comprehensible pie charts and graphs.
Grab this ecommerce analytical report with your own data!
This ecommerce dashboard gives you a complete view of your ecommerce metrics.
For example, the top-performing landing pages help you figure out how to improve them to get more customers to check out.
Social Media Report Template
When it comes to social media, it’s all about building awareness and turning customers into advocates.
In our second last analytical report example, we see a multi-channel report featuring Twitter and Instagram.
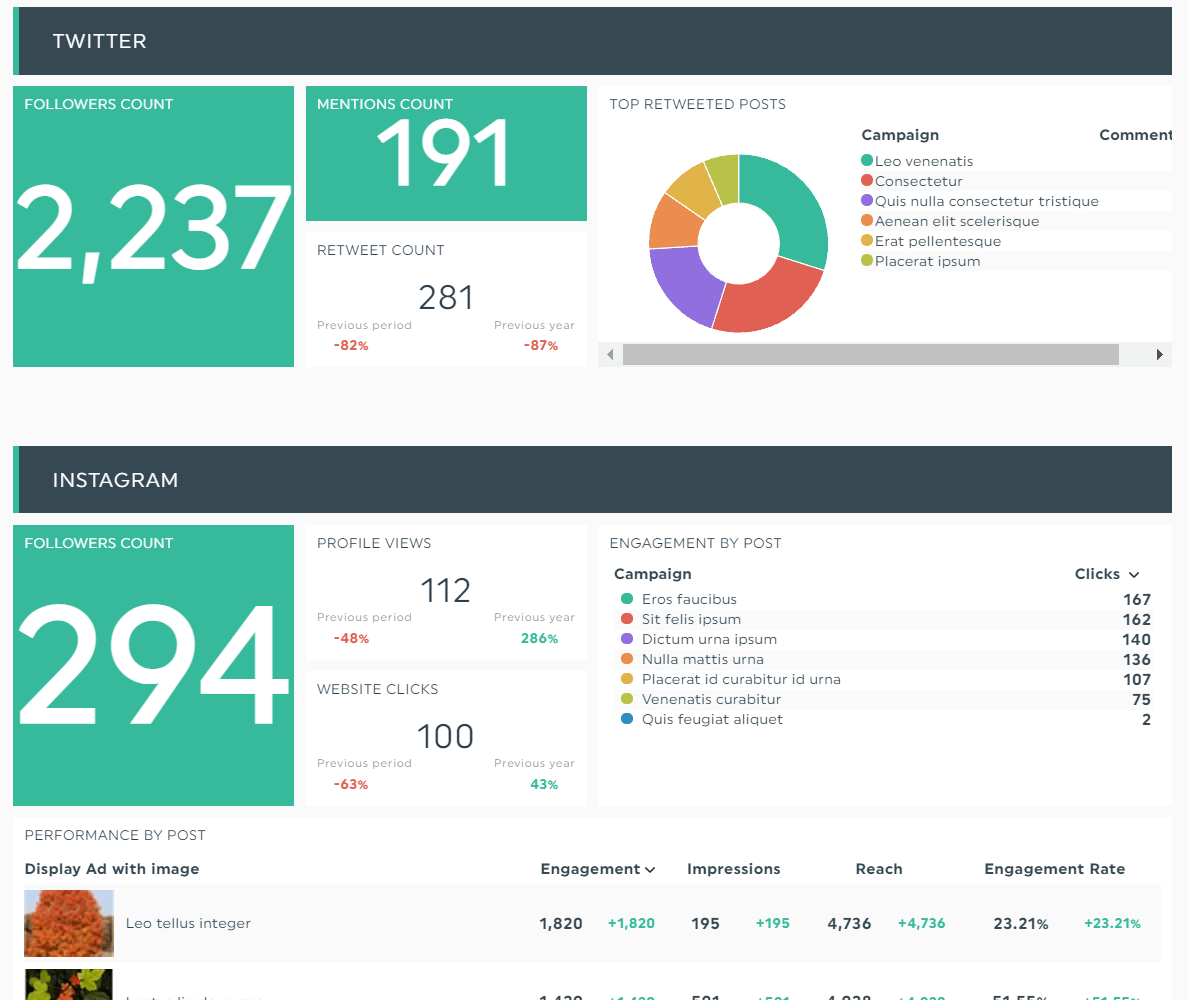
Grab this social media analytical report with your own data!
This dashboard goes beyond displaying social media KPIs. Did you spot the display ad with an image at the bottom? It helps clients see their posts in action.
PPC Report Template
No client wants to waste their ad budget on the wrong customers. In this PPC dashboard, we see the most critical Google Ads metrics that show whether you’re earning better ROAs.
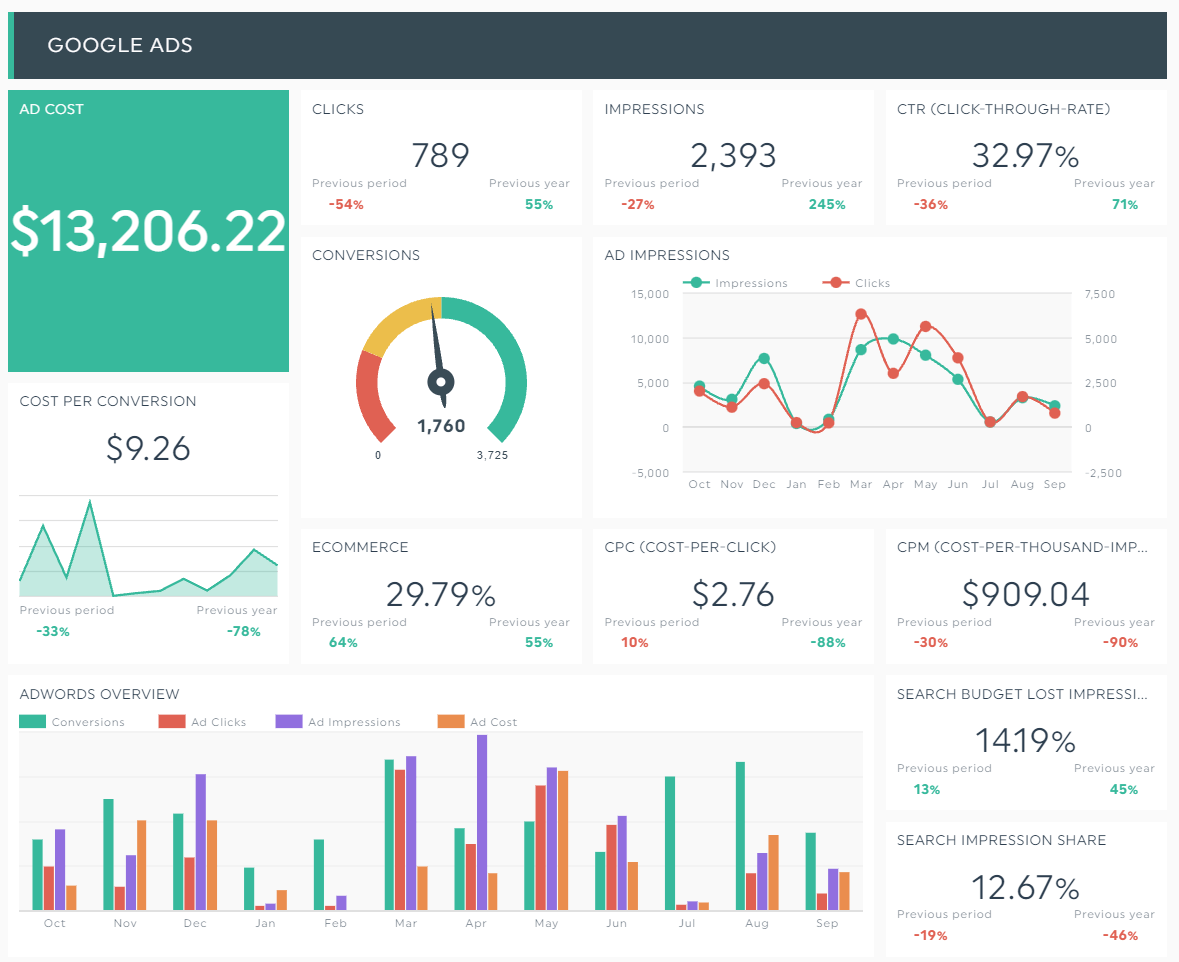
Grab this PPC analytical report with your own data!
With the insights you’ve gathered in this report—from demographics targeting and structuring ad groups—you’ll know how to reap higher returns on your PPC ad spend.
Create Your Analytical Report On DashThis Today
You should create a data analysis report before adapting any business strategy.
Not only does it prove your results and back up recommendations to clients, but it also helps these decision-makers to make informed decisions.
Back then, we used to go through multiple hoops to create reports. Gather data from seven different channels, take screenshots, paste said screenshots into a word doc, and download as a PDF.
It takes too long. Worse, it looks unprofessional.
Fortunately, automated reporting tools make it a snap.
DashThis connects all marketing channels in a single report. From Facebook and YouTube to Google Search Console and Ahrefs, you can finally create analytical reports that excite clients to read.
Start your 15-day FREE trial today.

Ready to automate your reporting?
Read More

Don’t miss out!
Follow us on social media to stay tuned!
Automate your reports!
Bring all your marketing data into one automated report.
Try dashthis for free