Social Media KPIs: The 12 Most Important Metrics to Track

Inspiration should never dictate your social media strategy. That job belongs to tracking the right social media KPIs.
But with dozens of metrics available across every platform, figuring out which ones actually matter for your goals? That's where most marketers get stuck.
This guide breaks down the 12 most important social media KPIs to track, organized by category, so you can build smarter reports and show real results to your clients.
- What are Social Media KPIs?
- How to Track Your Social Media KPIs?
- Top Social Media KPIs to Track
- - Reach KPIs
- - Community Growth KPIs
- - Engagement Rate KPIs
- - Website Visits from Social Media KPIs
- - Conversion from Social Media KPIs
- Automate Your Social Media Marketing Efforts
What are Social Media KPIs?
Social media key performance indicators (KPIs) measure how your social networks perform. In other words, these metrics track if you’re meeting—or exceeding—your goals so that you can plan the next best course of action.

Grab this social media report template
At its core, social media KPIs convey the return on investment (ROI) to your clients. In the short- and long-term, you can even:
- Identify the best-performing strategies that lead to a high conversion rate, whether it’s attracting more link clicks for a Facebook Ad, boosting the follower count of your LinkedIn page, or upping the retweets for your 100th tweet.
- Back up your social media marketing strategy to clients and retain them for future marketing campaigns.
- Prove the value of digital marketing and get buy-in from your boss when you’re buying new social media management software. Your battle-tested results will help justify the cost.
- Hit your business goals and gain a few steps closer to achieving an astonishing bottom line.
The benefits of measuring your social media metrics don’t just revolve around increasing the number of followers.
By monitoring your social media efforts more closely, you also become better marketers.
How to Track Your Social Media KPIs?
Given the vast amount of data involved, you need a robust social media analytics tool to stay on top of all your channels.
Bonus if it takes a few quick steps.
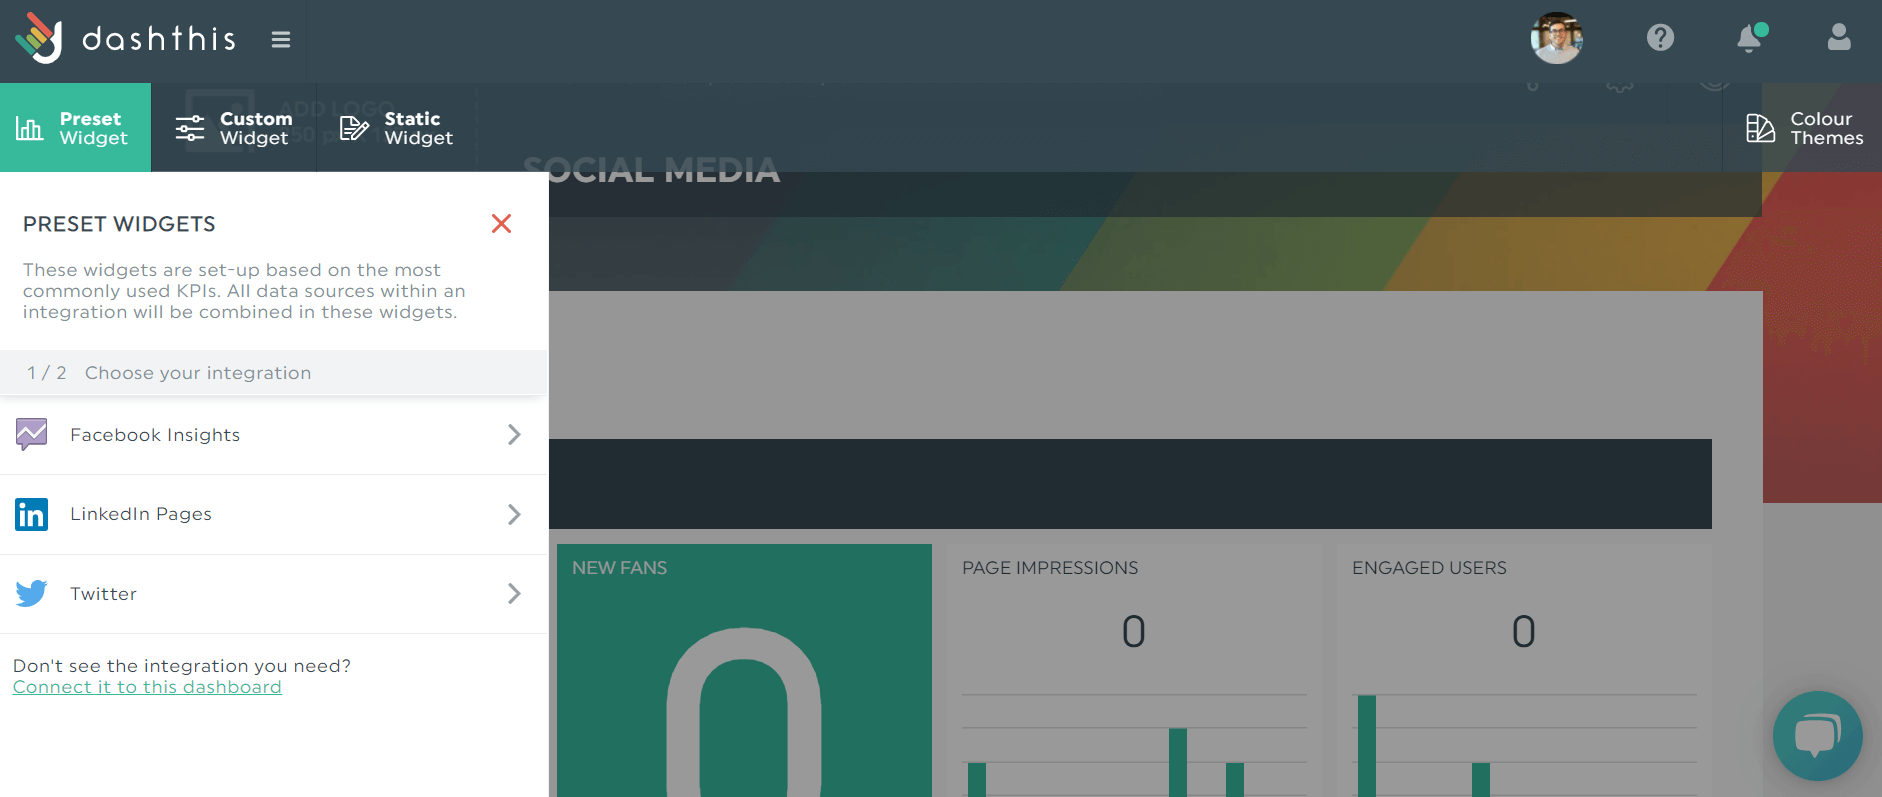
DashThis is an automated reporting tool that helps you present your hard-earned results in a beautiful social media report. All you have to do is:
- Connect your favorite social media reporting tools
- Select your KPIs from DashThis’ premade widgets
- Drag and drop as you desire
No more messy spreadsheets or going from one social media platform to another to grab your data. DashThis is a massive time-saver for every busy social media manager.
With DashThis, you can gather your desired KPI with a click and combine all your social networks—from a Facebook page to YouTube—into one social media marketing dashboard.
Sign up for your free 15-day trial on DashThis today.
Top Social Media KPIs to Track
Reach KPIs
This one’s all about brand awareness.
Reach KPIs tell you how your brand influences your target audience—for instance, the number of people who saw your social media post on their newsfeed.
Here are three types of reach KPIs.
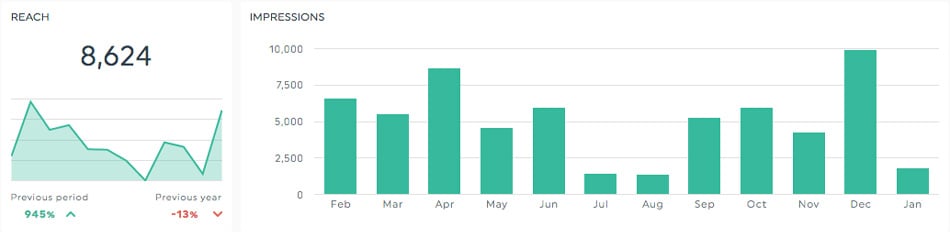
- Total Reach: Total number of unique users who have seen your piece of content. Another similar KPI, Potential Reach, tells you the number of users who might see your content during a period.
- Total Impressions: Total number of times your social media content from your page is displayed (clicked or not). Note that one user can have many impressions for a single content.
- Share of Voice (SOV): Number of times your brand is mentioned on social media vs. number of times your competitor is mentioned.
You can drill down into the specifics—everyone’s got that one client, amiright?—with DashThis’ pre-made widgets.
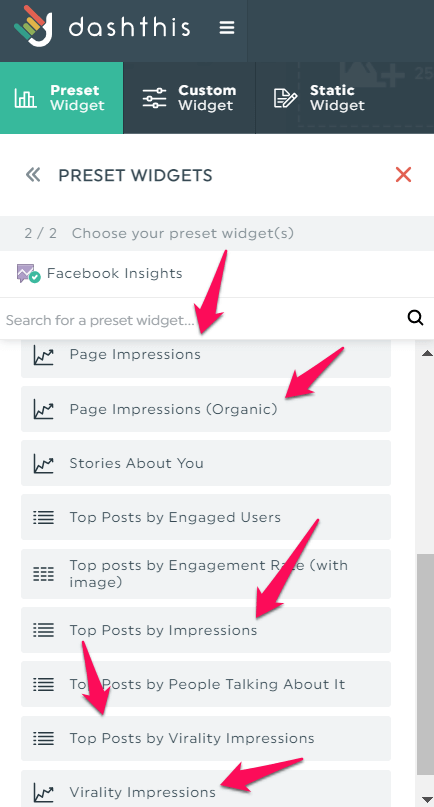
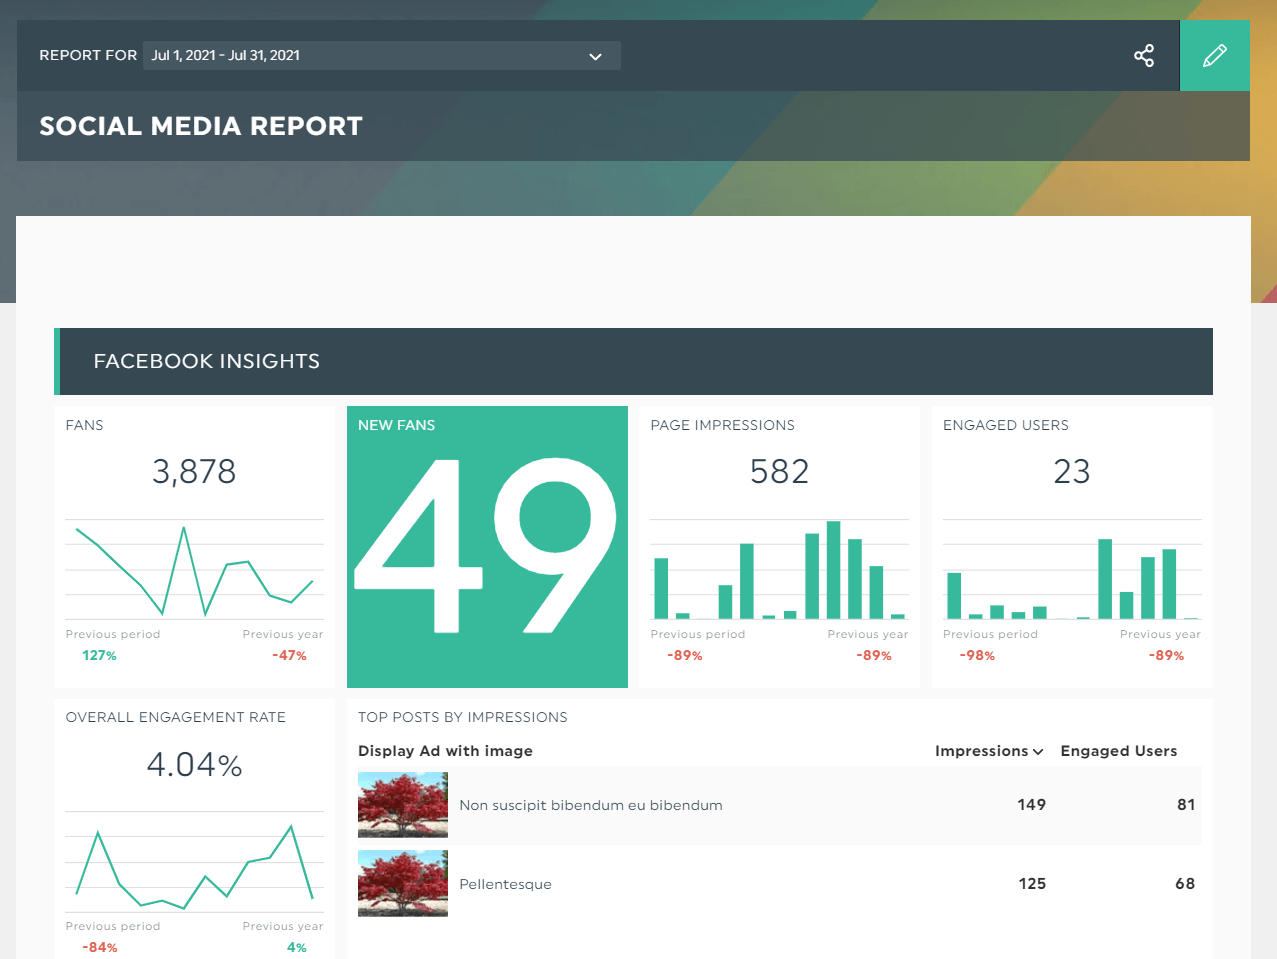
For example, here’s how it looks in a Facebook Insights report. Note the different types of impressions KPIs. Here are organic page impressions, top posts by impressions, and virality impressions.
Your reach KPIs should be the first on your list. Social media users can’t interact with you if they don’t know your brand exists!
Community Growth KPIs
Taking the second spot on our list is community growth KPIs. This is where you’ll find out about your growth rate, and if your community is growing or stagnant.
In this case, we’re talking about KPIs like:
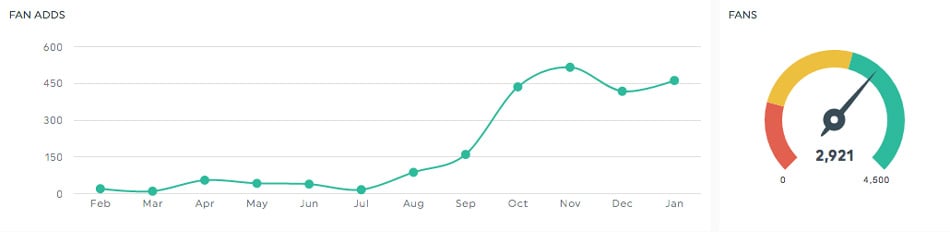
- New Subscribers: Number of new followers on your social media page within a period. Other similar KPIs include Fan Adds and New Followers.
- Total Subscribers: Total number of subscribers you attract within a period. Other similar KPIs include Page Likes and Total Followers.
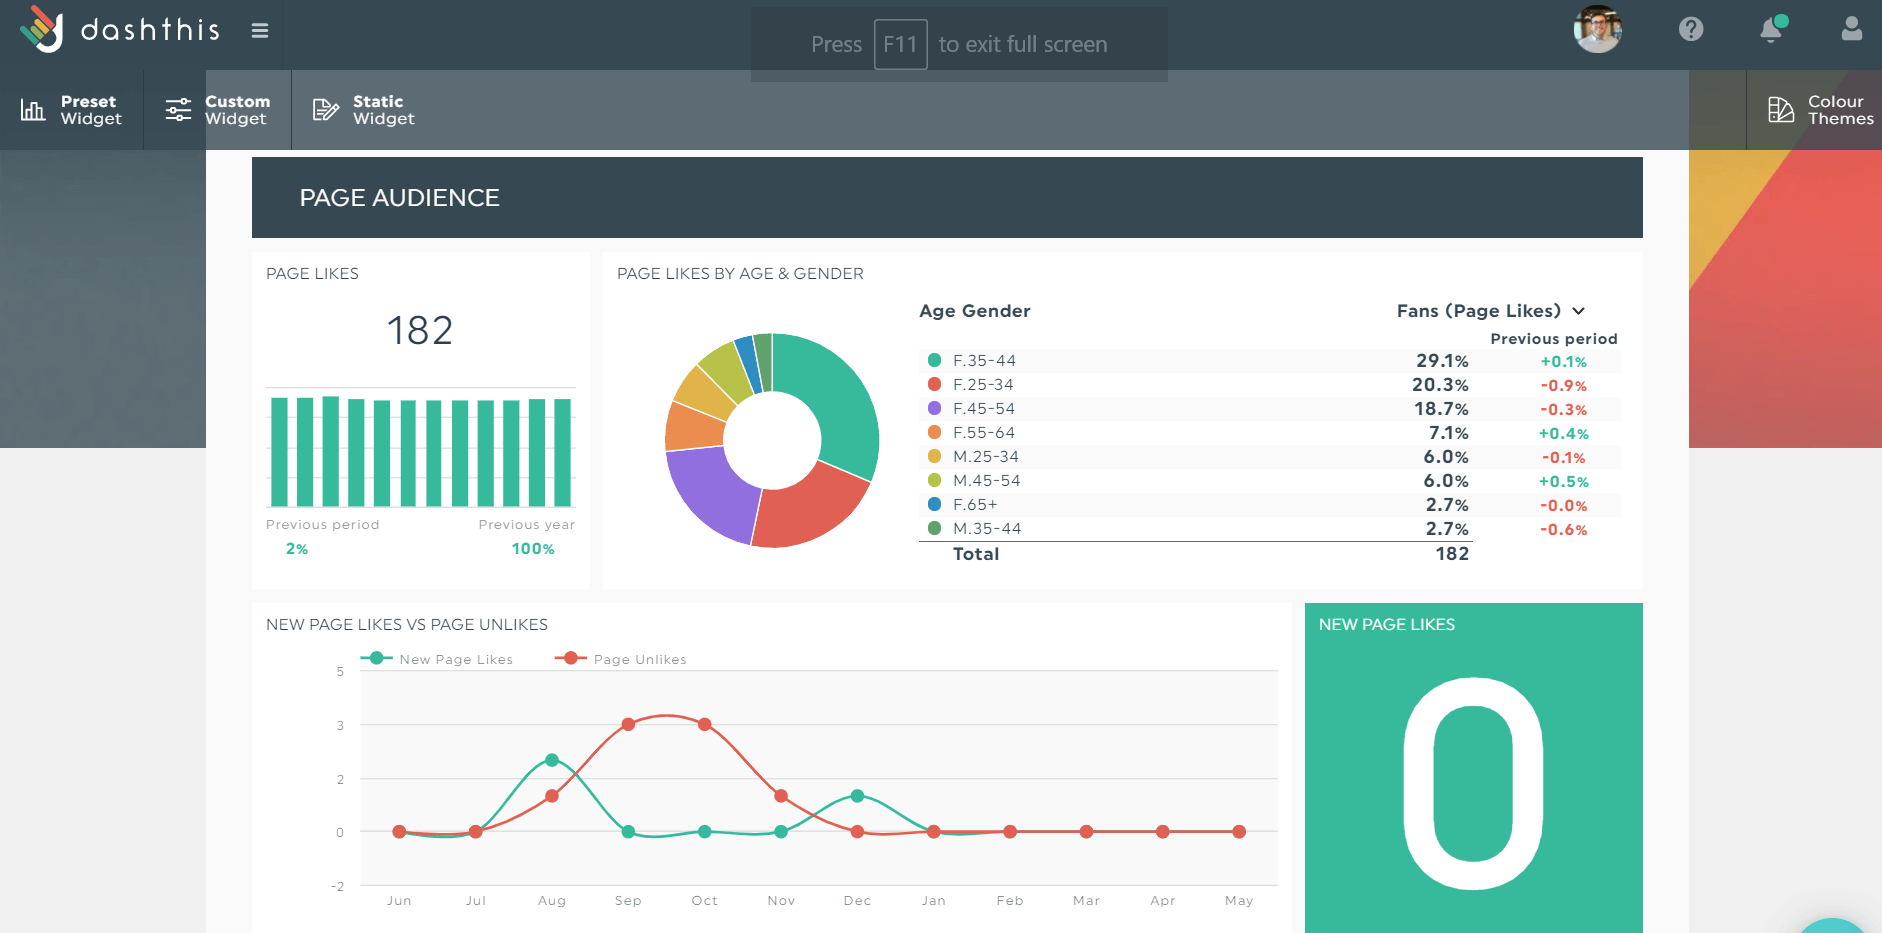
Break down your community growth KPIs according to the demographics. Once you click the preset widgets, DashThis automatically pulls the data and displays them in eye-catching charts and diagrams.
KPIs for community engagement are often referred to as vanity metrics, and it’s true—but only when there’s little to no community engagement. Case in point: An Instagram page with a whopping 100K followers but 17 likes per post is pointless.
Make sure you correlate these community growth KPIs with actionable metrics. For instance, see if there’s an increase in your page likes if you just implemented a content distribution strategy.
Engagement Rate KPIs
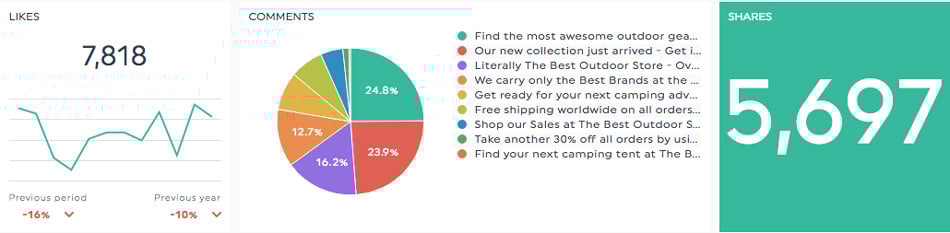
Engagement rate KPIs tell you how well your content resonates with your target audience. The more users interact with your posts or page, the more likely you’ll gain their trust, loyalty, and sales down the road.
Here are the social media engagement metrics you should monitor. Note that the terminology depends on the channel (e.g., Follower for Linkedin, likes for Instagram).
- Likes, Reactions, etc.: Number of likes (or reactions such as Celebrate and Love) a post received.
- Social Shares: Number of times a content has been shared on social media.
- Comments, Replies, etc.: Number of comments or replies a post received.
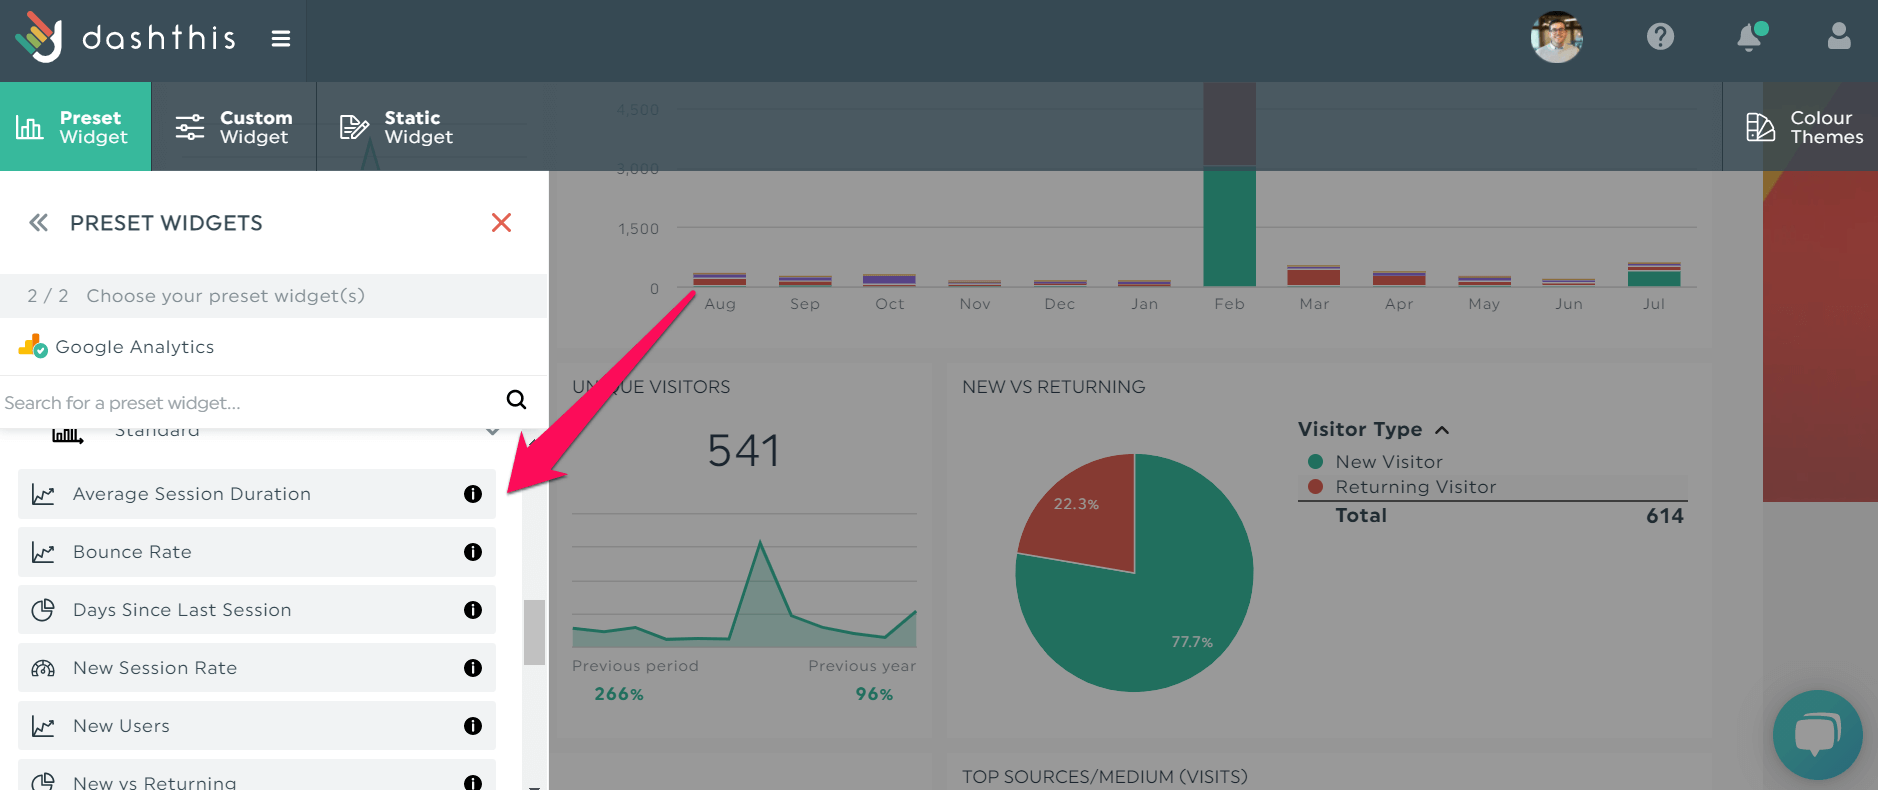
Website Visits from Social Media KPIs

It’s a waste of effort when user engagement doesn't convert to website traffic. Imagine constantly sharing your blog posts on your LinkedIn page, and not one user clicks it.
To gauge the effectiveness of your web visits from social media, hop on over to Google Analytics (GA) and focus on these popular KPIs.
- Sessions: Number of times users visit your website.
- New Users: Number of first-time web visitors. Running a new social media campaign? Measure this metric within a period to see how it specifically attracts new traffic.
- Pages per Session: Average number of pages visited during one session. The higher it is, the better. This shows users are spending a long time exploring your website.
- Average Session Duration: Average length of time a user spends on your website during one session. Correlate this metric with pages per session—this gives you an idea of the user’s behavior.
- Bounce Rate: Percentage of users that leave your website without taking any action. There are multiple reasons behind a high bounce rate. Common ones include slow loading and disconnected user experience (e.g., social media posts linking to irrelevant landing pages).
You know the drill. In your GA dashboard:
- Click Preset Widgets
- Select Standard
- Pick your KPIs
Pro Tip: Keep in mind the dimensions below; they’ll help you segment your data and identify your main website referrals.
- Channels: Combined traffic from all social media channels within a period. Click Acquisition > All Traffic > Channels > Social.
- Source: Origin of your website traffic. For example, if you spot “Google / CPC,” Google is the source.
- Medium: Category of the traffic source. Using the same example, “Google / CPC,” CPC is the medium.
These dimensions, especially Source and Medium, tells you the specific social platform that attracts your web visitors.
Conversion from Social Media KPIs
And now, the money-making metrics.
Social media conversion metrics tell you how your social networks impact your leads and revenue. As you include these KPIs in your Google Analytics dashboard, you can identify the exact steps visitors took from the first interaction to the final conversion.
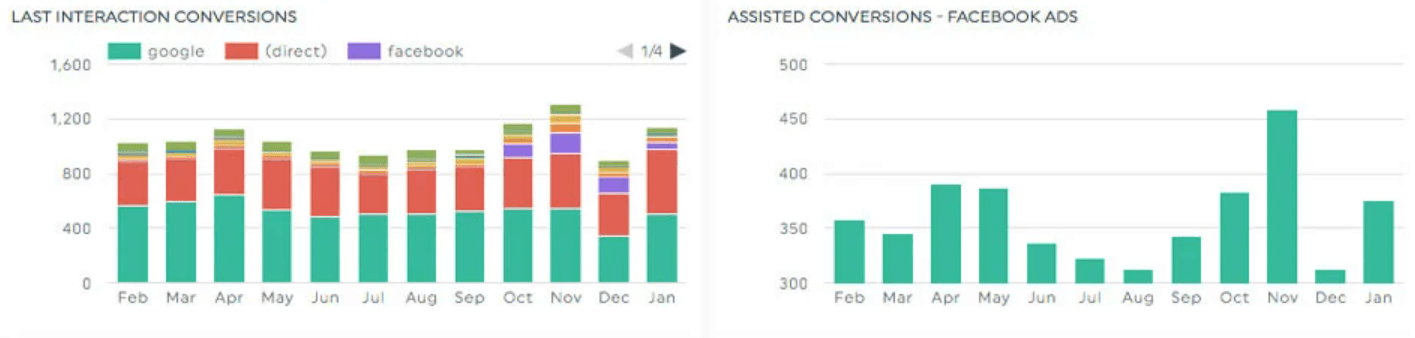
Here are the conversion metrics we recommend to track in your social media campaign report:
- Last Interaction Conversion: Web visitor’s last interaction before conversion.
- Assisted Conversion: Interactions that occurred along the conversion path (excluding last interaction).
- Conversion Rate: Number of converted users (e.g., bought a product) compared to the number of clicks on a single post. A similar KPI, Lead Conversion Rate, is the percentage of users who converted to leads.
- Cost-per-Click (CPC): Amount of money you pay for a single click of a sponsored post on your social media accounts.
- Click-Through Rate (CTR): Percentage of users who click on your post’s call-to-action (CTA) button.
Here’s an example of how a Google Analytics report might look if you use it to track your social media performance.
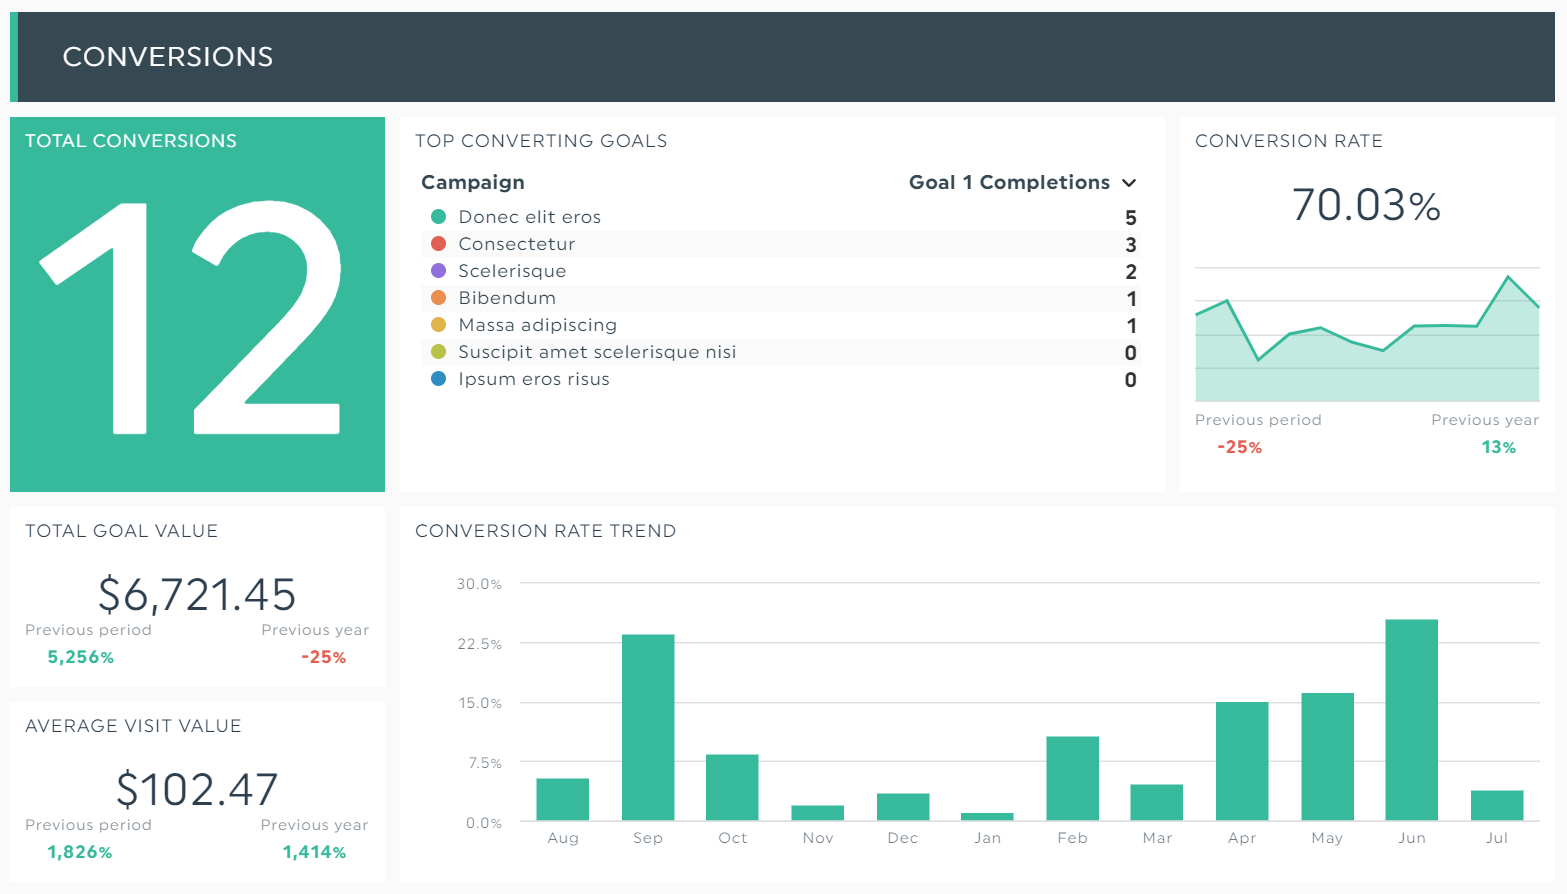
Conversion metrics are the “meat” of your social media reporting—clients want to know which are the best social media channels that bring in the biggest ROI. So, don’t skip it!
Automate Your Social Media content Marketing Efforts
These important social media KPIs dictate the next step in your marketing.
On top of conveying your ROI, they also help you identify the best strategies, get buy-in from your boss, back up your plan with rock-solid proof, and more. You can also take advantage of AI insights to automatically surface trends and anomalies in your social media data.
Gather all your social media KPIs across multiple channels on DashThis.
You can’t see it, but this automated report actually shows results from Facebook Insights, Facebook Ads, Instagram, LinkedIn, and YouTube!
Sign up for your free 15-day trial to automate social media reporting, showcase all social networks’ performance in a single report, and wow your clients today.
Here's a video showing just how easy it is to create your social media report in DashThis:

Ready to automate your reporting?
Read More

Don’t miss out!
Follow us on social media to stay tuned!
Automate your reports!
Bring all your marketing data into one automated report.
Try dashthis for free