How To Write A Social Media Report [Template Included]

Creating a social media report is a lot of work —especially when you have multiple social media marketing campaigns going on.
On top of pulling data from different channels (just the thought of hopping from one social media analytics tool to another makes our head spin!), you also need to identify the most successful ones and show clients they’re getting their money’s worth.
Want to spend less time creating effective reports? You’ve landed on the right corner of the internet.
Today, you’ll learn how to write a social media report (with a free template) that retains clients for good. Here’s what we’re going to cover:
- What is a Social Media Report?
- Social media report template
- How to Create a Social Media Report?
- What Should be Included in a Social Media Report?
- Wrapping Up: How Do You Analyze Social Media?
What is a Social Media Report?
A social media report is a document that shows your social networks’ performance over a period of time. It includes crucial social media metrics like engagement, reach, and conversions.
If you work in marketing agencies, you’d know this report also serves as a project deliverable—it tells clients the results and returns on investment (ROI) from your collaboration.
In other words, a social media report plays a massive role in retention! You’re not only presenting the results of your marketing efforts. What you’re really doing is proving to clients the priceless value you bring to the table.
Based on our experience working with marketing agencies, here are the three qualities that make an effective social media report:
- Attractive: Beautiful visuals attract people’s desire to read content by 80%. So, if you want to boost engagement, start adding colors, graphs, and unique themes to represent your agency.
- Client-friendly: Your social media report shouldn’t show endless rows and columns. Ideally, it should be easy to digest and understand—preferably in a few minutes.
- Shareability: Time is of the essence. It should take a few quick clicks to share your social media report, whether it’s to your boss for their approval or a client for review. Bonus if you can share it in various formats (e.g., PDF, email, URL).
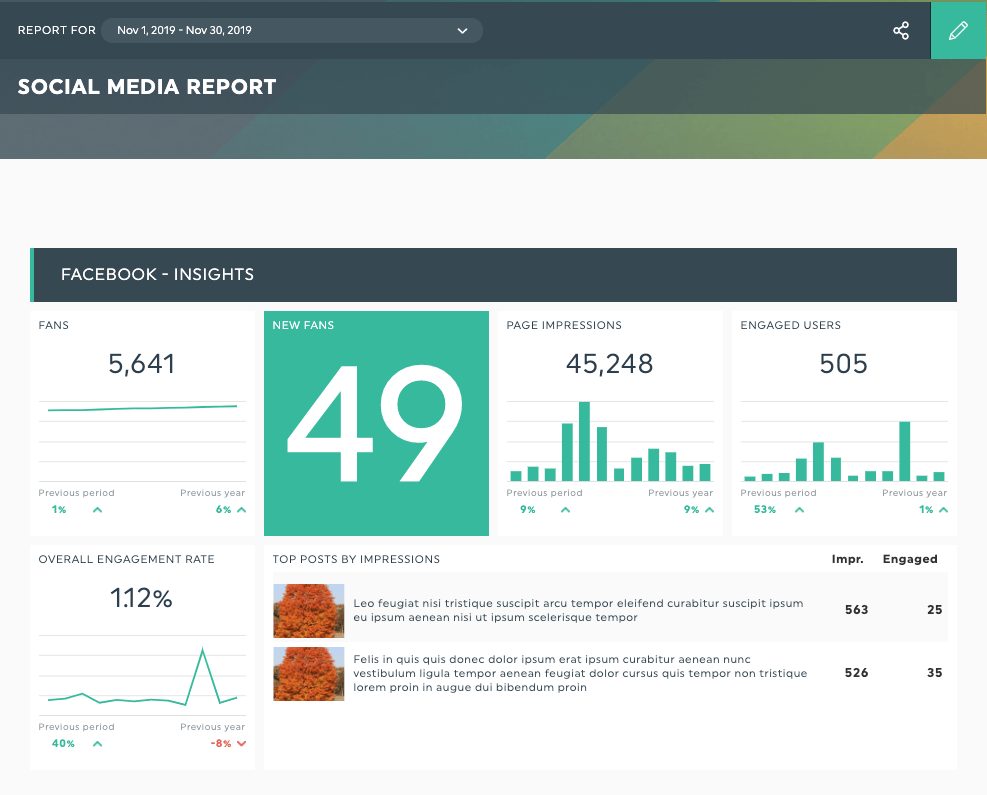
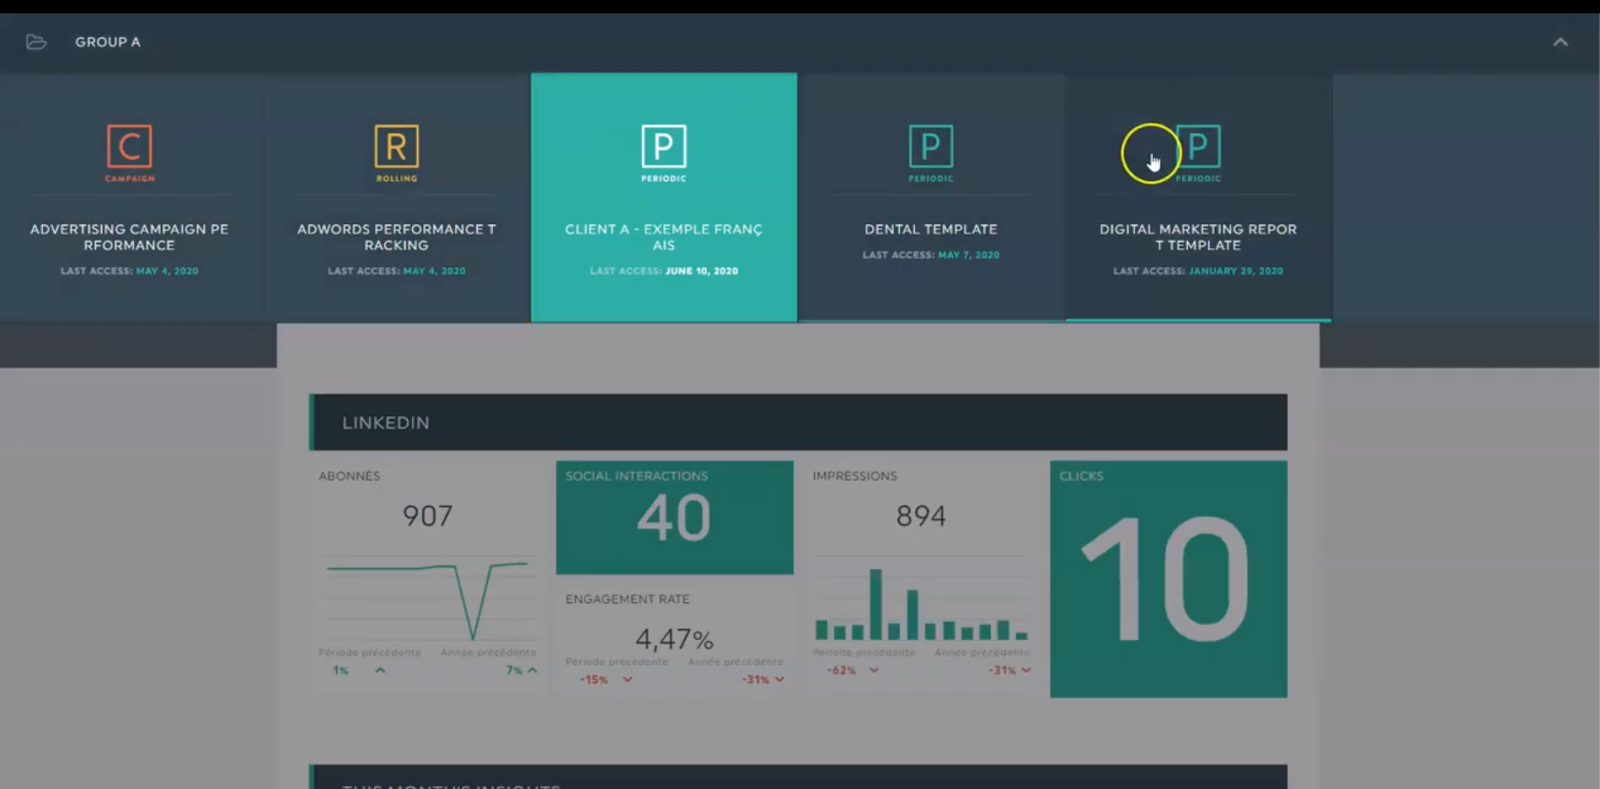
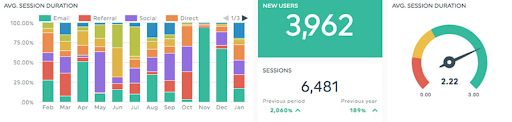
Take this social media report, for instance. It pulls data from multiple social media channels: Facebook, LinkedIn, Instagram and youtube.
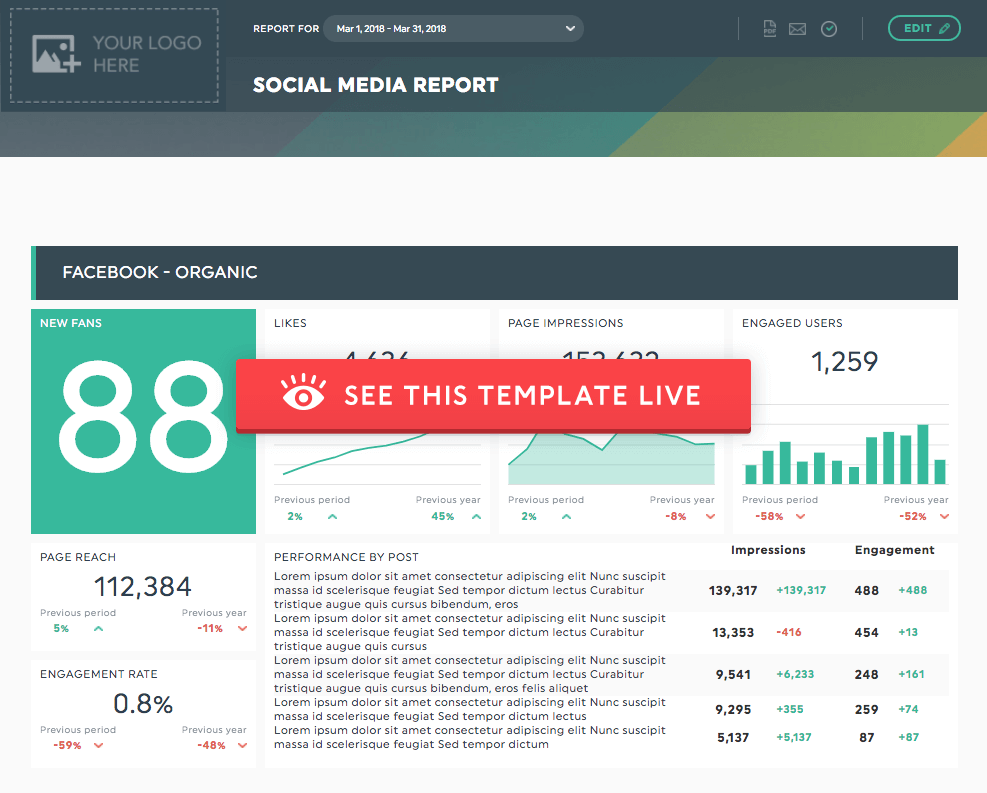
DashThis is a social media reporting tool that gathers data from all your social media channels in one automated report. Try this free social media report template with your own data.
Notice how easy it is to digest the data right away? There’s no overwhelming data insight (looking at you, Microsoft Excel and Google Sheets). Instead, here’s what you see: Insights that show how you’re doing and what needs to be improved. Just the key metrics you need for your social media analytics report.
Now that’s what we call an impressive social media report.
Sign up for your DashThis 15-day FREE trial today. Save up to 10 hours of work a week and create your social media reports in the blink of an eye. No credit card is required.
How to Create a Social Media Report?
Creating social media reports doesn’t need to be a mind-numbing process. In this section, we’ll prove to you that it requires only a few minutes.
Let’s imagine you’re creating a social media report for a B2C ecommerce client that hired you for Facebook Insights and Instagram Insights (for the months June-July 2021).
Option 1. Use a Social Media Reporting Template
Cobbling analytics across multiple social media platforms eats up a lot of time. Here’s a time-saving trick we recommend:
- Select your preferred integrations (in this case, Facebook Insights, and Instagram Insights)
- Choose the social media report template (all popular KPIs are directly included in all templates)
- Pick your desired KPIs under Preset Widgets
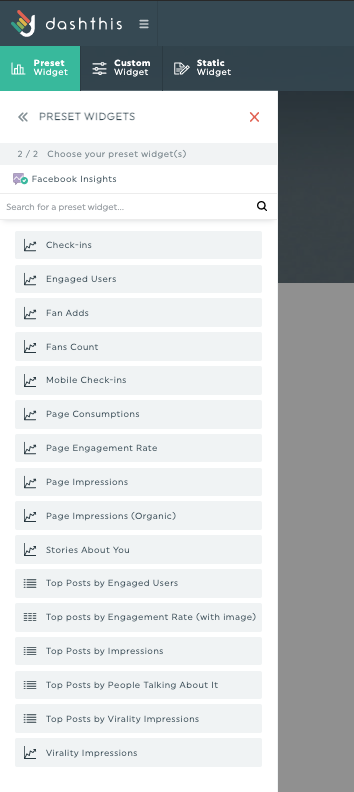
DashThis’ preset widgets help you save time from manually adding KPIs to your social media report. Pro Tip: If you can’t find the KPIs you want, create them with Custom Widgets.
Drag and drop the KPI widgets as you like.
You have full control of the layout and look of your social media report.
Option 2. Create a Social Media Report From Scratch
Prefer to build your social media report using a blank canvas? Here’s how to do it:
- Choose your preferred integrations (in this case, Facebook Insights, and Instagram Insights);
- Click Blank Periodic Dashboard;
- Select your desired KPIs under Preset Widgets or Custom Widgets.
![]()
Pro Tip: If you want to add comments and a header in your report manually, click Static Widgets.
Then drag, drop and tweak your report accordingly.
Bonus Tip: Want to add an extra oomph to your social media reporting? Check out our white label options to get custom reports to fit your brand.
You’ll even get a personalized link branded to your business' URL
Here are three final tips to make the most out of DashThis:
1- Save Your Template for Future Use
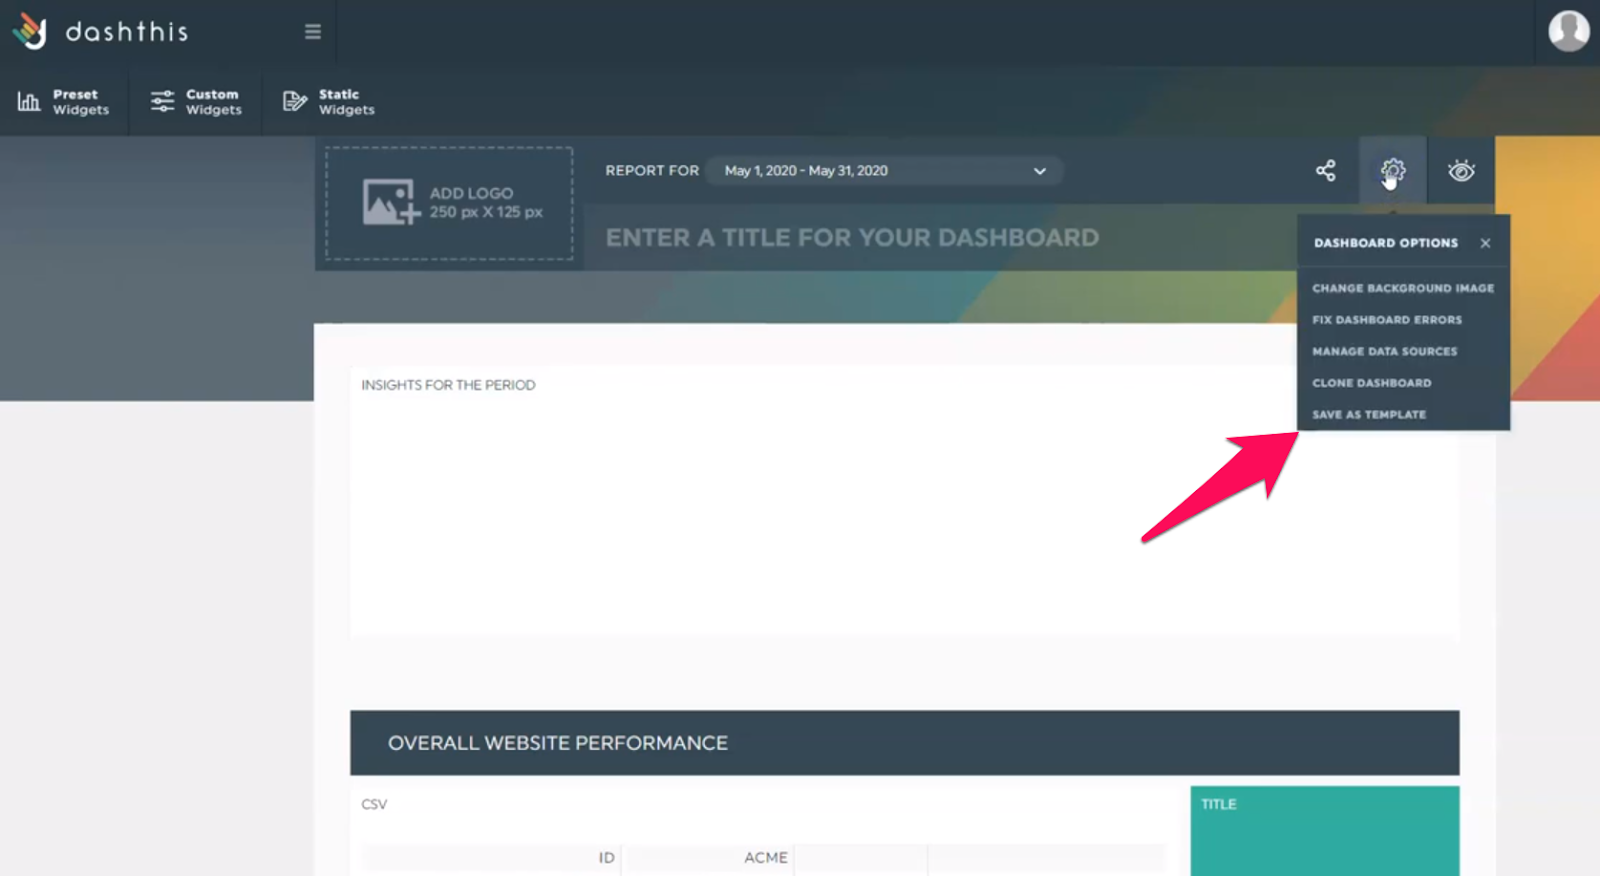
Customize an existing dashboard or create a new one from scratch, DashThis enables you to save it as a template for future use. You can even clone it and select your preferences accordingly. You'll have a monthly report with all your company page data, social media campaigns metrics, from all your best social media channels, all in one automated report.
2- Automate Your Deliverable Strategy
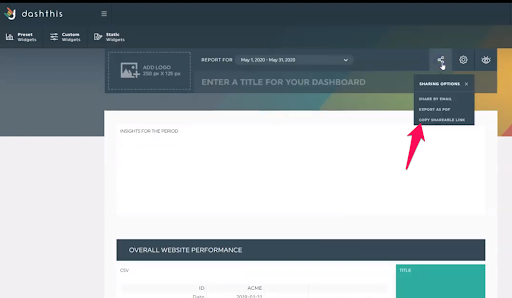
DashThis offers three sharing options:
- PDF;
- Shareable URL link;
- Email (Tip: To automate your report, select your desired time frame under Frequency).
Choose the most convenient option for your client and share it away.
3- Leverage the Groups Option
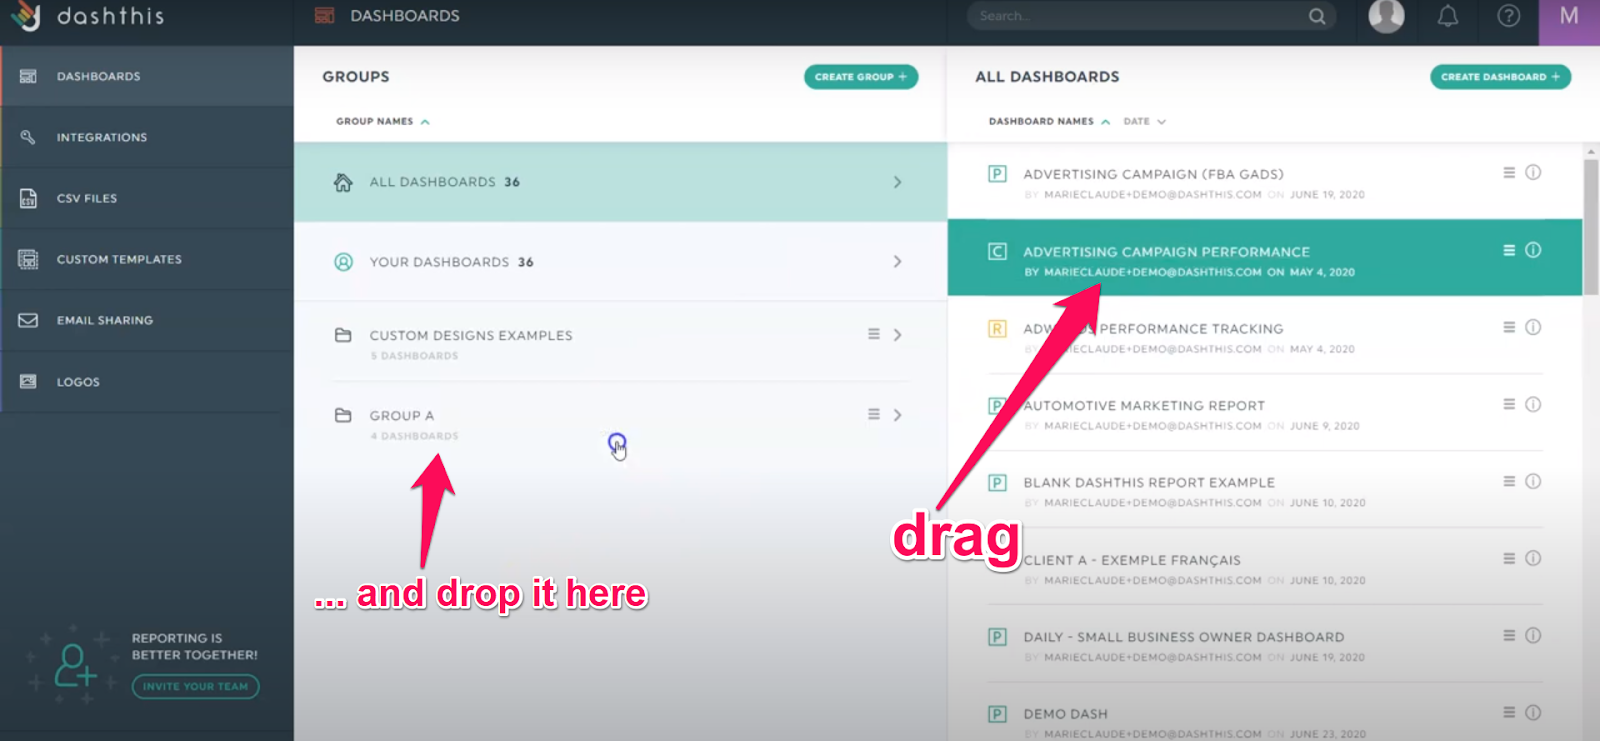
Maybe your client has two different marketing teams, one for email marketing, another for PPC ads. Or maybe your client has multiple types of reports. If that’s the case, create different groups and drag and drop the relevant dashboards.
Copy the URL link and share the entire content in the group with the right members. They can access all the dashboards included.
What Should be Included in a Social Media Report?
Earlier on, we talked about the qualities of an effective social media report. But there’s a lot to unpack on how they actually look like. Here’s a deeper look at what you should include.
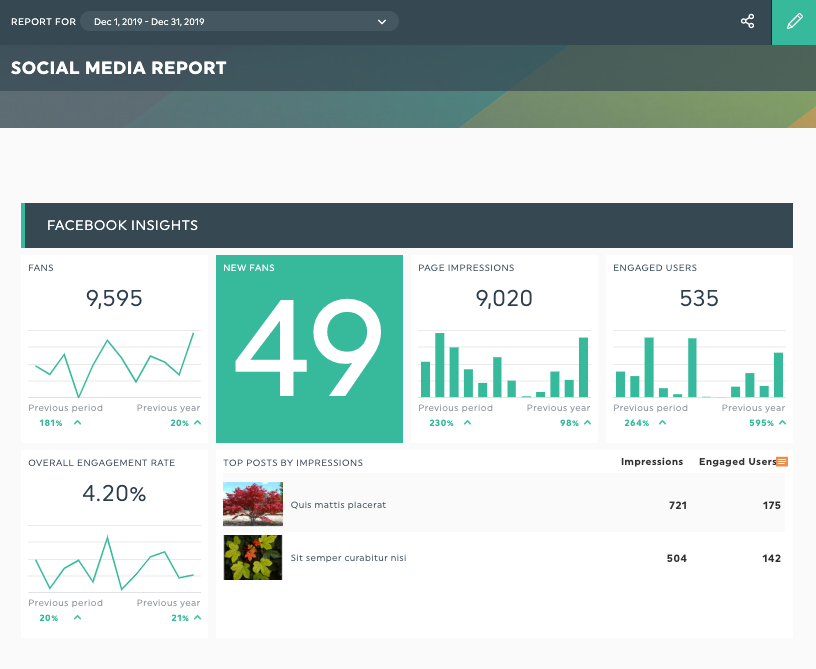
1- Important Metrics
If the layout is the appetizer, then social media analytics is the main dish.
The KPIs are the most critical part of the report, as it shows whether your social media marketing strategy is working.
Here are ten examples of social media metrics ranging from brand awareness to follower engagement and influencer marketing data:
- Comments
- Post likes
- Page likes
- Shares or retweets
- Post engagement rate
- Click-through rate
- Number of followers
- New followers
- Page view
- Top performing posts
- hashtags
- demographics data
- Industry benchmarks
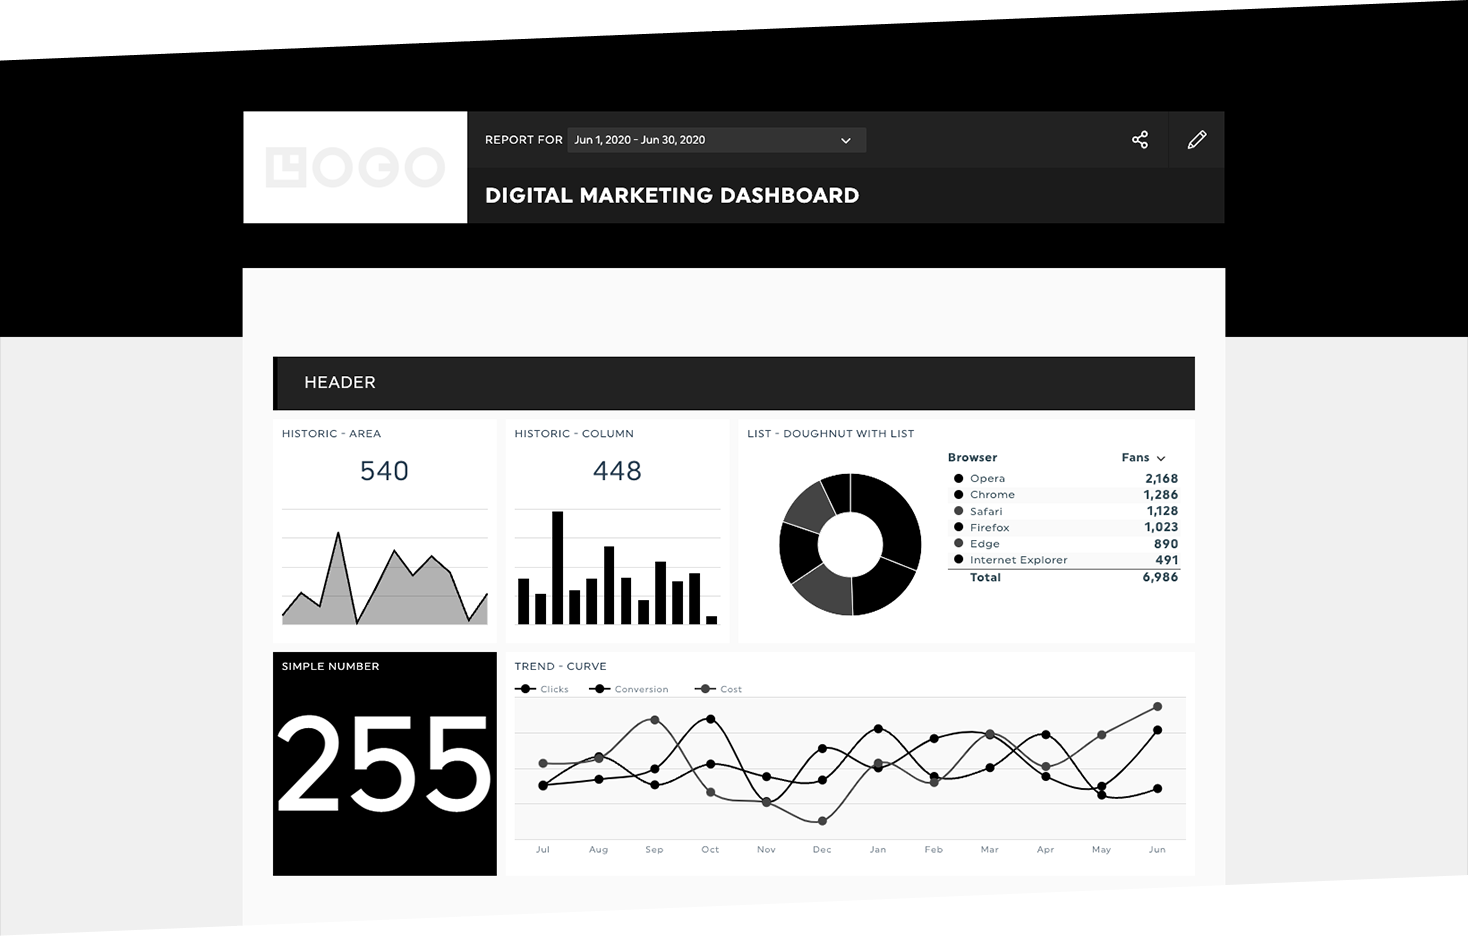
2- Graphs, Charts, and Sections
Images help clients visualize the data points in their social media marketing reports. (Trust us, add them in. Your client will thank you for it.)
Colourful graphs help stakeholders—from marketers to clients—digest and understand an entire social media strategy at a single glance
3- Comments
This feature prevents endless back and forth of messaging.
Here’s what we recommend: Add comments and notes in your dashboard to explain the social media performance to clients (think of them as a social media executive summary).
You can even add your most successful Instagram analytics social posts to reinforce clients of the great work you do.
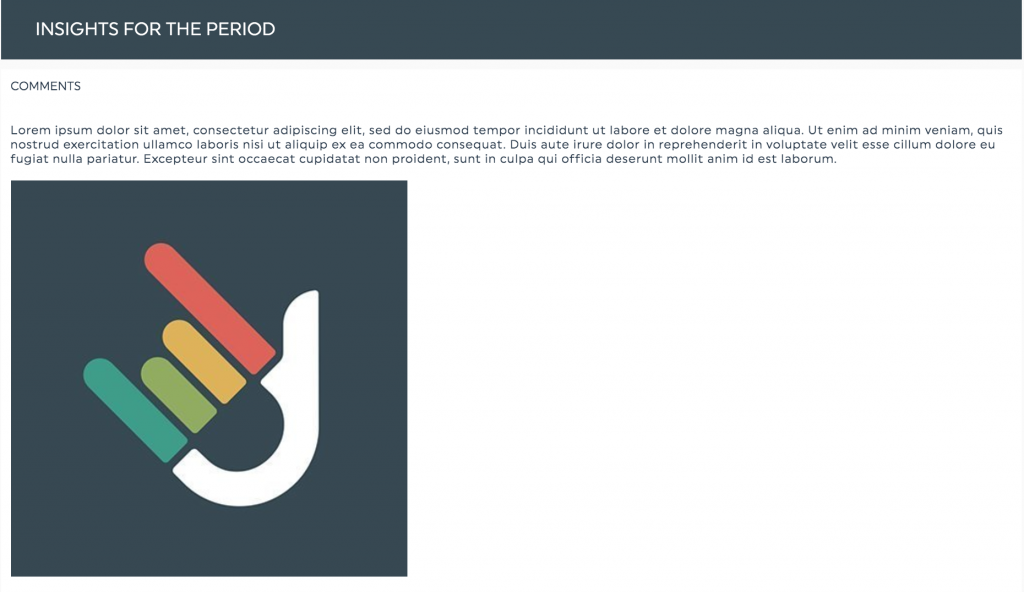
Select Static Widgets > Comments to add images or an executive summary. And don’t worry, there’s no limit! You have the option to expand the widget to the right size.
Adding notes in the report itself will save you the extra step of recording videos or emailing clients.
Wrapping Up: How Do You Analyze Social Media?
A social media report does more than listing data.
At its core, it tracks and measures important metrics, so you can analyze which posts and campaigns are working. You’ll know how to adjust your strategies accordingly (without ever wondering, “Gosh, I hope this works out.”), allocate the right budget, and double down to optimize your social media performance. For an agency as well as for any social media manager, that makes a whole lot of a difference in your overall performance.
More importantly, it educates clients on the ROI of your digital marketing efforts and proves to them the priceless value you bring to the table.
Grab your free template here and customize it with your data
Curious to explore our all-in-one marketing reporting tool? Sign up for your FREE DashThis 15-day trial today.
DashThis is more than a social media reporting tool. If you want an easier way to analyze your metrics—SEO, PPC ads, Google Analytics, or whatnot—so you have a clear overview of your target audience’s entire journey, try our tool today.
You only need to create your report once. Choose a template, select your favorite KPIs (instead of manually adding them), and save it for future use.
Whether it’s optimizing the time you spend on social media management in your agency or gathering results from a content strategy in the long or short-term, you can create one report that includes them ALL, with DashThis.

Get the perfect social media report in seconds!
Read More

Don’t miss out!
Follow us on social media to stay tuned!
Automate your reports!
Bring all your marketing data into one automated report.
Try dashthis for free