5+ social media analytics tools & reports [complete guide]

You’ve got dozens of social media campaigns going on, and you need to track them fast.
Frustrating, isn’t it? We’re willing to bet that pulling in these different metrics from multiple channels and organizing them in a single report is one of your least favorite things at your agency.
Now, what if we told you there’s an easier way to track these complex data in one automated monthly report?
Keep reading, and we’ll show you how to do it in a few quick clicks. In this guide, you’ll also discover five popular types of social media analytics tools, learn when it’s best to use them, and grab your free template.
- What is Social Media Analytics?
- Social Media Analytics Report Template
- What Social Media Analytics Tools Should You Use?
- Facebook Insights
- Instagram Insights
- Twitter Analytics
- LinkedIn Analytics
- YouTube Analytics
- How to Get Social Media Analytics With Your Own Data?
What is Social Media Analytics?
Social media analytics is the practice of tracking and analyzing data from social networks such as Facebook, Twitter, and Instagram.
The key metrics you choose to focus on will depend on your goal. For example, if it’s brand awareness, prioritize impressions and reach. Whereas for engagement, look at KPIs such as likes, shares, and comments.
As social media marketers, it’s important—nay, vital—to track these data points daily.
Social analytics indicate whether you’re heading in the right direction in your social media strategy. You’ll know which specific social media campaigns are performing, and how it fits in a marketing strategy.
With these social media metrics at your fingertips, you can even:
- Identify the best social media channels for customer acquisition, conversions, and content marketing
- Pinpoint the demographics of your target audience (Tip: This is valuable when updating buyer personas!)
- Improve your customer experience (CX)—according to Hootsuite, 74% of executives in sales, marketing, and customer care departments use social media to improve CX
Following that, you can adjust your time and budget accordingly, optimize your overall social media performance, and drive better business decisions to boost your bottom line.
Social Media Analytics Report Template
Gathering analytics across multiple social media platforms is a colossal time suck. It’s already a messy task for one client. Imagine how it looks when you’re juggling dozens of clients all at once!
Our advice is to use a social media reporting tool to pull all your social analytics data. That way, there’s no longer a need to copy-paste two different Facebook Insights reports, a few graphs from LinkedIn, and screenshots of your Instagram posts for each client.
Data visualization reports enable you to easily understand all your data, from Instagram marketing to brand mentions. Automate your social media reports and see at a glance your social media marketing efforts, post engagement, page views, new followers, and much more.
Here’s how to do it:
- Choose your preferred integrations
- Select a social media report template (all DashThis templates come with pre-built KPIs; you don’t need to add them one at a time manually)
Grab this social media analytics reports template
It’s a beauty, isn’t it?
Here's how to create your social media analytics report using our social media template:
What Social Media Analytics Tools Should You Use?
Here's a list of the best social media analytics tools you should use for your marketing campaigns. These are free social media tools anyone can use to track their social media efforts.
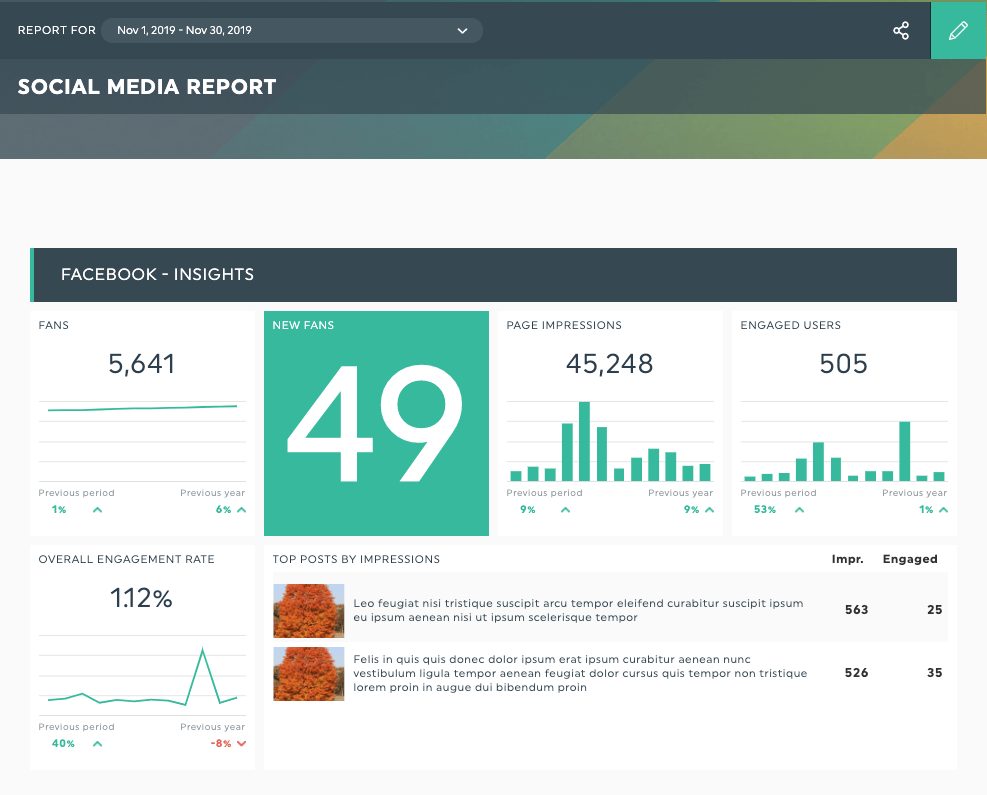
1. Facebook Insights
Source: Facebook
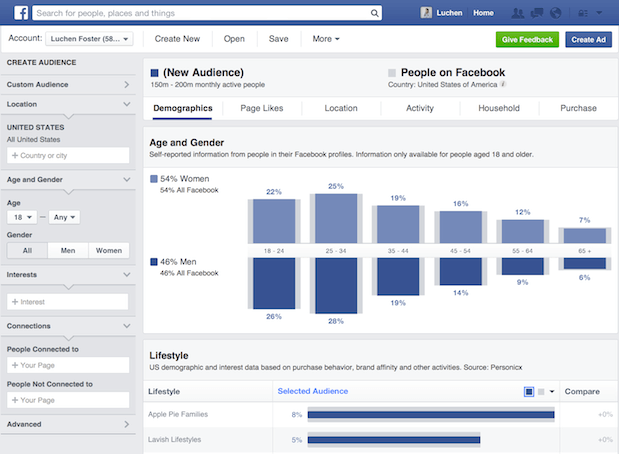
How it works: Facebook Insights gives you information about Facebook users (including users connected to your Facebook Page). Audience demographics range from education level to job title and age and gender.
Why use it: With its wealth of data, Facebook Insights is helpful if you do top-of-funnel (acquisition) and bottom-of-funnel (sales) marketing. For example, if you have a B2C ecommerce client, you might look at location and language to craft timely and relevant social media posts.
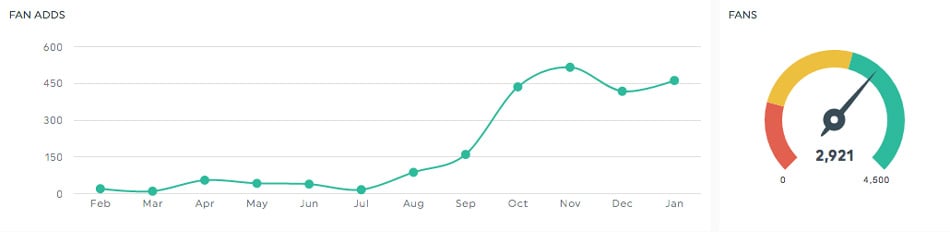
Common KPIs: Page likes, average comments per post, page engaged users, post likes, and page engagement rate, top performing posts.
The Social Shepherd, a social media marketing agency based in England, often measures gender and age and active users by hour. For the latter metric, the team measures it to identify when the audience is most likely online, so that they can schedule posts at the best time.
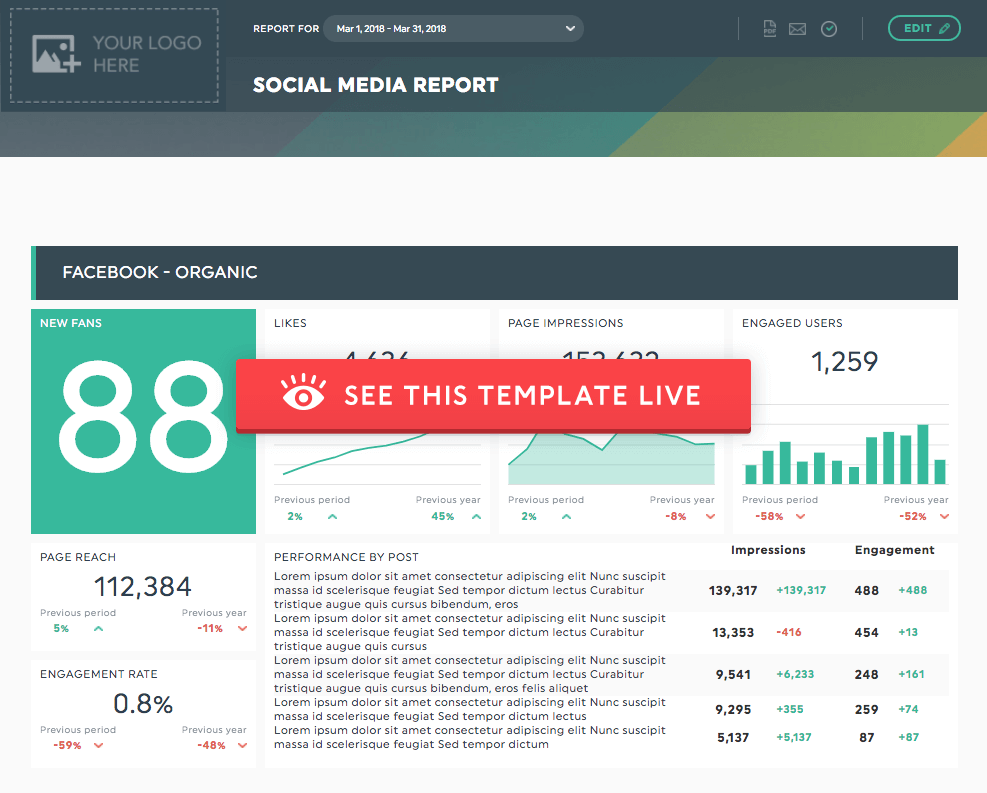
Here’s how to create a Facebook Insights report:
- Choose the Facebook Insights integration
- Select the Facebook Insights report template (with pre-filled popular KPIs like post reach and engagement, and more)
Grab this Facebook Insights report template
2. Instagram Insights
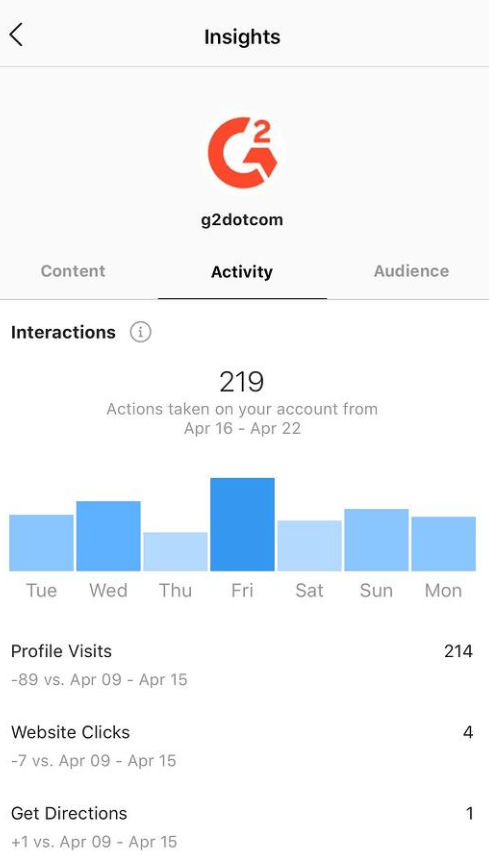
Source: G2
How it works: Instagram analytics tells you everything you need to know about your audience (e.g., overall trends across followers, campaign performance, social media data revolving around stories and IGTV videos).
Why use it: Instagram is a powerful platform for fashion stores (55% of fashion shoppers bought a product based on an Instagram creator’s post). If you run an influencer marketing agency and often work with clients in the fashion industry, get on it. These analytics will give you priceless information to maximize your budget and ROI.
Common KPIs: Comments count, engagement rate, followers count, likes, and post counts
Jessica Farkouh, a digital marketing specialist at VitalUP Marketing, recommends focusing on data for the last 30 days instead of seven days. She says, “The smaller the time frame, the easier it is for the analytics to differ, which creates a false sense of change.”
Here’s how to create an Instagram Insights report:
- Select the Instagram integration
- Click the Instagram Insights report template (with pre-set KPIs like top hashtags by engagement, post likes, and more)
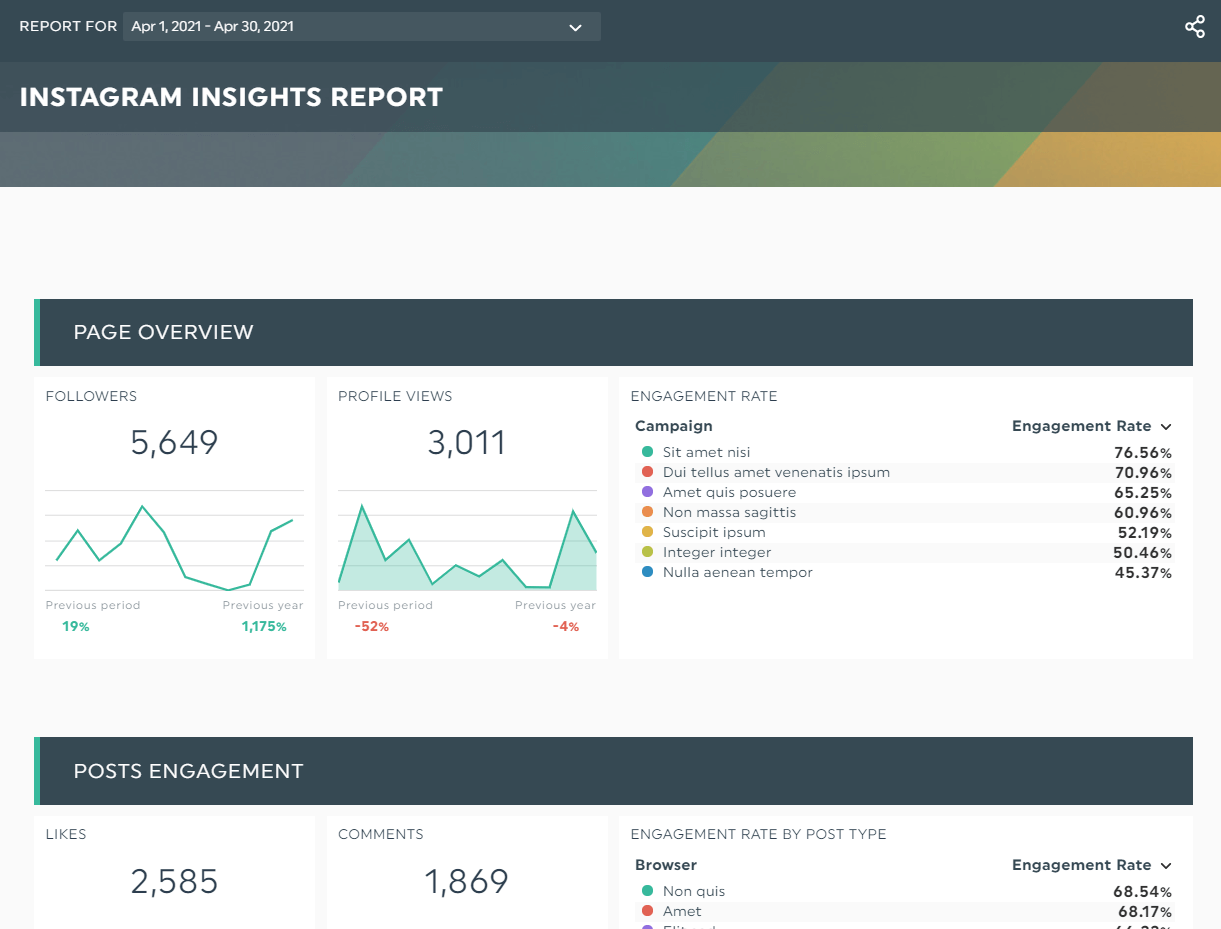
Grab this Instagram Insights report template
3. Twitter Analytics
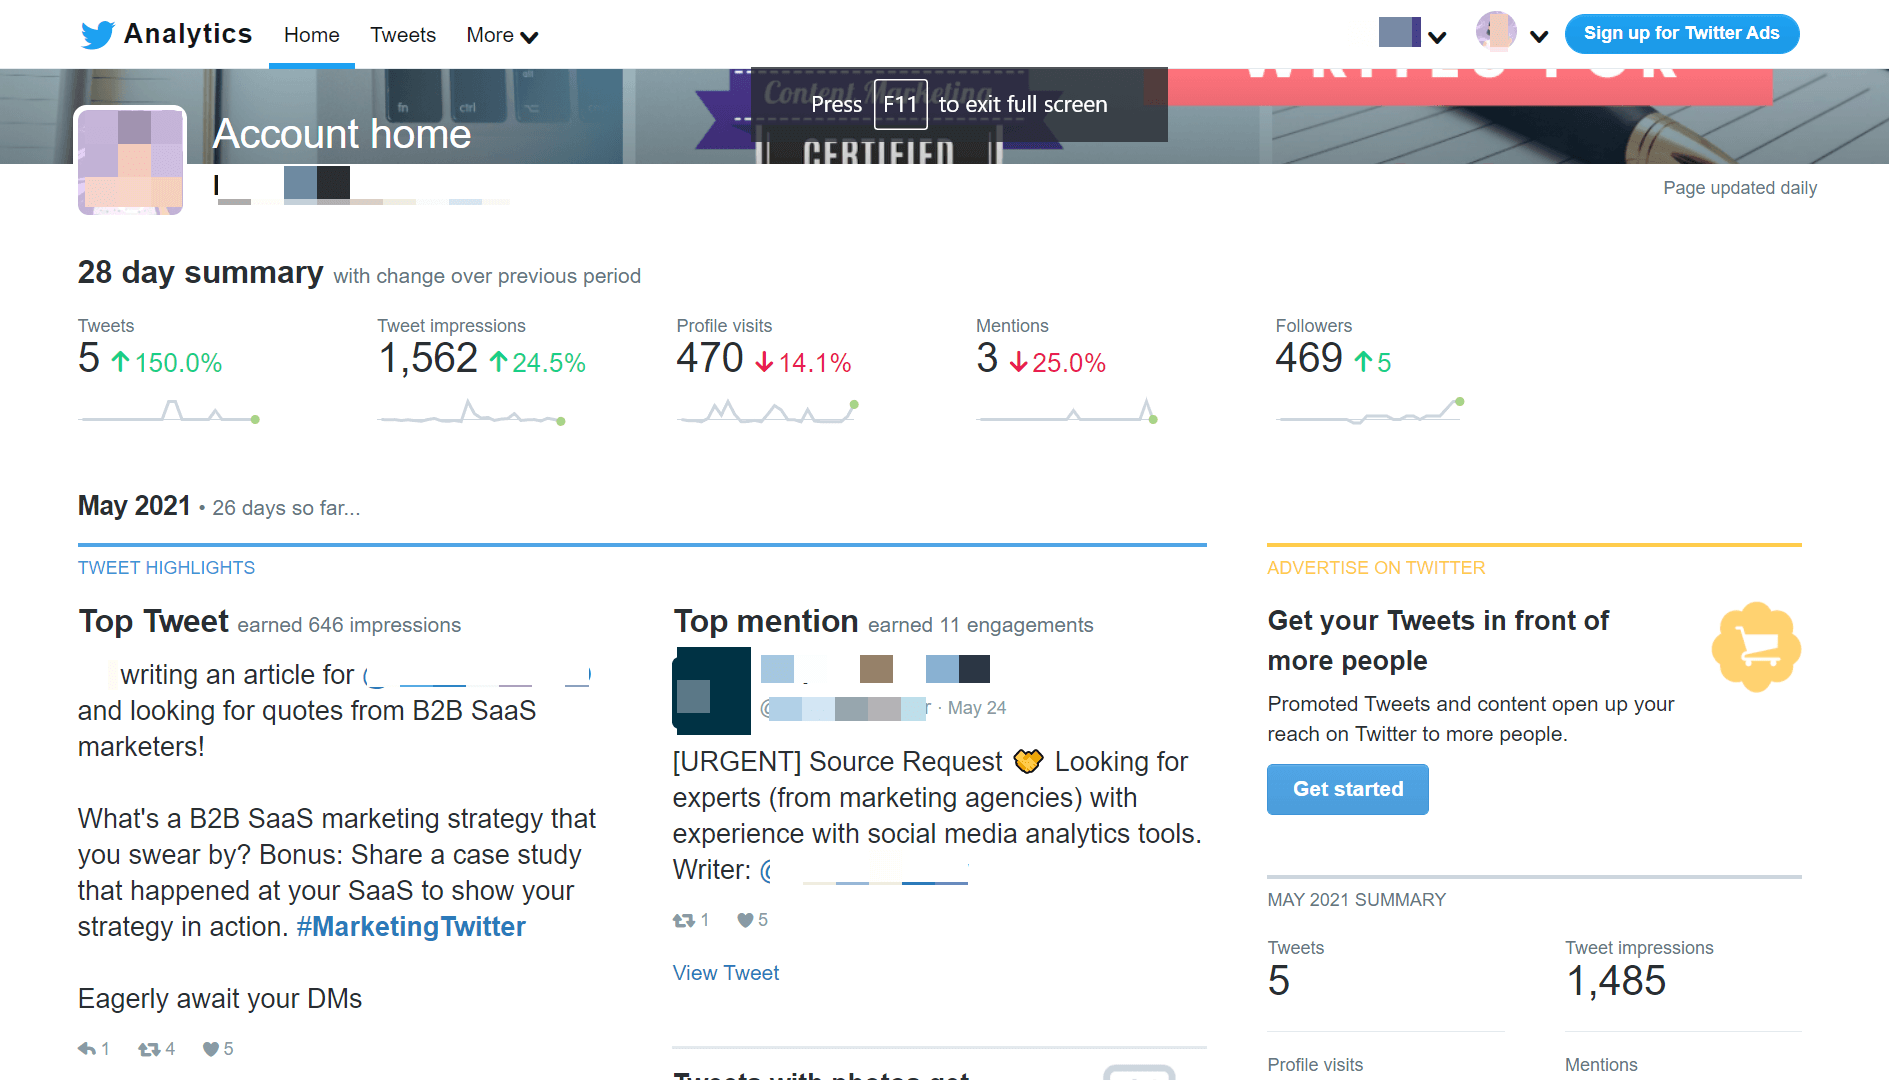
How it works: Twitter Analytics displays tons of valuable audience insights. From your most successful tweets to the top influencers in your network, it’s the platform to be at if you want to learn how your audience is responding to your content.
Why use it: Twitter is an effective content distribution channel—so much so that 82% of B2B content marketers use it to promote their content organically. Arm yourself with these analytics and help your B2B clients build greater awareness within their niche industries.
Common KPIs: Follower engagement rate, followers count, mentions count, retweet count, and post
At VitalUP Marketing, Jessica Farkouh tracks the percentage change of the followers and the type of posts that have the biggest reactions. She says, “The higher the engagement, the more reach, and the greater reach you have, the larger your market becomes.”
4. LinkedIn Analytics
Source: LinkedIn
How it works: LinkedIn Analytics helps you understand the professional traits of your users (e.g., seniority, job title) and the types of content they interact with the most.
Why use it: LinkedIn is the most used social media platform in the B2B space. If you want to identify content that’s driving high engagement or conduct competitive analysis (Tip: Identify these competing companies based on other pages your audience follows), LinkedIn Analytics is it.
Common KPIs: Comments count, engagement rate, follower engagement rate, social interactions, and followers count
Here’s how to create a LinkedIn Analytics report:
- Select the LinkedIn Pages integration
- Click the LinkedIn Business report template (including common KPIs like top posts by engagement rate, and more)
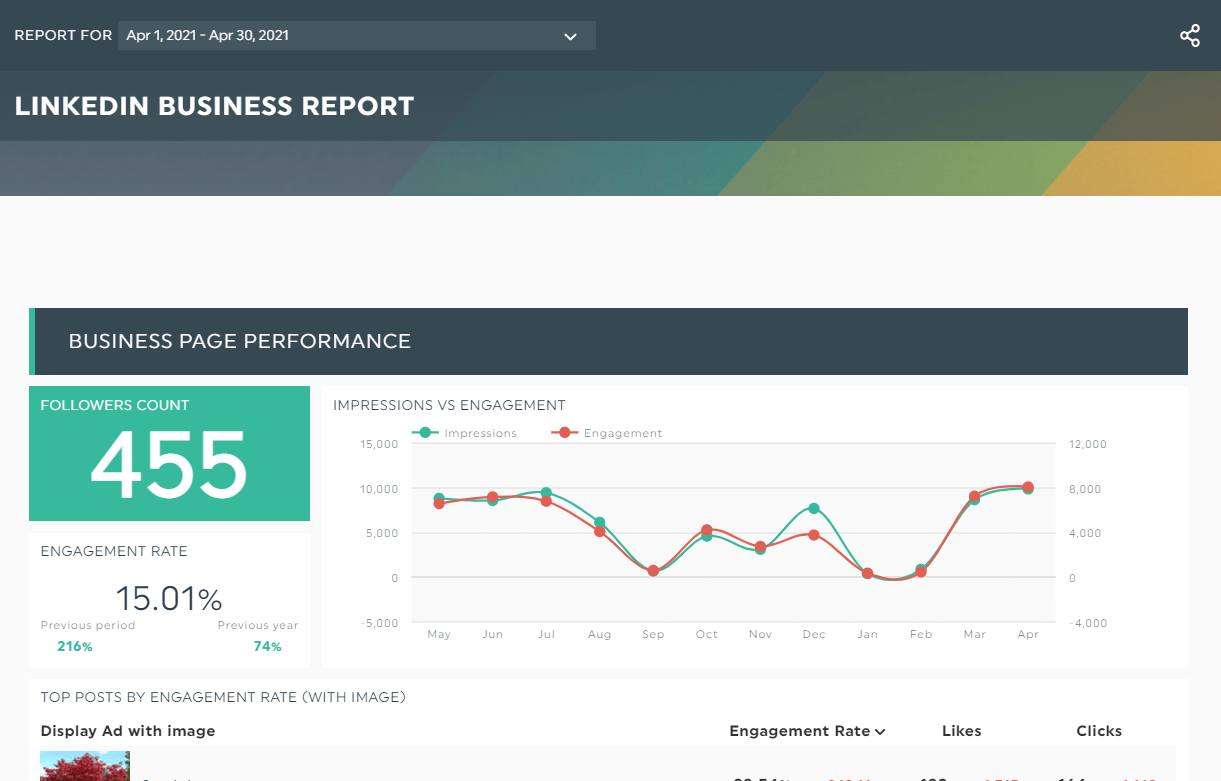
Grab the LinkedIn Business report template
5. YouTube Analytics
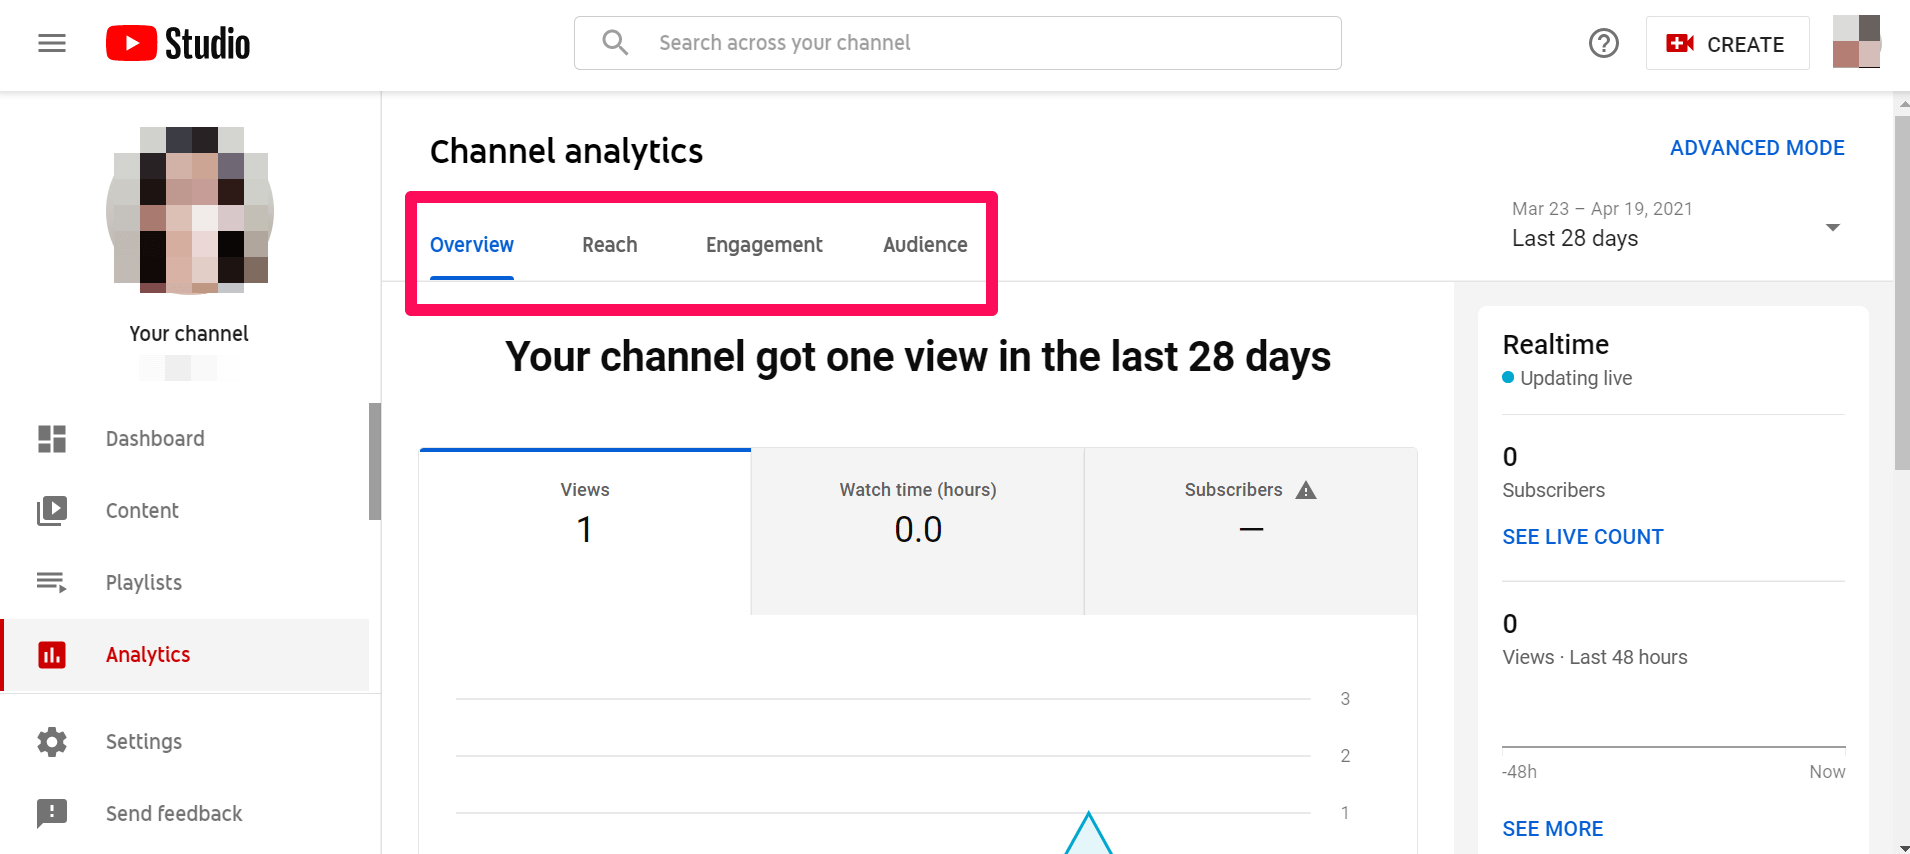
How it works: YouTube Analytics provides real-time metrics of your videos and subscriber count. Pro Tip: Look for Reach > Traffic source types. This tells you how viewers found your videos within YouTube and external sources—use these insights to refine your strategy and drive more traffic!
Why use it: You need this in your analytics stack if videos play an enormous role in marketing. More importantly, since YouTube is no longer connected to Google Analytics, you’re going to need to master it fast.
Common KPIs: Average view duration in seconds, comments count, fans, likes, and subscribers gained.
Here’s how to create a YouTube Analytics report:
- Select the YouTube integration
- Click the YouTube report template (including common metrics like top videos ranked by views, impressions CTR, and more)
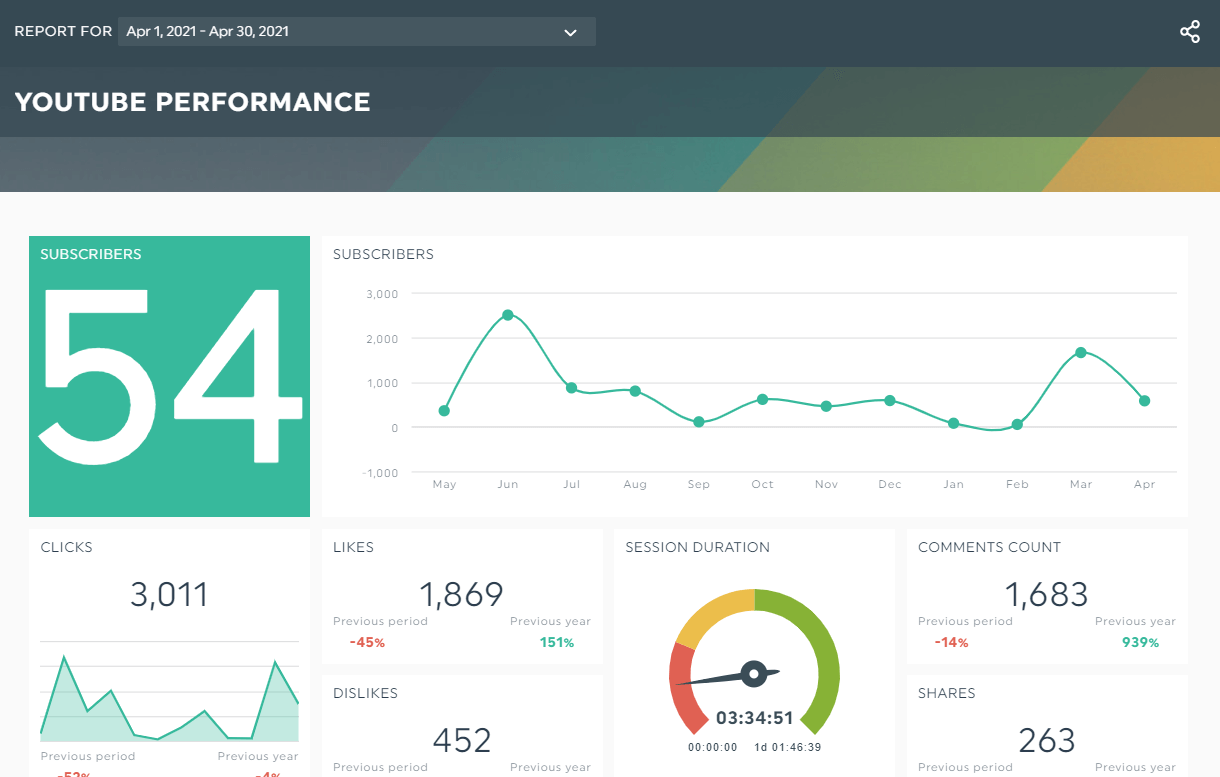
Grab the YouTube performance report template
Choose the right tool for your needs
These are mostly the free analytics platforms from your social analytics tools and social media accounts. It's very easy to use these tools to gather historical data without breaking the bank. However, it takes some time, so it's best to use an automated social media report to then gather all this data into one custom report.
Or course, there is also a lot of other types of social media management platforms and tools for social listening, follower growth, social media monitoring, competitor analysis, and brand monitoring.
Tools such as:
- HopperHQ
- Sprout social,
- Canva
- Brandwatch,
- Hootsuite
- Keyhole,
- Socialbakers,
- Agorapulse,
- Brand24,
- Iconosquare,
- Quintly.
They all have their own functionalities and pricing, so make sure you do a little shopping before settling on one.
Here's a video with information on some of them:
How to Get Social Media Analytics With Your Own Data?
Social media management doesn't need to be frustrating. A fuss-free way to excel at tracking these complex data is to use an automated template.
DashThis is a reporting tool that gathers your social media content and data across multiple platforms in a clear, concise report. With our time-saving dashboards—all templates come with pre-set KPIs, so you don’t need to add them manually—you can create your reports in the blink of an eye.
These templates are highly customizable and convenient for daily, weekly, monthly, and quarterly use. Add notes for report benchmarking, display Instagram images directly within the reports (no more copy-paste!), or customize it with your client’s brand colors—DashThis can do it all.
Sign up for your 15-day FREE trial and see it for yourself.
You’ll see how easy it is to create your social media analytics report only once and save it for future use. Use it together with any of the social media management tool above and save more time for your marketing teams.
It’ll make social media analysis a breeze.
If you're looking for a social media analytics tool, Dashthis is easy, fast, customizable and your data is fetched in every day so you'll never be left in the dark.

Track all your social media data automatically in one report.
Read More

Don’t miss out!
Follow us on social media to stay tuned!
Automate your reports!
Bring all your marketing data into one automated report.
Try dashthis for free