The Ultimate Guide to Social Media Reporting in 2025

In 2025, navigating social media reporting is a critical but complex part of a marketer's playbook. With the latest stats suggesting that the average person spends over 2.5 hours on social platforms daily, the opportunity for brand engagement is immense. Picture this: billions of people like, comment on, and share stuff online every day, and all that activity is a treasure trove of information for understanding how well your social media efforts are paying off.
The tricky part is finding those standout takeaways that tell you if you're smashing your social media goals. It's no longer sufficient to count likes and follows; the emphasis has shifted toward understanding user sentiment, content virality, and conversion metrics.
The endgame is finding those standout takeaways that tell you if you're smashing your social media goals and leveraging them into a social media strategy designed to deliver measurable results.
In this guide to reporting on social media, you’ll learn:
- What a social media report is
- Why social media reporting is important
- What makes an effective social media marketing report (PLUS how to create it with a few clicks)
- Pros and cons of daily, weekly, monthly, and annual reporting (and which you should focus on)
- How to automate it in seconds
What is a Social Media Report?
Simply put, a social media analytics report shows the performance of your social media channels, helping you make informed decisions.
The design can vary. The report can be an Excel spreadsheet containing many data points or an attractive automated report (yes, it’s possible).
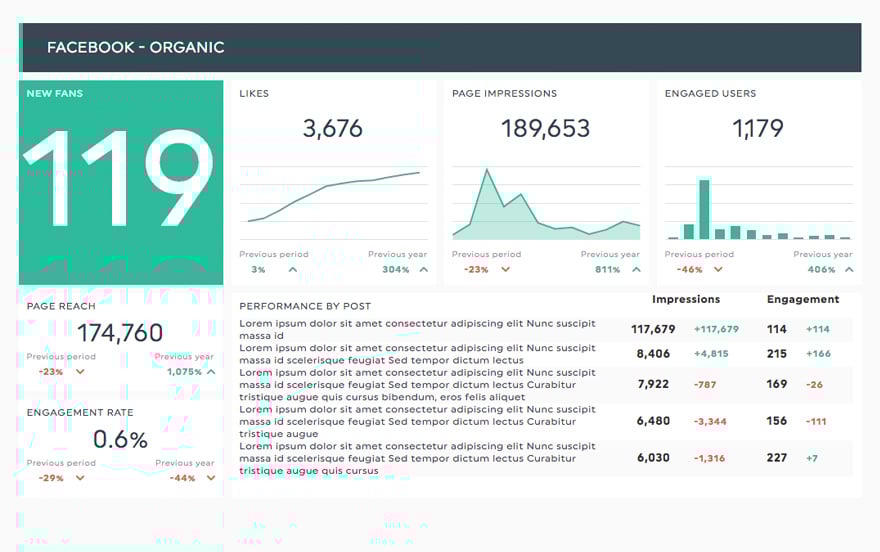
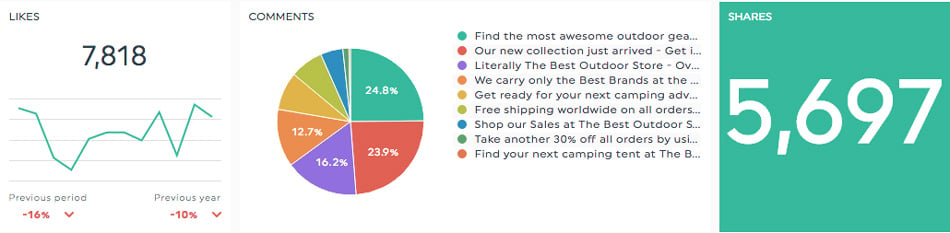
Connect your Facebook Insights account, and let DashThis pull relevant data. Automate your reporting and turn your messy data into a sleek, beautiful report.
Grab your Facebook Insights dashboard
The content of your social media campaign report will depend on how in-depth you want to get.
At the very least, a standard social media performance report will include KPIs such as audience demographics, impressions, conversion metrics, and follower count.
Why Social Media Reporting is Important
Creating content for social media marketing campaigns is pointless if you’re not tracking your performance.
Imagine spending the past three months on your client’s LinkedIn Page when none of the posts generated traffic and quality leads. Unbeknownst to you, the YouTube videos that you created sporadically were the ones attracting your best customers.
This all-too-real scenario paints a vital reminder: Always invest time to analyze results for your social media strategy.
So, you’ll know what’s working (or not) and tweak your marketing efforts and decision-making accordingly.
What Should be Included in a Social Media Report
1. All Your Key Performance Indicators From All Your Platforms
Ah, the main stars of the social media report.
The social media KPIs will tell clients two main things: a) how their social networks have performed and b) what their next steps should be.
In other words, these social media metrics will support your suggestions as you implement the strategy (more about this in the next section).
If you’re running Facebook Insights, focus on these KPIs: Page views, total actions on the page, total reactions on the page, page engagement rate, page impressions, page organic impressions, and page paid impressions.
Side note: Some key metrics, like click-through rates (CTRs), costs, etc., are better suited to the PPC campaign performance report.
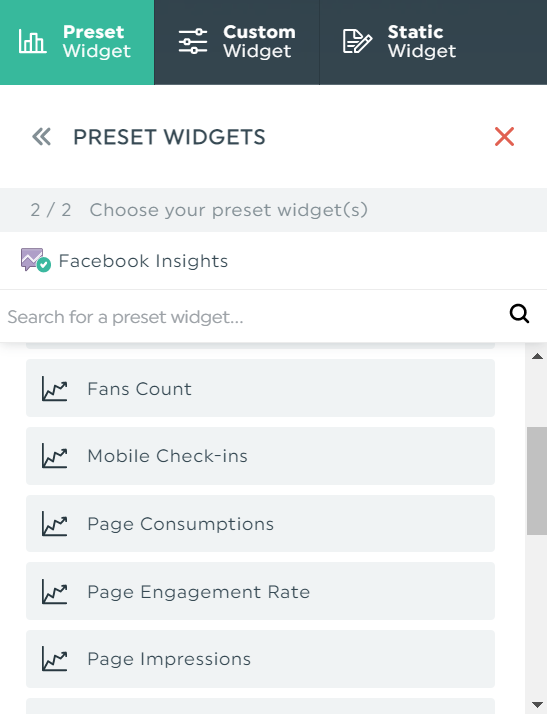
Either scroll through the preset KPIs or enter them in the search field. Once you click it, DashThis will automatically add it to the report.
For Instagram Insights, you’ll want to monitor important metrics and KPIs centered around brand awareness: follower growth, profile views, share of voice, engagement reviews, likes, comments, and top-performing posts by engagement rate.
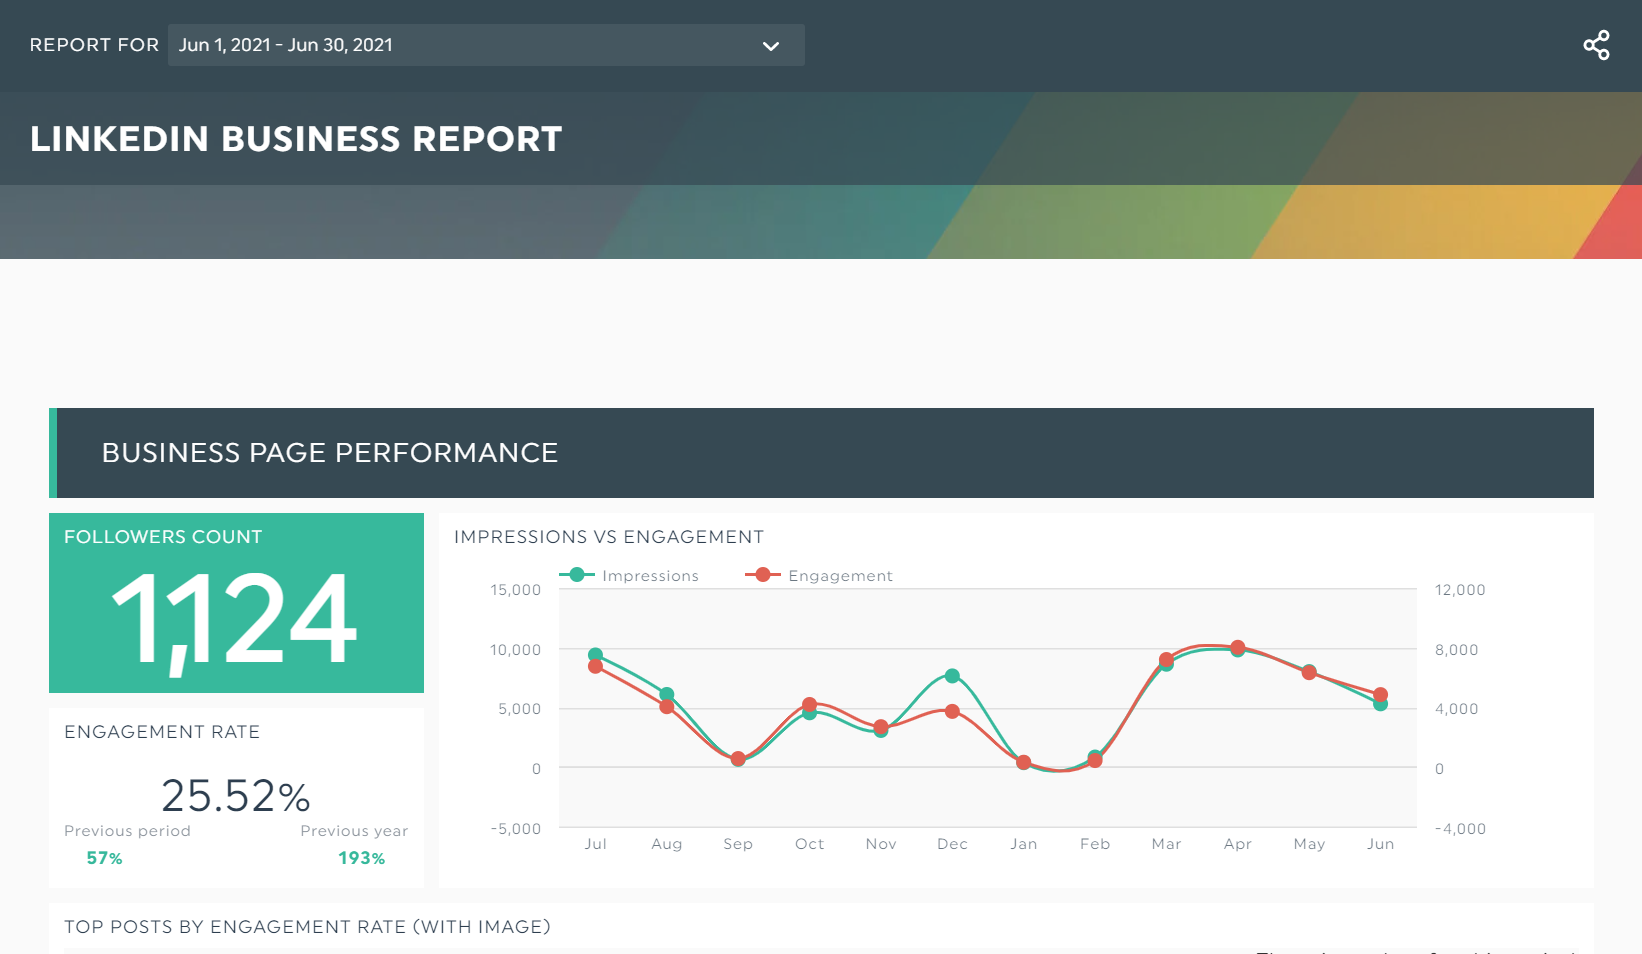
B2B clients who want an optimized LinkedIn page should monitor the number of followers, impressions, and clicks on the page, post actions over time, post likes, comments count, shares, and social interactions.
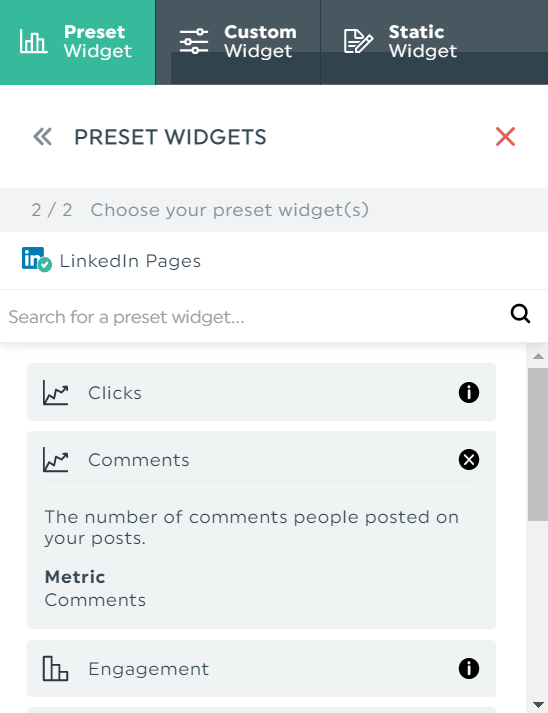
Click any of the preset LinkedIn KPIs, and DashThis will automatically grab the relevant data for your report. Pro Tip: If you need a refresher on KPIs, click the “i” icon.
2. Executive Summary
Set your marketing reporting on the right foot— display an executive summary at the top of your social media report:
- Click Static Widgets
- Select Comments
- Enter your executive summary
Use this space to add commentary on this report’s specific timeframe. You can, for example, write the type of content that worked better this month or add some benchmarks and goals.
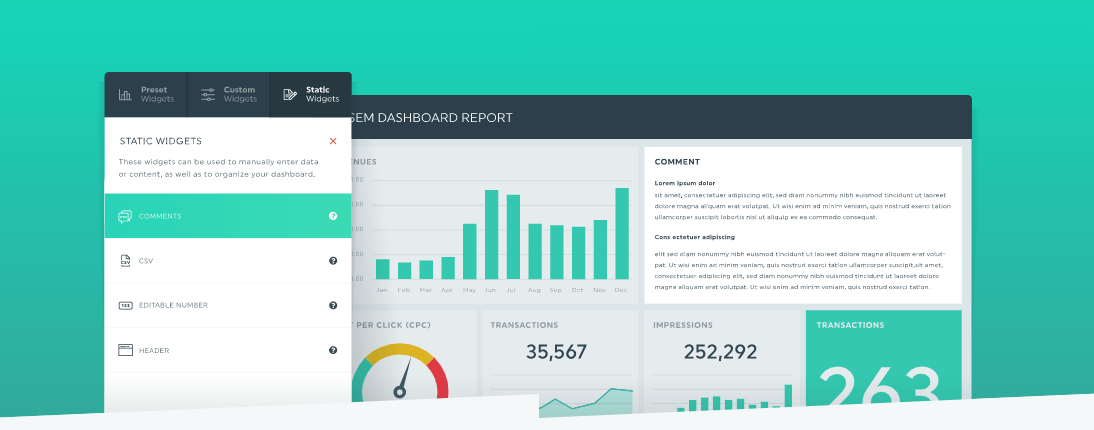
The DashThis comment box editor allows you to do pretty much anything.
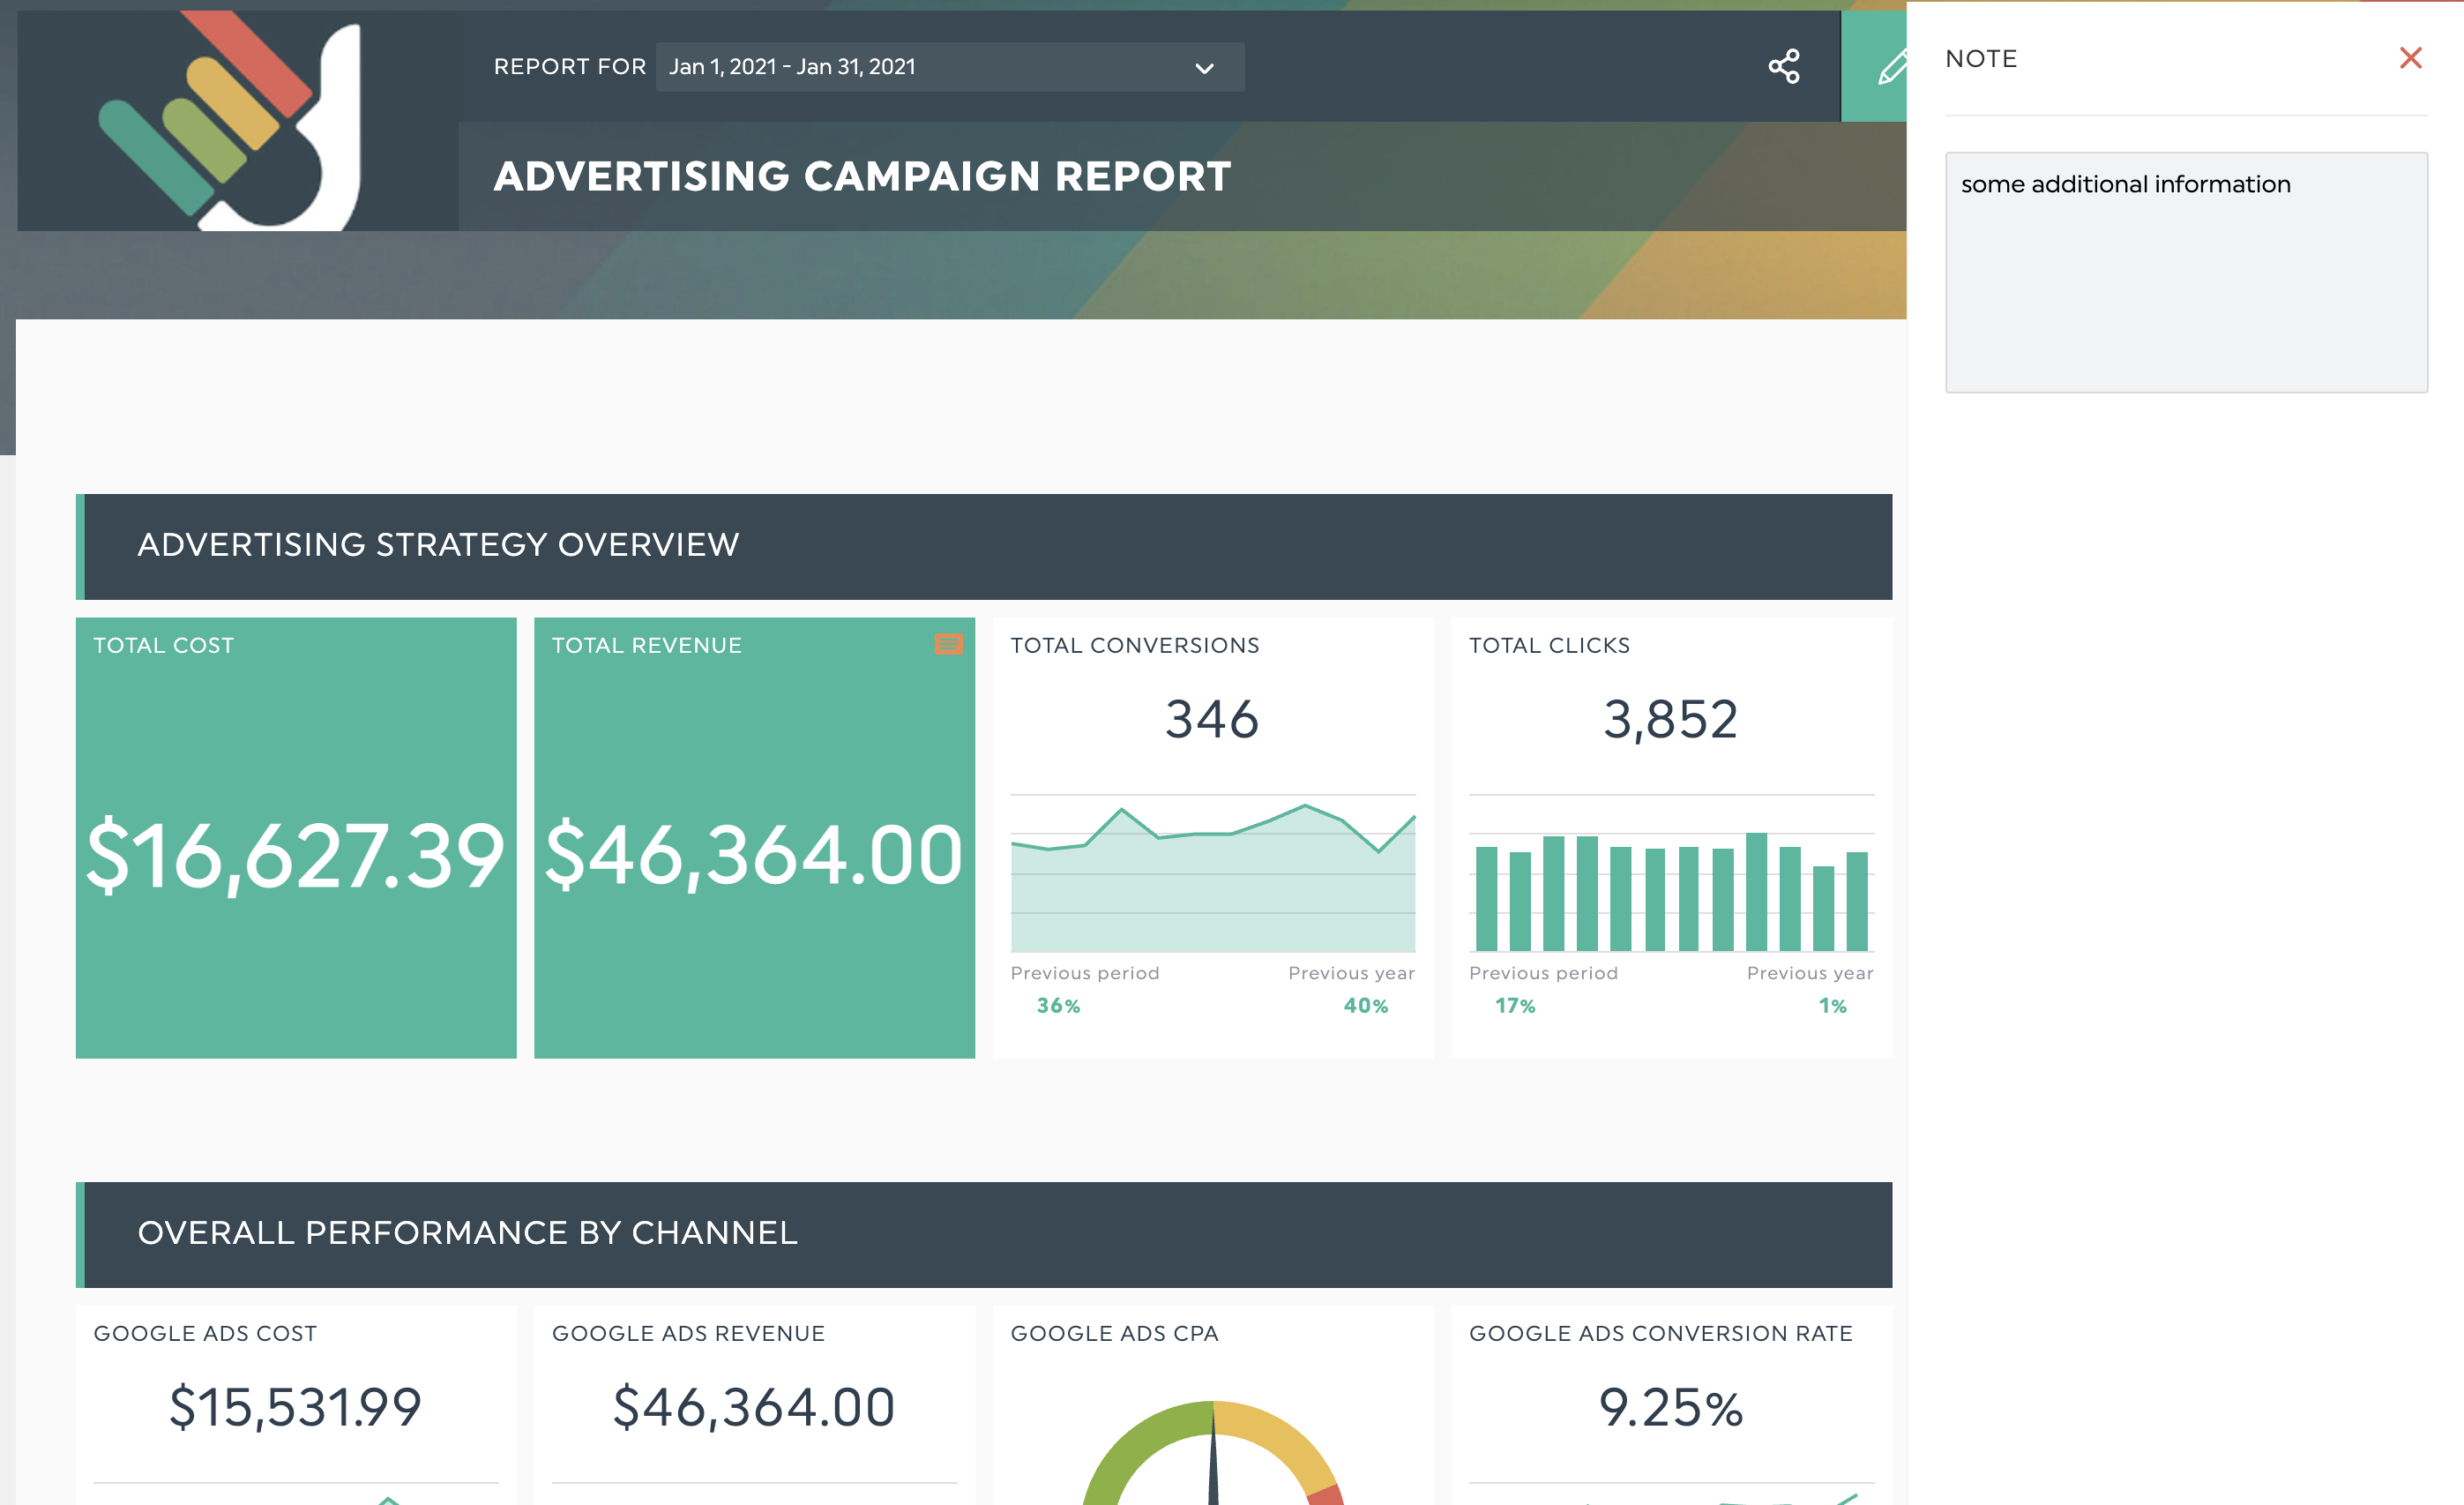
3. Comments and Notes
Effective reports go beyond standard social media analytics. Smart, data-driven social media marketers will offer suggestions for improvements.
Locate your desired KPIs and complete the following steps:
- Click Add Note
- Enter your recommendations
- Click Save
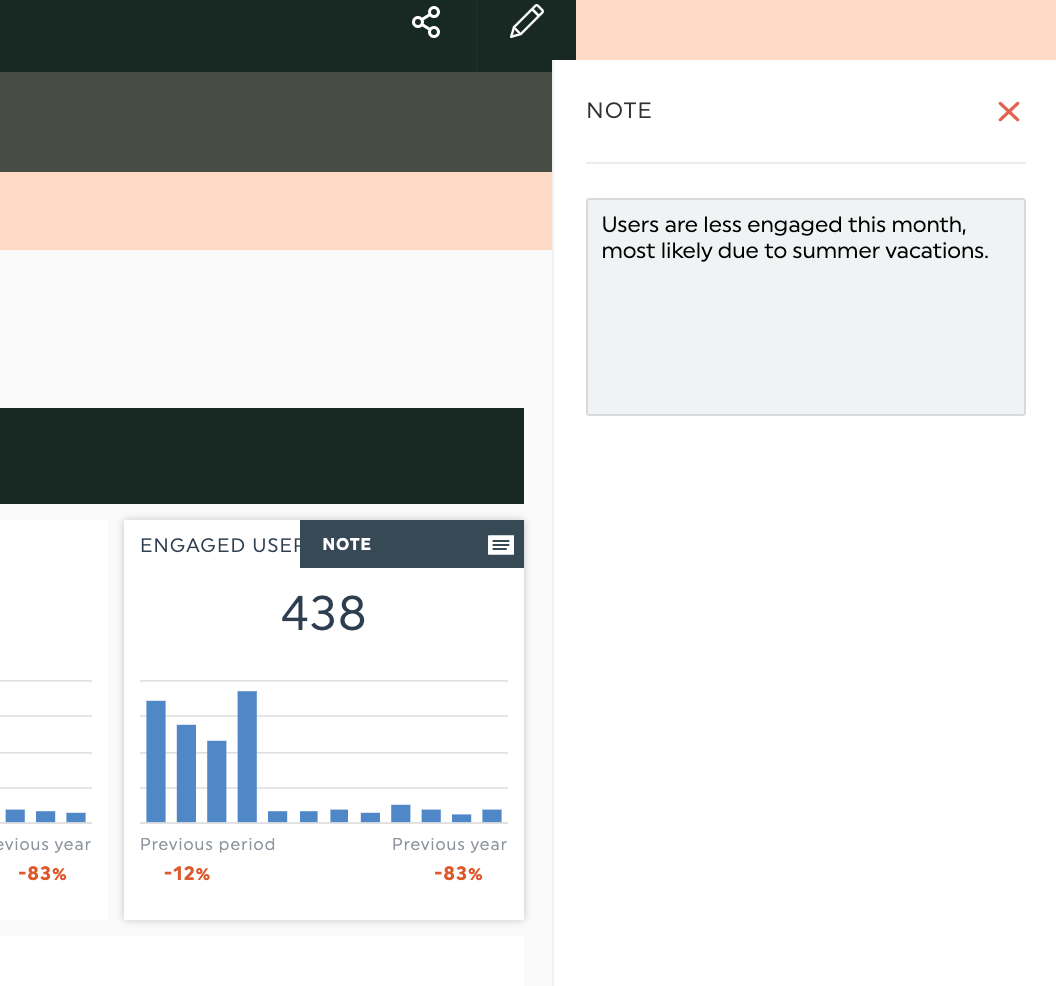
Share your actionable insights within the report instead of explaining them in your email. When clients view the report live, these value-packed notes will become visible.
Use this opportunity to prove to your clients that they’ll get massive ROI from working with you.
You don’t just want to be a typical agency they hire. You want them to think of you as a partner and asset.
Pro Tip: You can also leverage the Notes section for proofing. Send a draft of your report to the marketing team, social media team, or other stakeholders.
How Should You Create a Social Media Report
Gone are the days when you logged in to Facebook, took a screenshot of the analytics, pasted it in the spreadsheet, and repeated steps 1-3 for Instagram, TikTok, and Linkedin.
For each client, you can easily spend 30 minutes weekly on these social media platforms! How much does that add up, say, in a month? Your time is better spent on more productive tasks.
Instead of manually grabbing a multitude of data, automate your social media agency reporting on a single platform:
- Integrate your social media reporting tools with DashThis
- Choose your dashboard—either create from scratch or pick a premade social media report template
- Locate your KPIs under Preset Widgets
- Drag and drop the KPIs
Scroll through the built-in KPIs under Preset Widgets, click to add them, and drag and drop them anywhere you see fit in the social media report.
All social media marketing dashboards include popular KPIs, saving you the extra steps of jumping from one platform to another.
How Often Should You Create a Social Media Report
There’s no one-size-fits-all answer. Here’s a good rule of thumb by Christine Elizabeth Cooper, VP of marketing and sales at KNB Communications:
“You must strike a balance between the time it takes to compile a report and the value it provides. Additionally, different roles within the company should be looking at different levels of reports, at different intervals.”
1. Daily Social Media Reports
Pros: You can easily monitor brand mentions and conversations. Tip: Use social listening tools (e.g., Hootsuite, Socialbakers) for this.
Kristaps Brencans, CMO of On The Map, shares another excellent reason for creating daily reports:
“If there ever was a viral post with a large engagement boost, clients can see that reflected in real time because of how closely the reports are presented.”
Cons: Lack of target audience growth and content strategy insights on social media.
2. Weekly Social Media Reports
Pros: View valuable insights on new and trending topics. Weekly reports provide more context than daily reports.
Cons: Unable to measure the effectiveness of a campaign.
3. Monthly Social Media Reports
Pros: Assess data on how social media accounts have grown, impressions generated, links clicked, and conversions tracked.
Holly Medwid, CEO at Monarch Social Media, votes for monthly reports, explaining:
“Your digital marketing campaigns give you a better understanding of awareness, engagement, and conversion rates. This shows true social media ROI for clients.”
Cons: Time-consuming. Medwid explains, “There’s usually a large educational component because you’re measuring data points that most clients don’t understand.”
Pro Tip: To overcome this issue, use the DashThis Notes feature. Explain your process in detail within the report—it’ll save you time from writing another email to your client.
4. Annual Social Media Reports
Pros: Evaluate year-over-year comparisons and overall marketing strategy and create a yearly budget.
Cons: Unable to clearly understand best-performing social media content sustainably.
So, which reports should you focus on? Short answer: You should create all of them.
Kristaps Brencans shares the best social media reporting advice:
“Consistent monthly or quarterly reports with detailed social media metrics allow clients to see your marketing strategies at work. The main benefit is long-term client retention. When businesses see their clicks and new followers increasing monthly, they're more willing to invest in your agency.”
Creating daily, weekly, monthly, and annual reports on DashThis is easy. Under Dashboard Preferences, click Time Period.
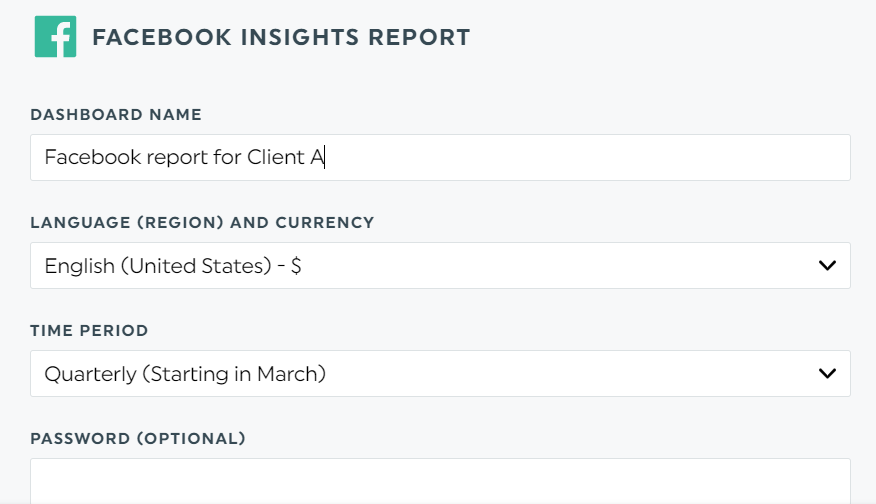
You can set your reporting daily, weekly, monthly, quarterly, semiannually, or annually. Pro Tip: Add a password for an extra layer of security.
Once you’re happy with your work, share it automatically with a URL link, email, or PDF copy.
Automate Social Media Reporting... Within Seconds
Tracking analytics across multiple social media management platforms can be challenging and exhausting, especially involving dozens of clients.
Luckily, there’s DashThis to help you gather all your social media data into one data visualization report (psst, you can even white-label it with our custom reports).
Whether using a free social media analytics tool (e.g., Google Analytics, Instagram Analytics) or an all-in-one digital marketing suite (looking at you, SEMrush), DashThis can connect all your social integrations with a few clicks.
Sign up for your free 15-day trial and automate your social media reporting today.
Here's a short video on how to create your social media report in seconds with DashThis:

Ready to automate your reporting?
Read More

Don’t miss out!
Follow us on social media to stay tuned!
Automate your reports!
Bring all your marketing data into one automated report.
Try dashthis for free