PPC Client Report: How to Build Better Reports That Clients Love

Ever tried explaining how clickthrough rates relate to quality scores and conversion costs… only to see them roll their eyes or glance at their phones?
Yup, we’ve been there. And it’s a sinking feeling to know you’re losing your audience.
Here’s the thing, we PPC (pay-per-click) marketers love our metrics.
But when you’re presenting to an executive or someone who isn’t as well-versed in marketing, ensure your reports meet client needs and are immediately relatable.
If you want to get your PPC reports up to scratch, this guide can help!
Table of contents
- What is a PPC report and why does it matter?
- 5 elements of a winning PPC report
- Expert tips: How to make your PPC data presentation stand out
- Common PPC reporting pitfalls to avoid
- Comparing 3 ways to create PPC client reports
- Automate PPC client reports with DashThis
- Start creating PPC reports that build trust with your clients
What is a PPC report and why does it matter?
A PPC client report tracks PPC performance across multiple ad accounts and campaigns in one place.
PPC advertising extends beyond Google Ads. Your PPC report may cover:
- Bing Ads
- Meta Ads (Instagram or Facebook ads)
- LinkedIn Ads
- Reddit Ads
- Pinterest Ads
- TikTok Ads
Having all your PPC channels in one place helps you and your clients track performance, identify optimization opportunities, and maximize budget efficiency across your entire strategy.
But effective reporting goes beyond metrics. It's a communication tool that strengthens client relationships and builds trust when done properly.
Questions a PPC report should answer
Before diving into how to create awesome PPC reports for your clients, let’s ask what purpose they serve. We’ve separated this into four themes.
- Business impact: How is PPC contributing to our revenue, sales goals, or pipeline?
- Strategic performance: Which PPC marketing channels are performing best? What's working and what's not? What are our next steps?
- Budget efficiency: Are we allocating spend efficiently across channels? Where’s the best return on investment?
- Campaign performance: What messaging or creative resonates most with our audience?
Before diving into your report, think about who'll be reading it.
Are you presenting to someone who's newer to PPC? Break down those marketing acronyms and industry terms into plain English. For example, instead of just saying "CTR increased by 25%", explain it as "25% more people clicked on our ads this month compared to last month."
Got a meeting with a senior executive? Keep it laser-focused on the metrics that directly impact their bottom line, think revenue generated, return on ad spend, and cost per acquisition.
5 elements of a winning PPC report
What should you include in your reports? Use this checklist to ensure you’ve covered everything. Better yet, create one, and save the report as a template to avoid missing anything.
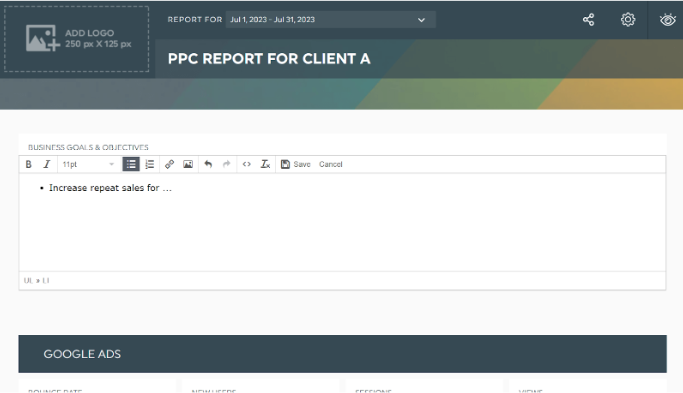
1. Campaign goal summary
Business goals set the stage for the report. They determine the overall PPC strategy, from identifying valuable keyword opportunities to guiding account budget strategies. Having them in one place communicates to everyone: “this is what we’re working towards.”
2. Executive summary
How do you ensure your busy executive reads the marketing report you’ve spent hours on?
Answer: A well-crafted executive summary.
Think of it as the blurb or hook your executive can read to get all the information they need. If they need more, they can read the rest of the report.
Use this structure for your 1-page executive summary.
- Summarize overall campaign performance in two lines
- Present 3-5 key metrics
- Highlight successes and challenges
- Recommend specific next steps
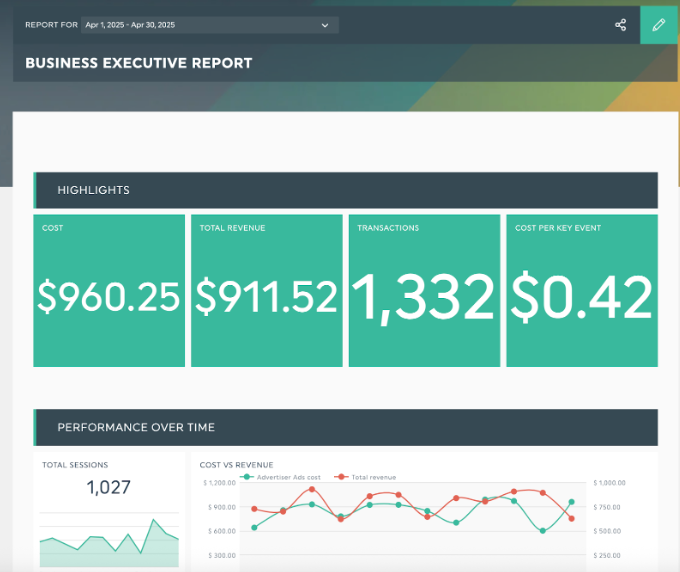
Use this executive report template with your own data
3. Relevant metrics
Keep to a maximum of 3-5 metrics to make your reports easier to review.
Tip: Typical PPC measures focus on quantitative metrics. Consider adding qualitative data like ad comments, customer feedback, and emerging keyword trends to round off your quantitative data.
If you’re unsure which KPIs to use, start with these metrics.
- Impressions: Ensures your ads reach your audience
- Cost per acquisition (CPA): Measures the cost of acquiring a new customer or lead. Useful for assessing campaign efficiency or budget allocation.
- Cost per click (CPC): Measures how much clients pay per click. Useful for tracking campaign cost trends over time
- Branded searches: Tracks how many people search for your brand or e-commerce product name
- Click-through rate (CTR): Measures ad relevancy and engagement
- Conversion rate: Essential metric for lead generation or sales campaigns.
- Return on advertising spend (ROAS): Measures campaign cost-efficiency.
- Engagement rate: Tracks user interactions with social media ads.
3. Data analysis
Now, with your metrics in place, you’re ready to interpret what happened and why. For example, here’s some questions for analyzing a recently concluded PPC campaign.
- Did the campaign meet or exceed our objectives?
- If so, why did it succeed?
- Can we replicate these strategies to other channels or future campaigns to maintain momentum?
- Were there any patterns or trends?
- If it failed to meet our client's objectives, what steps will we take to improve the next ad campaign?
- What potential roadblocks do we anticipate, and how will we overcome them?
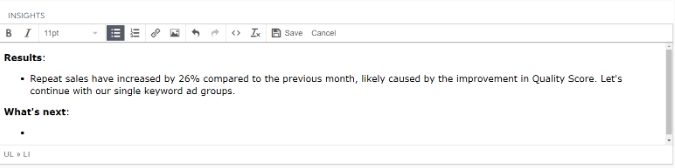
DashThis tip: Put this analysis in a comment box for your client to easily refer to.
These questions help you reflect on your next focus and show your clients you're thinking ahead. Setup's 2024 Marketing Relationship Survey found this matters more than ever. Clients want agencies to understand their work, suggest improvements, and be open and reliable partners.
5. Provide recommendations and next steps
You’ve analyzed the data and explained what happened. Now it’s time to explain your actions, including budget adjustments, optimization suggestions, or A/B testing plans and hypotheses.
Cover the next steps in detail so your client knows what to expect, like:
- Timeline: When will these changes happen?
- Ownership: Who is responsible for making and communicating these changes?
- Prioritization: Which recommendations to tackle first?
- Success metrics: What KPIs are we measuring to check if these changes help?
- Resources: What do you need from the client to implement these recommendations? (like access rights, documents, or approvals)
Expert tips: How to make your PPC data presentation stand out
We’ve covered the must-haves of a good PPC report, but how do you make it stand out? We’ve asked seasoned marketers for tips on how they make their reports more engaging.
Use a framework to structure your report
Brandy Hastings, SEO Strategist of SmartSites, uses a tiered funnel format to keep clients focused on what matters. She says:
“Our reports are structured using a tiered funnel format—awareness, consideration, conversion—so clients can see where the spend is pushing momentum. Each tier contains only the 2–3 most relevant metrics (e.g., CTR for awareness, CPC for consideration, CPA for conversion). That way, we help clients focus on progress at each stage instead of overwhelming them with noise.”
Another structure is the PASE framework by Kevin Moore, CMO of WalterWrites.ai. He elaborates:
We structure PPC reports using the PASE framework—Problem, Analysis, Solution, Effect. It keeps us from dumping metrics and instead moves the client through a logical arc. We start with the key problem we aimed to solve (e.g., poor mobile conversions), then present analysis (data + context), followed by what we changed (new bid strategy or copy tests), and finally, the effect (actual performance lift or directional signal). This format makes every report a decision-making tool, not just a review document.
Employ data storytelling
Data storytelling contextualizes your data insights for your audience. It spells out:
- Why is this data relevant to our business objective?
- What’s the key takeaway from this metric, table or graph?
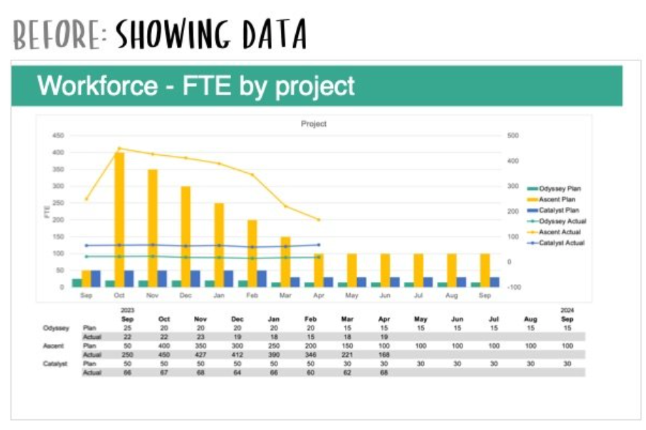
Let’s illustrate with an example from Storytelling with Data. In the before graph, you’ve got a graph showing full-time employment (FTE) by project. It’s a good metric, but it’s unclear why this data point is necessary.
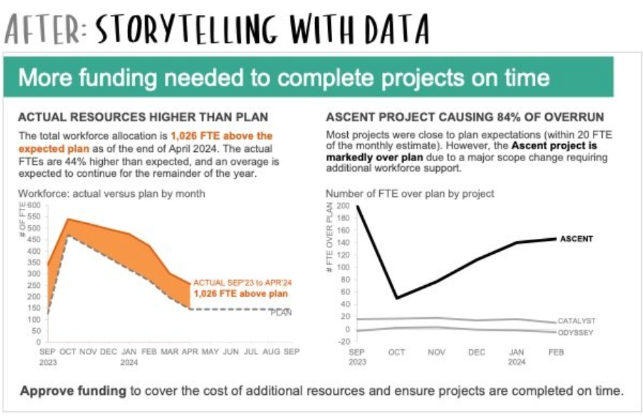
In the After example, the report leads with a clear statement that contextualizes the data and shows the reader, likely a project funding approver, why these numbers matter and what action to take. It’s immediately more actionable.
Want to make your marketing data meaningful to clients? Try GA4 consultant Kyle Akerman's approach. Instead of generic headers, he frames his Looker Studio reports around the key questions his clients care about. It's a simple but powerful way to make data relevant for his clients.
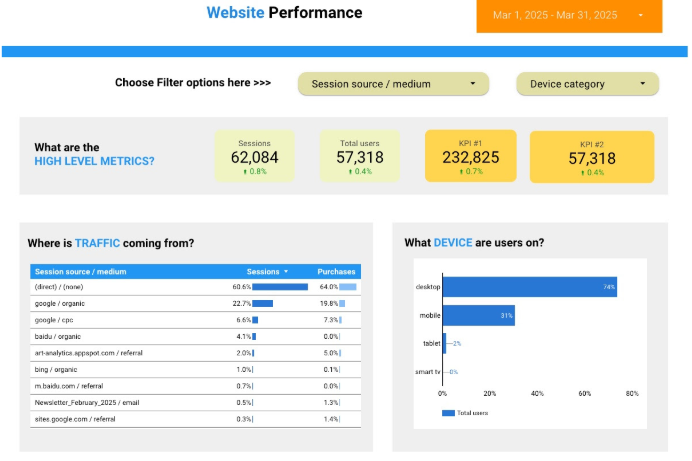
You can do this with data in DashThis too.
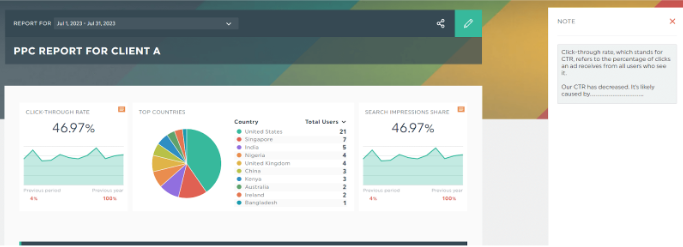
Add notes and comments to your report without cluttering it. You can do this as a dedicated text box in the report or adding a note to an existing widget.
Use analogies or visual metaphors to explain your data
PPC data is technical and hard to understand for those unfamiliar with marketing. Your agency’s report needs to connect marketing strategies to tangible business results and be framed for client understanding.
Some PPC experts use analogies or frameworks to make PPC lingo more understandable to their clients.
Ashot Nanayan, the head of marketing and founder of Digital World Institute, shares how he frames PPC metrics using real-life examples.
“Teaching a non-technical client about PPC is the business of translating code into human emotion. One analogy that we like to make very often is comparing a Google Ads campaign to a car lot. Your campaign is your showroom. Impressions are people passing by the dealership. Clicks are people entering the door. Conversions are people who buy a car. The CTR tells us how well our showroom is performing at getting seen, and the Quality Score is like our dealership’s Yelp rating—higher is better and gets our ads displayed for less.”
Other marketers use a consistent structure for metrics in reports, instead of relying on metaphors. Kevin Moore of WalterWrites.ai introduces each performance metric with a 3-part structure:
- What it is
- Why it matters to their goal
- What a “good” range looks like for their industry.
“Clients don’t need metaphors—they need consistency. Once they understand the rhythm of reporting, they engage more confidently with the data,” he adds.
Takeaway: Understand your client’s perspective and translate the metrics into something they understand.
Got a client who thinks in dollars and cents? Link the impact of a PPC metric to revenue or cost savings. A quick note explaining how a campaign tweak or targeting change reduced wasted ad spend can make technical metrics relatable.
In DashThis, hover over the metric and click the Dropdown Arrow icon > Add Note > Save.
Add a personal touch to your report
The previous tips lay the groundwork for a solid PPC report, but exceptional reports go further by guiding clients through the data. Take marketing agency Search Station's approach - they pair their reports with recorded video walkthroughs, where account managers highlight key findings and explain strategic recommendations. This adds a personal touch to their service delivery.
Enhance presentations with the right visuals
Data visualizations help clients grasp trends and insights.
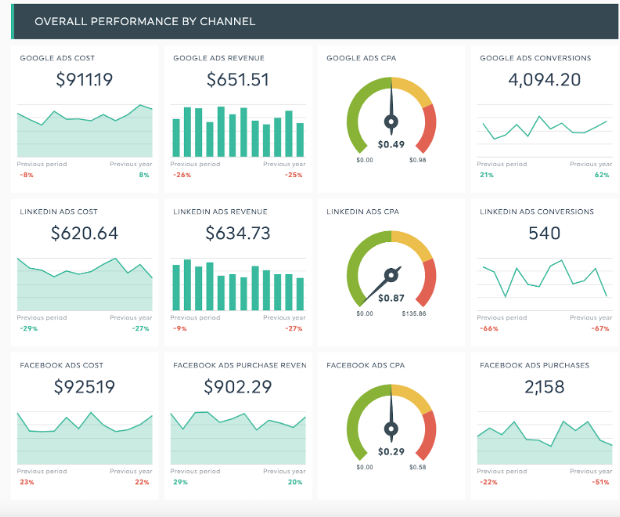
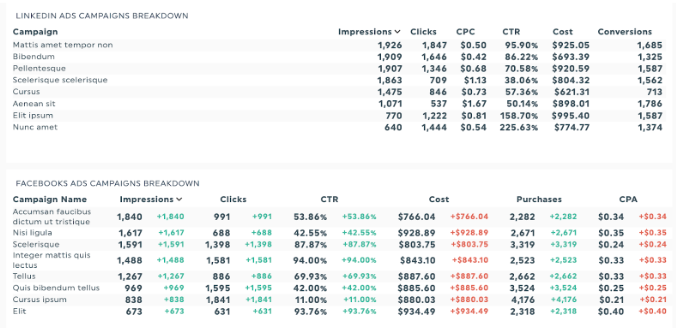
For example, if you’re preparing a report to compare PPC channels like Google Ads, Facebook, and LinkedIn ads, you can use visuals to compare key metrics like cost, revenue, CPA, and conversions to see which channel performs best.
How about a more in-depth look at campaign performance? Use colors to contextualize the data, and a neat table to highlight well-performing metrics and what needs attention - making the information more memorable and actionable.
Common PPC reporting pitfalls to avoid
We’ve covered how to make a good report, what should you avoid? Here’s a few tips.
Be upfront with poor results
Not all campaigns will produce stellar results. Share honestly what went wrong and not hide poor results.
As Khris Steven, Founder at KhrisDigital, says honesty helps build trust with clients.
I’ve learned to be upfront when things bomb. One ad set tanked with $300 in spend and no results. I didn’t sugarcoat it. I showed what failed, why it failed, and what we tested next. That honesty is what kept them around long enough to hit their next big win.
Presenting too much data
Be selective with the information you present to avoid overwhelming your clients.
Heinz Klemann from BeastBI says:
“One big one: Showing too much. Just because we can track 25 metrics doesn’t mean the client needs to see all of them. The most helpful reports focus on 2–3 key numbers. If the client can read one line and instantly know “things are going well” or “we need to talk,” that’s a successful report.”
Not providing context to the data
Provide context for your clients to understand your PPC reports.
As Elad Maoz, Chief Partnership Officer of Gifted.co shares:
"One big mistake I made early in my career was assuming clients or stakeholders would understand PPC context, like why CTR dropped after a budget shift or why CPA goes up in competitive months. I've learned that context is everything. Now I bake in a short 'What changed this month?' section into every report."
What does meaningful context look like? Here are examples for your data analysis.
Historical comparisons: Consider month-over-month trends or year-over-year performance to measure progress against campaign goals.
Industry benchmarks: These can be metric averages or a typical metric range.
External factors: Market conditions, competitor activities, or algorithm changes can influence performance.
Inconsistent reporting
Switching metrics or report formats between periods confuses clients. If you're tracking different KPIs each month, how can anyone spot trends?
To keep your reports clear and trackable, aim to maintain:
- Consistent KPIs aligned with campaign goals
- A standardized report structure for your clients.
- A regular reporting schedule (weekly, monthly, or quarterly)
- Clear comparisons between time periods to show progress
Building consistency into your reporting process pays off; clients can better track performance over time and spot trends. Here’s a part of your process you can simplify with automation. DashThis's reporting scheduling feature handles the routine work, letting you focus on analysis and insights.
Comparing 3 ways to create PPC client reports
How do you create a PPC report? We compare three options: Excel, Google Looker Studio and report automation tools like DashThis.
Option 1: Manual spreadsheets, Microsoft PowerPoint or Excel
Spreadsheets work fine for a few accounts but may not suit growing agencies improving their reporting process. Manual entry is time-consuming for multiple campaigns and clients, and risks errors that can affect your credibility.
Pros:
- Free to use
- Easy to learn
Cons:
- Requires manual data entry (high risk of errors)
- Lacks real-time data updates
- Difficult to scale
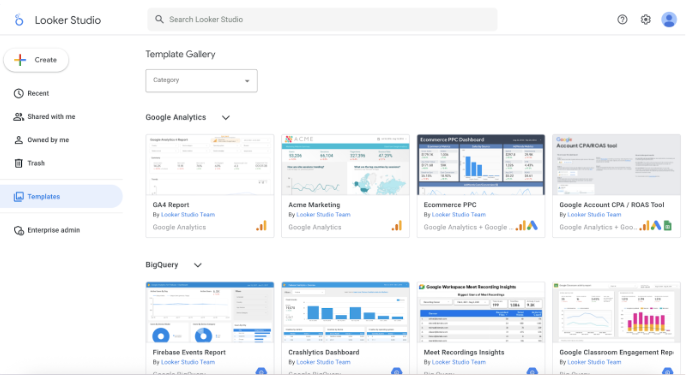
Option 2: Google Looker Studio
Formerly Google Data Studio, Google’s free data visualization tool lets you connect marketing data from Google platforms (Google Ads, Analytics, YouTube) with data from processing tools like BigQuery and SQL. It includes interactive tools like filters, date range controls, and charts to customize and visualize data. However, it can be complex to set up and has limited native integration options for non-Google platforms.
Pros:
- Free to use
- White-labeling features
- Data visualization capabilities
Cons:
- Learning curve to set up and use
- Can only import data natively from Google’s platforms. Other platforms need a third-party connector which can incur fees
Option 3: Marketing report automation tools like DashThis
Think of marketing report automation as your data assistant. It’s software that automatically pulls, organizes, and visualizes all your marketing numbers in one custom report.
Instead of spending hours creating performance reports manually or struggling with data, automation tools like DashThis save time on reporting, updating dashboards in real time, and keep you focused on analysis and delivering results.
Pros:
- 34+ integrations covering PPC, SEO, email marketing campaigns and more, giving a full picture of your ad performance across different ad platforms
- 50+ report templates for quick ad platform reporting
- Drag-and-drop interface makes it suitable for non-technical users
- Multiple report sharing options from PDF exports, shareable URLs and email
- Automated report scheduling
Cons:
- Not free to use, but we have a 15-day free trial to try DashThis.
“Reporting is everything in the world of digital marketing. It is how our work is measured with clientele, and it’s how we continuously evaluate campaign strategy internally for our client portfolios.” - Darian Kovas, Founding Partner at Jelly Marketing and DashThis client
Automate PPC client reports with DashThis
Let’s explore creating a PPC client report on DashThis:
- Select the PPC dashboard template
- Connect your data sources (DashThis offers 34+ integrations like Google Analytics, Bing, and Facebook Ads dashboards)
- Choose your metrics in Preset Widgets
Sit back, while the reporting software auto-grabs your PPC data into the report. Drag and drop them as you see fit. Now, your report is ready for analysis and sharing!
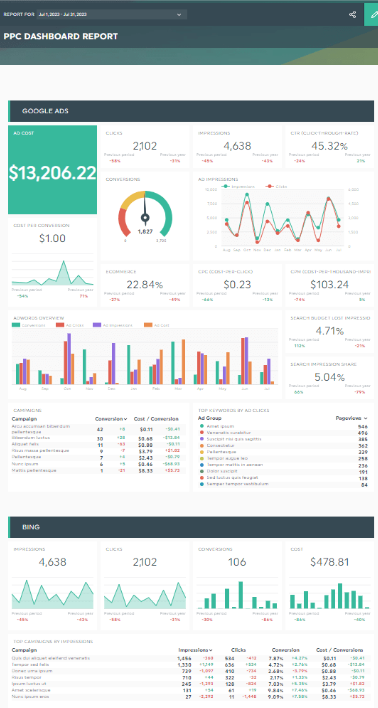
Spotlight: DashThis’s PPC dashboard template
Get this PPC report template with your own data!
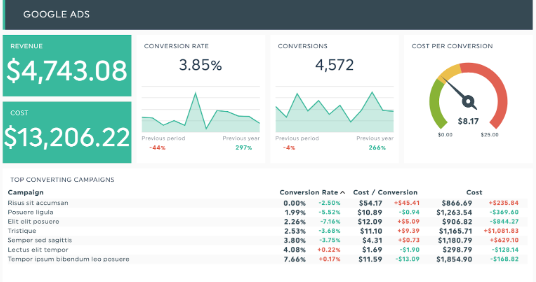
Our PPC report template includes essential ROI metrics, data visualizations, and sections to help you prepare for the campaign performance review meeting with your client or team.
Report templates are fully customizable, allowing you to drag and drop metrics, reorder sections, and white-label reports for clients. Save time by saving the completed dashboard as a reusable template!
Start creating PPC reports that build trust with your clients
Solid PPC reporting transforms campaign data into actionable insights that demonstrate value to clients. By combining the right metrics while focusing on client needs with meaningful context and strategic recommendations, you can create reports that guide decision-making and build trust with your client.
Ready to create awesome PPC client reports? DashThis is the easiest PPC reporting tool. Try it free for 15 days to automate your PPC ads reporting process.

Ready to create awesome PPC reports for your clients?
Read More

Don’t miss out!
Follow us on social media to stay tuned!
Automate your reports!
Bring all your marketing data into one automated report.
Try dashthis for free