Report vs. Dashboard: which one do you need? (+ dashboard templates)

Businesses thrive on results and data analytics. Whether you’re a marketer, small business owner, or freelancer, it’s essential to monitor the changes in your business and your clients’ businesses. Most reporting tools allow you to present business metrics either as a dashboard or a report. Which one is best for you?
In this article, we’ll show you the differences between a report and a dashboard and when to use each one.
- What is a report
- What is a dashboard?
- What are the differences between a report and a dashboard?
- Dashboard vs reports: Which one should you choose?
- Bonus! Dashboard examples and templates
- - Small business report template
- - Sales report template
- - Digital marketing report template
- - SEO report template
- Choose a reporting tool that’s right for you
What is a report?
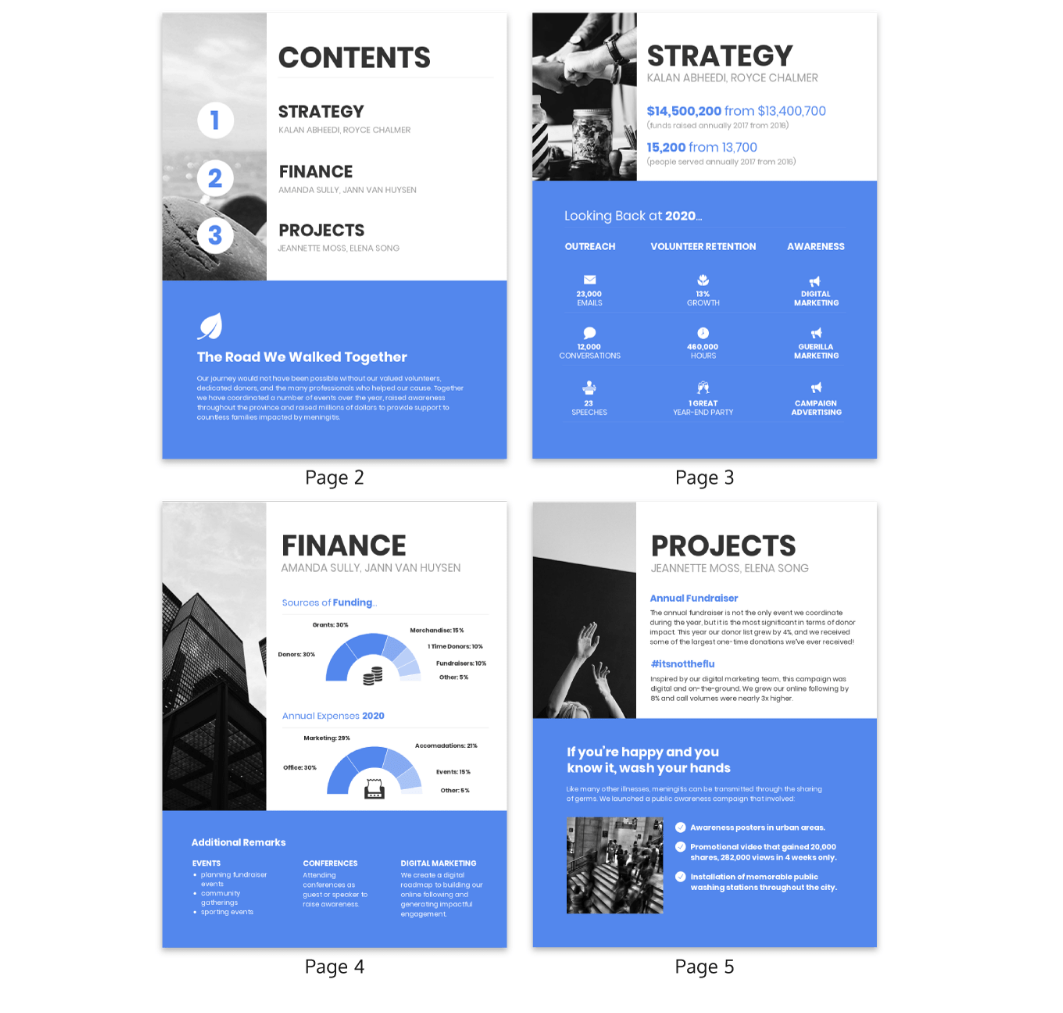
A report is a comprehensive document with in-depth data about a company’s operations as a whole or on a particular segment. For example, a marketing report would detail the results of marketing campaigns, how many sales the strategy is driving, and which channels are most effective.
Reports typically contain text, charts, graphs, and tables that drill down on the organization’s growth and progress. They can span several pages and typically include information from a past period, such as the month before, for example.
You can share reports with clients, stakeholders, supervisors, or your team. If you’re a small business owner, you can even use them on your own to monitor your business data and key performance metrics (KPI).
Besides digital marketing reports, you can create sales reports, SEO reports, and reports for your small business. If you need to make several reports regularly, it may be worth looking into using report templates. These come with preset metrics and lighten the tedious task of filling in the same parameters for every report.
What is a dashboard?
A dashboard allows you to view current data, specific metrics, and KPIs at a glance. This data visualization tool provides a high-level view. It highlights the key data, updating you about the performance of your business without needing to scroll through several pages.
Much like a car’s dashboard, they work well for quick, focused data analysis and you can see what’s working without needing to pore over pages of a report.
You can also customize dashboards templates to suit your business. Simply replace the template metrics with yours, connect your marketing channels, and get live updates on the dashboards.
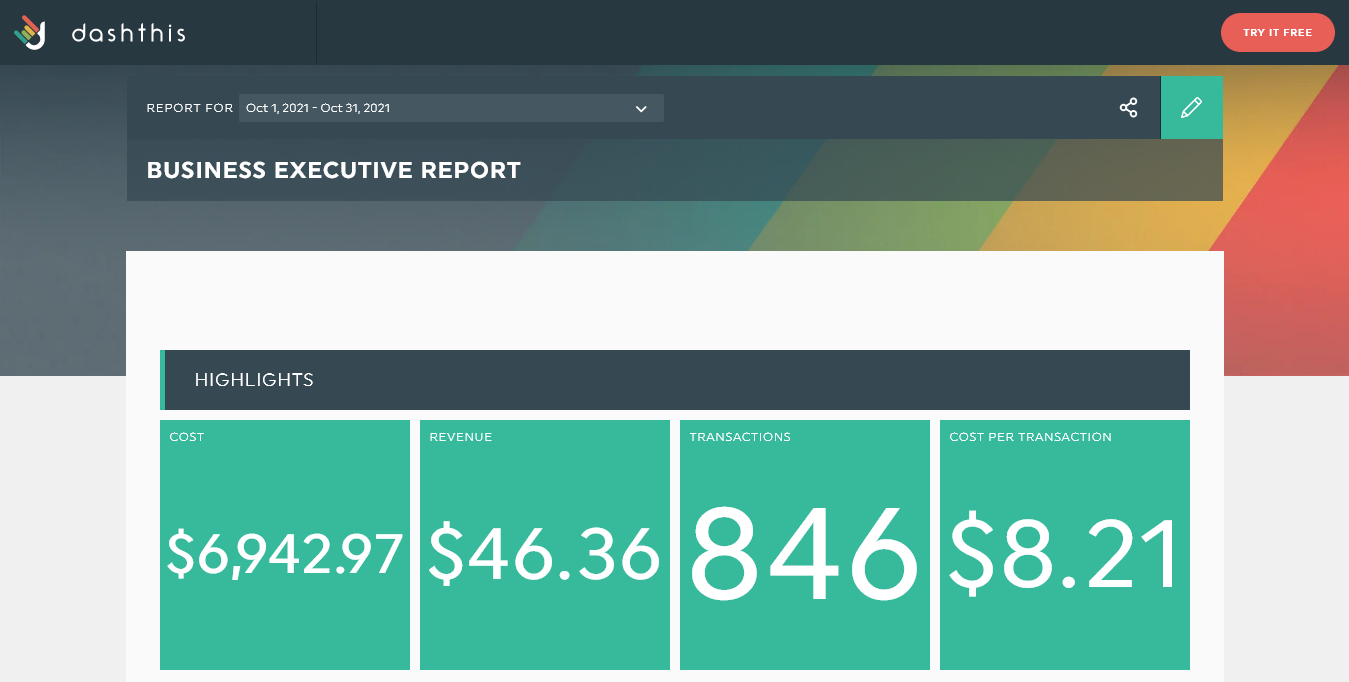
Grab this executive dashboard | Try it with your data
What are the differences between a report and a dashboard?
While both dashboards and reports present data for evaluating your business, they’re not the same. Here are some of the key differences between a report and a dashboard:
-
Level of understanding
Dashboards provide a high-level view of the key performance indicators. Right off the bat, you can see the main metrics as soon as you load the dashboard. With dashboards, it’s easy to tell which numbers have risen or plummeted since the last review, and checking on progress only takes a few minutes!
Reports on the other hand delve into detail and require time to comb through and extract actionable information.
-
Visual presentation
Typically, reports are designed to be packed with detailed data. As such, they’re more granular, highlighting specific information. However, reports can also feature infographics, charts, and tables. They tend to include additional information and summaries explaining the generated data.
Dashboards are more visual and tend to fit on a single screen or single page. They contain minimal explanatory text, focusing more on interactive charts and tables. As a result, they’re easier to read for specialists but may require additional explanation for stakeholders who may not fully understand the displayed metrics.
-
Static vs. dynamic
Reports are a static representation of the state of affairs. They’re generally presented at the end of a specific period. They inform your clients, manager, or stakeholders of any progress or losses made within the past period.
In contrast, dashboards are more dynamic. They’re often regularly updated — up to the minute! — and keep everyone on the team abreast of changes as they happen. A dashboard is also more interactive, so end-users can click on charts and tables to gain more information about the metrics.
-
Versatility
With reports, what you see is what you get. They usually include data sets from a set period — often monthly — and can be inflexible when it comes to being interactive or providing data about operations in the present or during shorter timeframes.
With dashboards, you have more versatility. You can see changes as they happen. Dashboards can be updated as regularly as necessary, whether you prefer daily, weekly, monthly, quarterly or annual updates. Unlike reports, dashboards can also be set to alert users to new updates or when a certain metric reaches a stipulated threshold.
Dashboard vs reports: Which one should you choose?
Both reports and dashboards are essential business intelligence tools. They are crucial for making sense of analytics and adjusting strategies to propel your business forward.
Reports excel at presenting detailed information for review at specific periodic intervals. Dashboards, on the other hand, deliver data on demand in a highly visual, interactive, and compact interface. But which format is best for you?
It depends on the person to whom you’re presenting the information as well as the purpose of the data presented.
Higher-level executives, CEOs, and stakeholders who are unfamiliar with the nitty-gritty of operations may do better with a monthly or quarterly report. It presents a broader scope of data and includes necessary explanations to show them the impact of marketing strategies over a period of time.
Team members and other C-suite members such as a CFO or COO may benefit more from the at-a-glance nature of dashboards. Since they understand the key performance metrics and their significance, a quick view that brings them up-to-speed in minutes is a life-saver for their busy schedules. They can also get more frequent daily or weekly updates using a dashboard.
Before you decide how to present your data, think about your viewer’s level of understanding. Also consider how much time they have to review the data (reports can be time-consuming!), and how frequently they need to be updated.
Bonus! Dashboard examples and templates
DashThis makes it easy to create visually appealing dashboards in minutes. Once you’ve created an account, it’s as simple as connecting your integrations, choosing your preferred dashboard, and customizing your dashboard design as necessary.
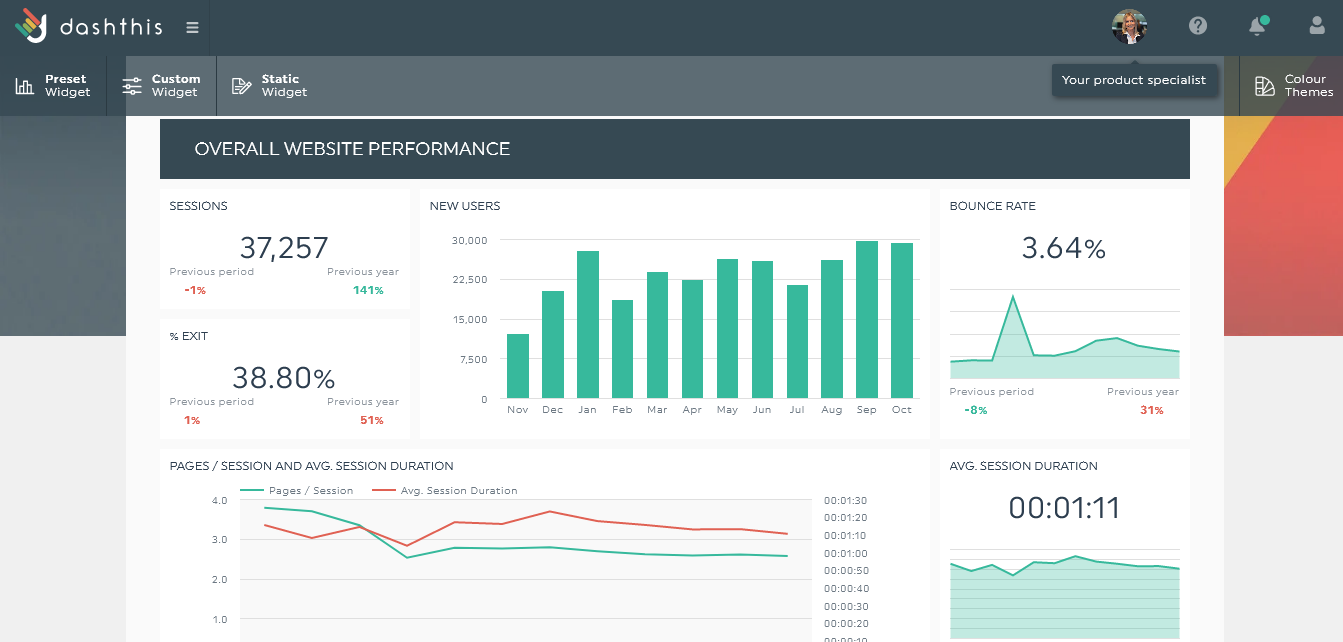
It doesn’t matter which marketing reports you need. With connections to over 34 popular platforms including Google Analytics, Ahrefs, Facebook, and more, you can see all your KPIs in one place. Gain insight into your website’s performance, use drag-and-drop widgets to customize your template, set viewing permissions for team members, and receive daily updates as DashThis imports new data every day.
Don’t need a certain metric? Delete it. Wish some metrics were on the board, add them! DashThis also includes dashboard templates that help you set up yours with minimal effort. Here are some dashboard template examples to get you started.
-
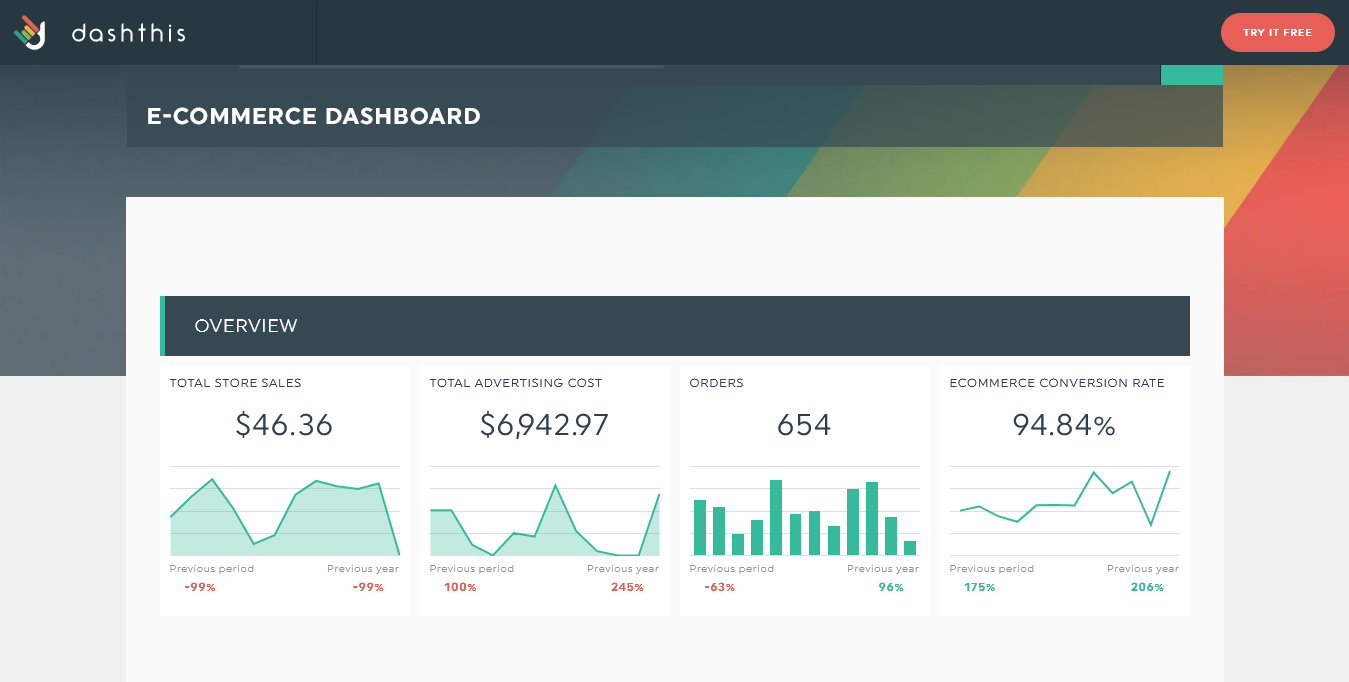
Small business report template
This dashboard template is geared towards helping small business owners scale their digital marketing efforts and drive sales. You can monitor everything from site traffic to ad campaigns and social media growth over time. It also lets you generate periodic reports if you need to keep the business owner updated about marketing progresses.
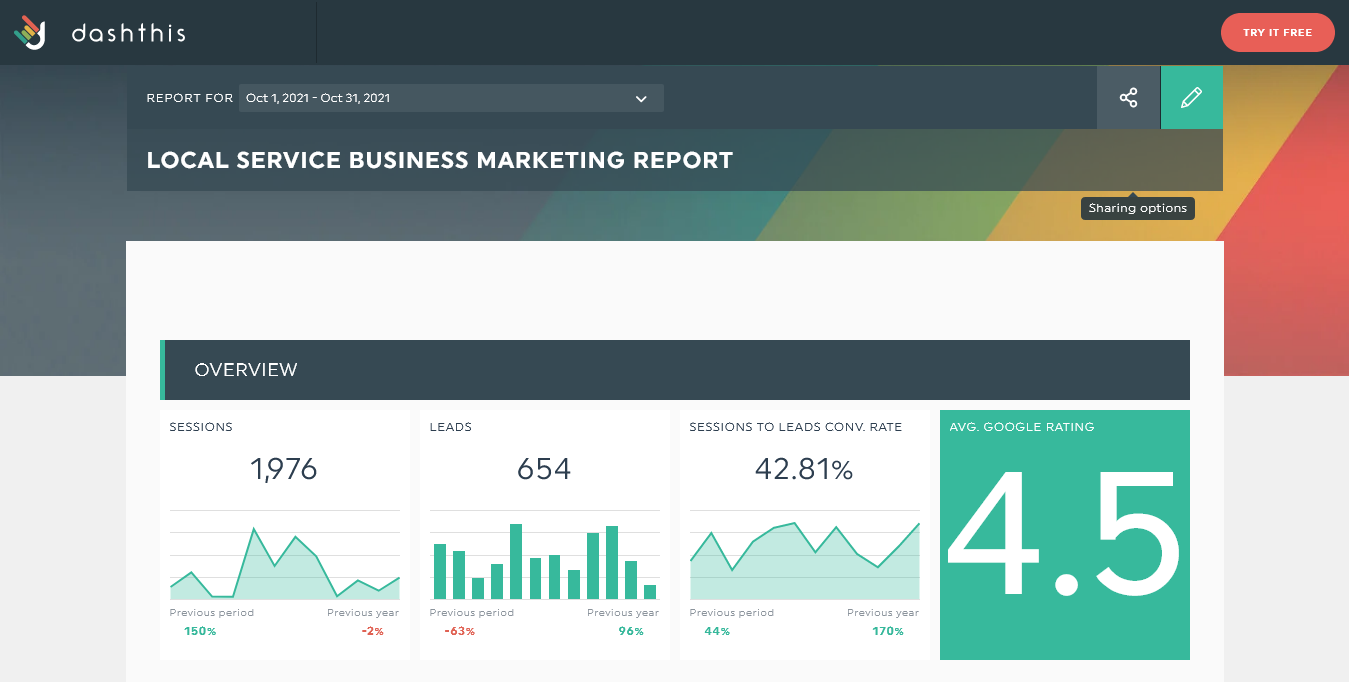
Grab this dashboard with your own data!
-
Sales report template
Looking for a less stressful way to monitor your sales transactions and track your conversion rate in one go? Try DashThis sales report template. Since DashThis integrates with Shopify, Google Sheets, Formstack, and more, this template lets you import information from a wide range of data sources so you can skip manual data entry.
Grab this dashboard with your own data!
-
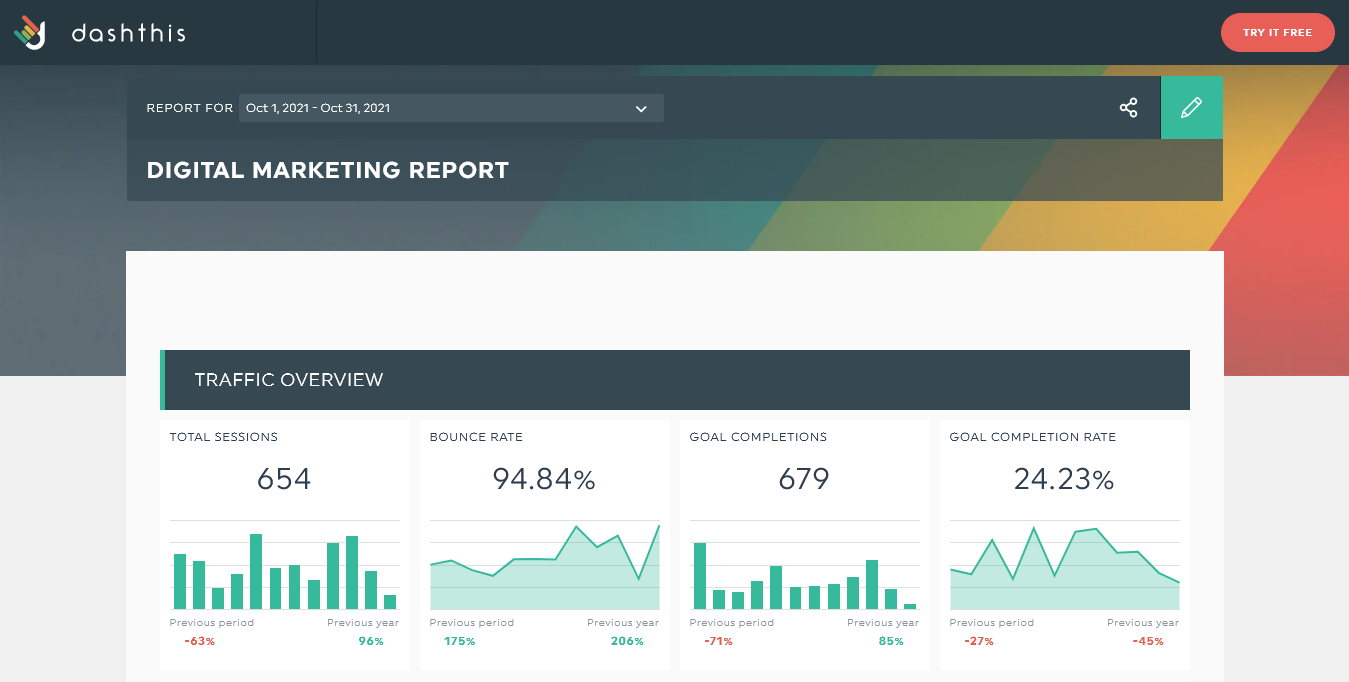
Digital marketing report template
Track the efficacy of your marketing strategies with this preset template. Check on KPIs like bounce rate, conversion rate, and channel and campaign performance over time. You never have to wonder how any of your marketing channels are performing.
Grab this dashboard with your own data!
-
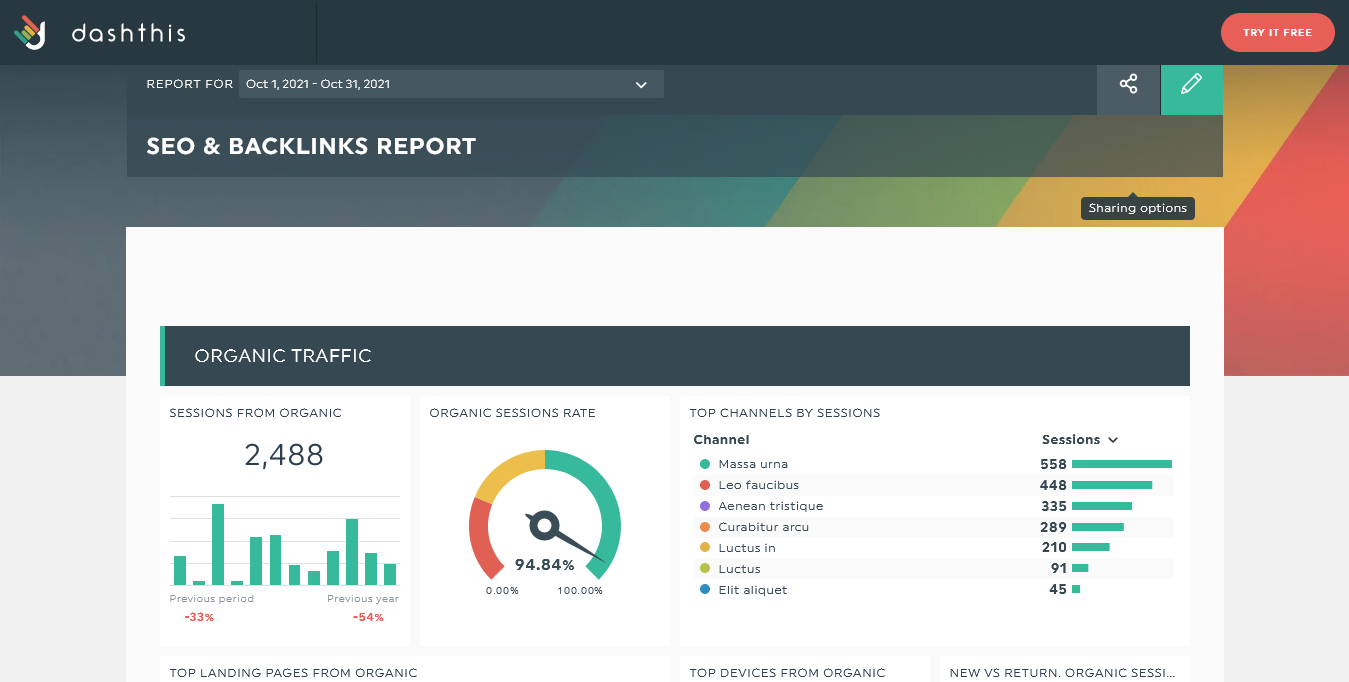
SEO report template
Tired of switching between multiple platforms to track all your SEO metrics? Try this SEO report template that highlights all the major KPIs you need to keep up with SEO performance. Click-through rate, page load time, organic search traffic, new and returning visitors, and so much more.
Grab this dashboard with your own data!
Choose a reporting tool that’s right for you
Successful businesses often have one thing in common: they monitor their KPIs. Metrics show you what’s working and when to pivot or try new strategies. You can keep track of your KPIs using reports or dashboards.
Dashboards provide at-a-glance, dynamic, high-level information. Reports are often the longer, more in-depth summaries about how the business has performed in a specific past period.
Save reports for higher-level stakeholders interested in learning about periodic growth, but who may need more explanation. C-suite executives, specialists, and team members who need real-time updates and can grasp technical terms without explanation will benefit from dashboards.
Need an effective marketing reporting tool that provides both dashboards and reports? Try DashThis today!

Ready to automate your reporting?
Read More

Don’t miss out!
Follow us on social media to stay tuned!
Automate your reports!
Bring all your marketing data into one automated report.
Try dashthis for free