Reporting and Analytics: Understanding the Differences

Reporting and analytics are far from two peas in a pod—but that doesn’t mean we can do one without the other.
In today’s guide, let’s review the major difference between reporting and analytics, why they're both important, and finally, how you can gain back time in your analytics reporting using an automated marketing tool called DashThis.
- What is Reporting?
- What is Analytics?
- What is the Difference Between Reporting and Analytics?
- How to Create a Report with DashThis?
- Gain Back Your Time in Analytics Reporting with DashThis
What is Reporting?
Reporting transforms raw data into a digestible and cohesive presentation through automation.
Think of it as a health screening test that shows what’s happening in the human body.
Note the report below created with DashThis, a reporting tool. It combines data from Google Analytics, Google Ads, and Facebook Ads in a single interface.
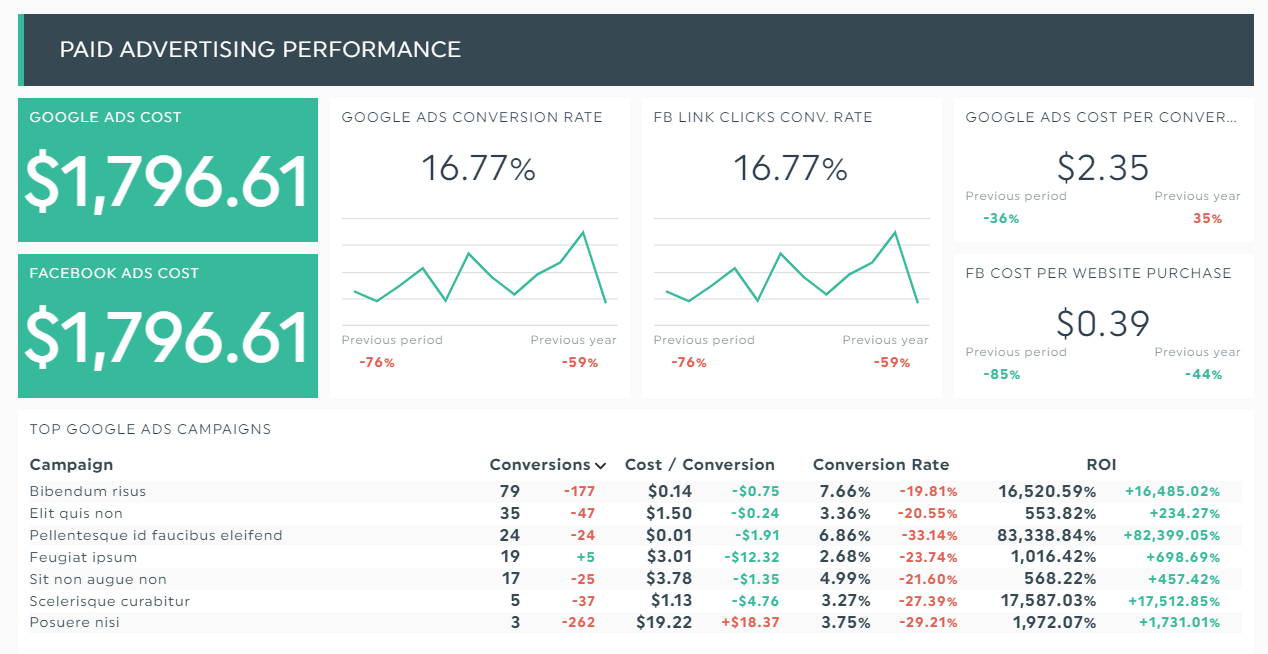
Grab this ecommerce template with your own data!
Instead of squinting your eyes at a spreadsheet and spending hours trying to evaluate if the strategy is working, you can deduce the results instantly.
Start your free 15-day trial today.
What is Analytics?
Analytics investigates the data gathered from reporting and aims to understand the “why” behind it.
Think of it as a team of doctors that identifies the root cause of a medical condition and implements a heart-healthy plan to improve it.
What is the Difference Between Reporting and Analytics?
We use analytics and reporting interchangeably, and it’s a mistake as there are key differences. Here are the three biggest things that set analytics vs. reporting apart.
The goals
Both reporting and analytics boast different purposes.
Reporting sets the foundation of analysis.
It turns incoherent data into easy-to-understand summaries, so that marketers can analyze the results at a few quick glances.
Tip: This applies not only to individual data. Reporting tools also let you merge complex data from different sources into a single widget to show the overall performance.
Unlike reporting, analytics distill actionable insights from your newly turned digestible data to optimize performance—whether it’s making better forecasts, reducing expenses, or just about improving any business decisions.
How the data is presented
Reporting is all about data visualization.
Big data sets from marketing channels (or spreadsheets like Microsoft Excel) are automatically transformed into colorful graphs and charts on dashboards.
Based on the SEO report below, we can conclude that even though organic sessions have been inconsistent, there is a significant improvement compared to the previous year.
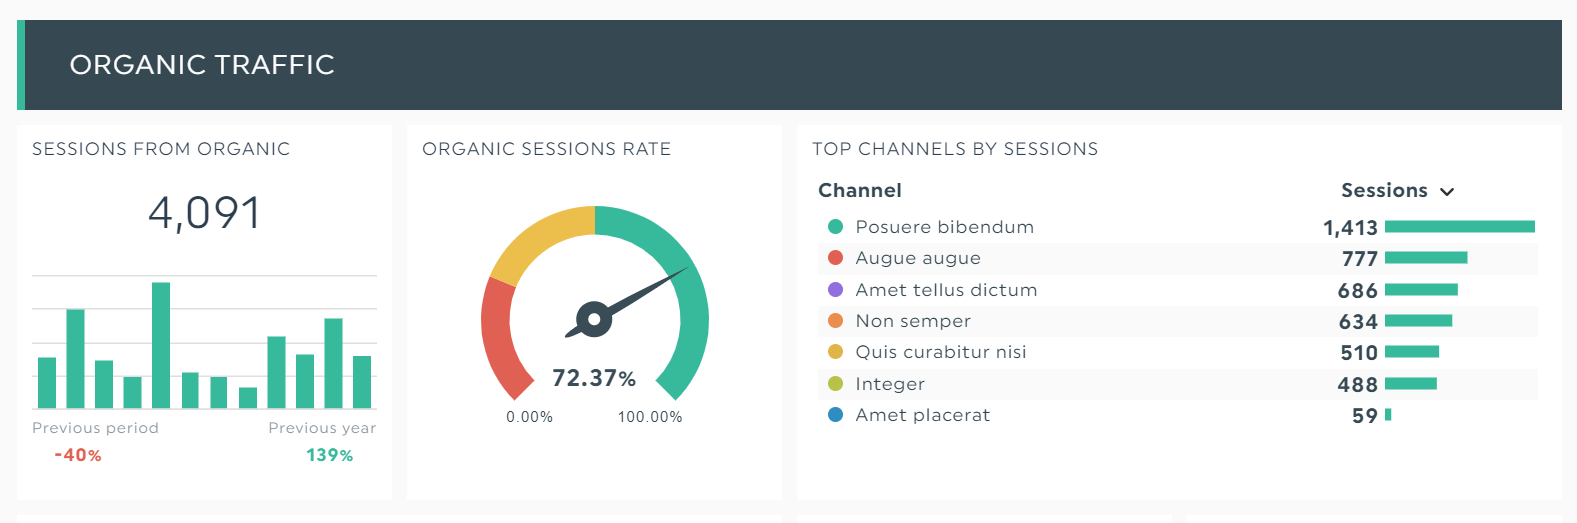
Grab this SEO and backlinks report with your own data!
This clear formatting makes analysis quick and easy.
The people
Reporting and data analytics involve different stakeholders.
In agencies, reporting falls on the marketing manager’s shoulder. They oversee dozens of marketing campaigns, track metrics and KPIs on analytics tools, and update the higher-ups on the progress of their marketing efforts.
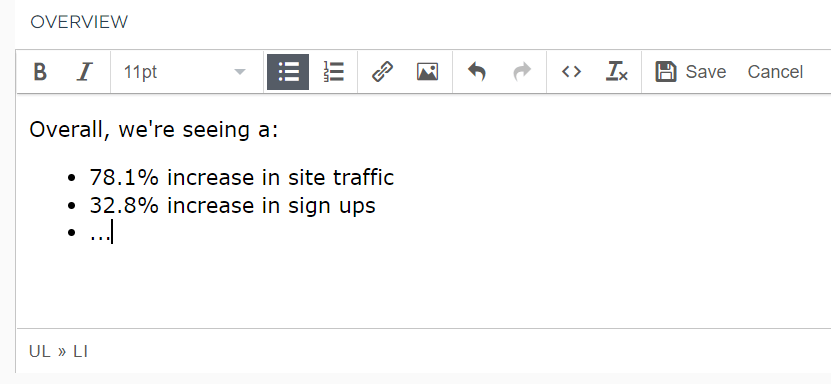
To save time for management, the marketing manager might even add a quick note in the report itself to summarize the overall business performance.
You can easily do this in a reporting tool like DashThis. Click Static Widgets > Comments. In the editor, share an overview and click Save.
On the other hand, analytics involve clients and specialists (e.g., content strategists, heads of SEO).
This group of people usually gather round in monthly meetings to strategize the next move. Depending on the agency's project contract value, the process might even involve the senior leadership team.
So, which do you need?
Both reporting and analytics are vital.
Here’s a real-world scenario to explain what we mean.
Imagine you’re a B2B SaaS data analyst conducting financial reporting on Oracle, a complete suite packed with business intelligence and analytics capabilities.
After spending hours on a detailed data analysis, you discovered the culprit behind the stagnant revenue growth: SaaS churn.
You turned to Google Analytics, Pendo, and HubSpot’s CRM to dig deeper into the user behavior.
After gathering every piece of data from these different channels into an automated dashboard (reporting), you learned (analytics) that the:
- Number of free trial sign-ups is high for SEO and Bing Ads, which indicates messaging is on point
- Activation rate, feature adoption rate, and time-to-value are high, which indicate that there’s a product/market fit
- Customer satisfaction score is at an all-time low, which indicates that it could cause customers to churn
And bingo.
These new insights within your fingertips help you make your case to the higher-ups about investing in customer service training.
That's exactly why you need both analytics and reporting—to monitor performance, accelerate decision-making, and identify hidden revenue opportunities.
How to Create a Report with DashThis?
Reporting and analysis shouldn’t take a bulk of your time.
Analytics solutions like DashThis combine all your data into one beautiful report. That way, you can track performance, make informed decisions, and strategize your next move with no unnecessary delays.
Here’s how it works:
- Pick a template
- Connect your favorite data sources (note: DashThis currently supports 30+ integrations)
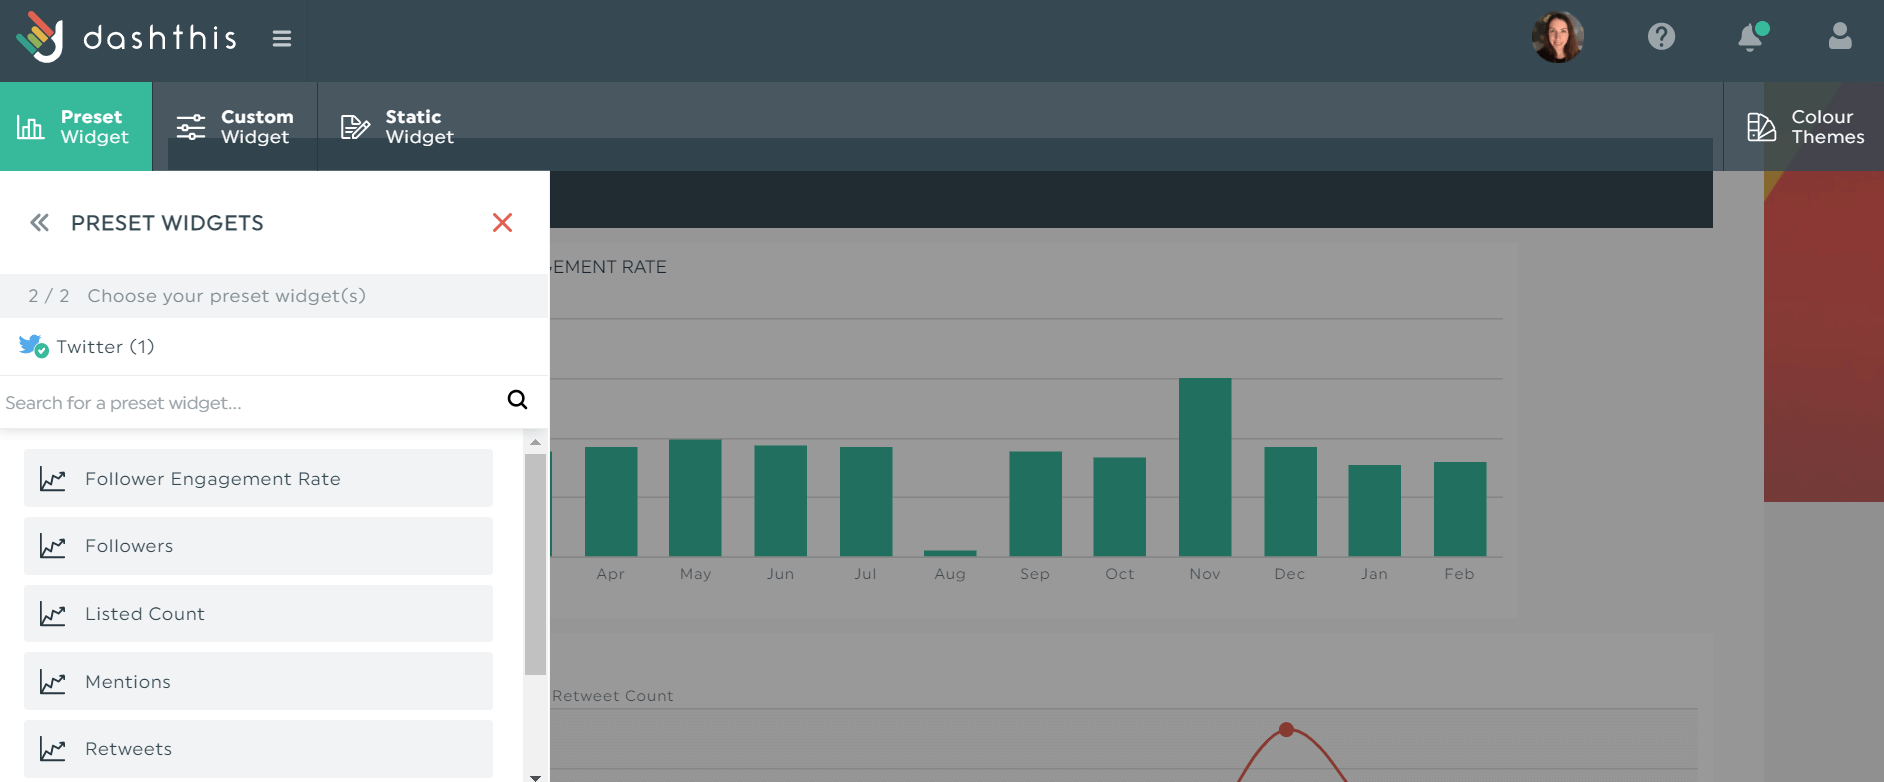
- Click Preset Widgets on the top left to select your metrics
Drag and drop the metrics as you desire.
Once you’ve finished designing the report, give your team and clients real-time access via a shareable URL link. This reduces ad hoc querying, since everyone will have easy access to these reports.
Configuring automated email reports is also possible on DashThis. Simply choose your desired frequency and dashboard period and save it.
Gain Back Your Time in Analytics Reporting with DashThis
Reporting and analytics may not be two peas in a pod—and they are often used interchangeably—but that doesn’t mean we can do one without the other.
Start conducting analytics reporting with DashThis today.
Our automated reporting tool combines data from multiple channels in one beautiful report, ensuring fuss-free reporting and analysis.
Grab your free 15-day trial today.

Ready to automate your reporting?
Read More

Don’t miss out!
Follow us on social media to stay tuned!
Automate your reports!
Bring all your marketing data into one automated report.
Try dashthis for free