
Create your Bing Ads dashboard today!

Advertising on Bing and/or Yahoo! search engines? You’re using Bing Ads to do so, right? With DashThis, you can see all your Bing Ads data in one perfect dashboard; either on its own, or compared to all your other PPC advertising data!
-
27 +
Preset Widgets
-
20 +
Metrics & dimensions
-
1 +
Dashboard templates


 Your logo
Whether your own or your client’s logo, make your report reflect your brand!
 All-in-one
Drag-and-drop your widgets onto your dashboard to create a clean report layout that includes all the information you need.
 Your data
Customize your widgets to show the data you want, the way you want to.
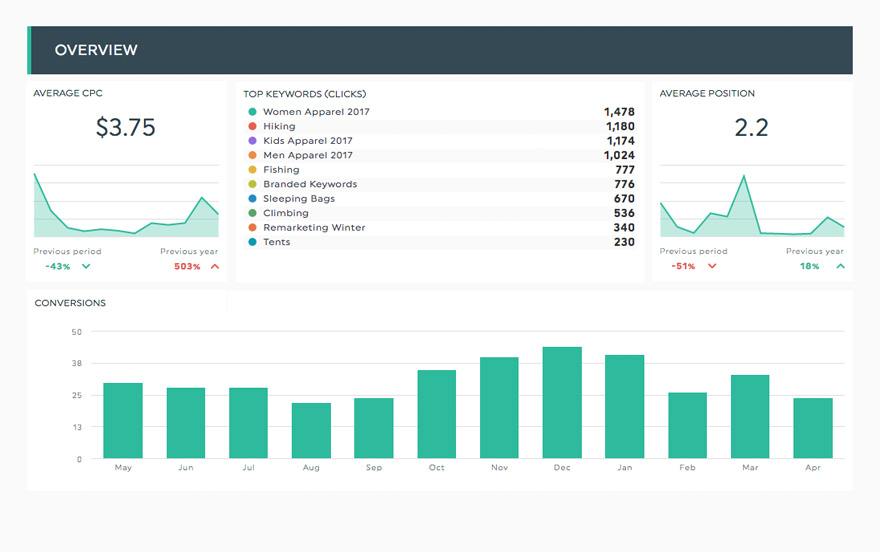
Available Preset Widgets
Featuring the most common KPIs, these widgets are ready to use! Drag, drop, done!

-
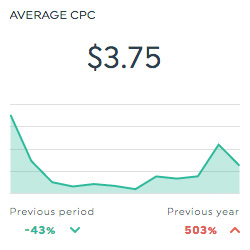
Average CPC
This historic widget shows the average cost of each click on your Bing Ads, which is calculated by dividing the total spent by the total number of clicks.
-
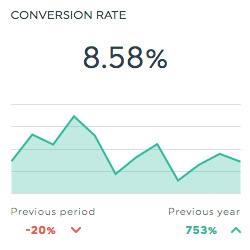
Conversion Rate
This historic widget shows the percentage of clicks on your Bing Ads that led to a conversion (whatever your definition of conversion may be). This is calculated by dividing the number of conversions by the number of clicks, and multiplying by 100.
-
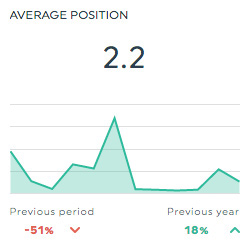
Average Position
This historic widget shows how your Bing Ads typically rank against other ads, and therefore, the order in which they will appear on the search page.
-
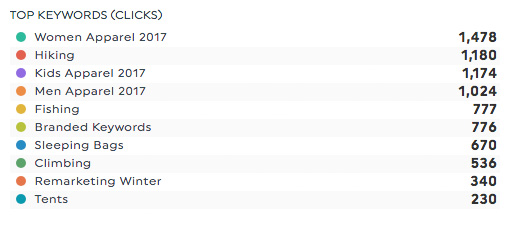
Top Keywords (Clicks)
This list widget shows how many clicks each keyword used for your Bing Ads generates.
Available Metrics, Segments, & Dimensions
These are the top 10 metrics and dimensions users usually include in their Bing Ads dashboard:
- Ad Cost
- This is the amount you spent on clicks and impressions for your Bing Ad.
- Average Ad Position
- This shows the position in which your Bing Ad typically ranks against other ads.
- Click-Through-Rate (CTR)
- This percentage shows how often people go to your website because they saw your Bing Ad. It is calculated by dividing the number of clicks by the number of impressions and multiplying by 100.
- Cost-Per-Conversion
- This is the average amount you spent on each conversion. It is calculated by dividing the total spent by the number of conversions.
- Revenue
- This is the total income resulting from your Bing Ads.
- Return on Ad Spend (ROAS in $)
- This is the amount of revenue generated for every dollar spent. It is calculated by subtracting the ad cost from the total revenue.
- Goal Completions Total (Conversions)
- This is the total number of times people took a desired action after clicking on or seeing your Bing Ad.
- Ad Clicks
- This is the number of clicks on your Bing Ad.
- Device
- This is the type of device (mobile, desktop, etc.) used to view your Bing Ad.
- Keyword
- This is the keyword for which your Bing Ad ranks in searches.
Other Useful Integrations
Get a more inclusive view of your data by including these integrations in your dashboard too:


