1. Organic traffic
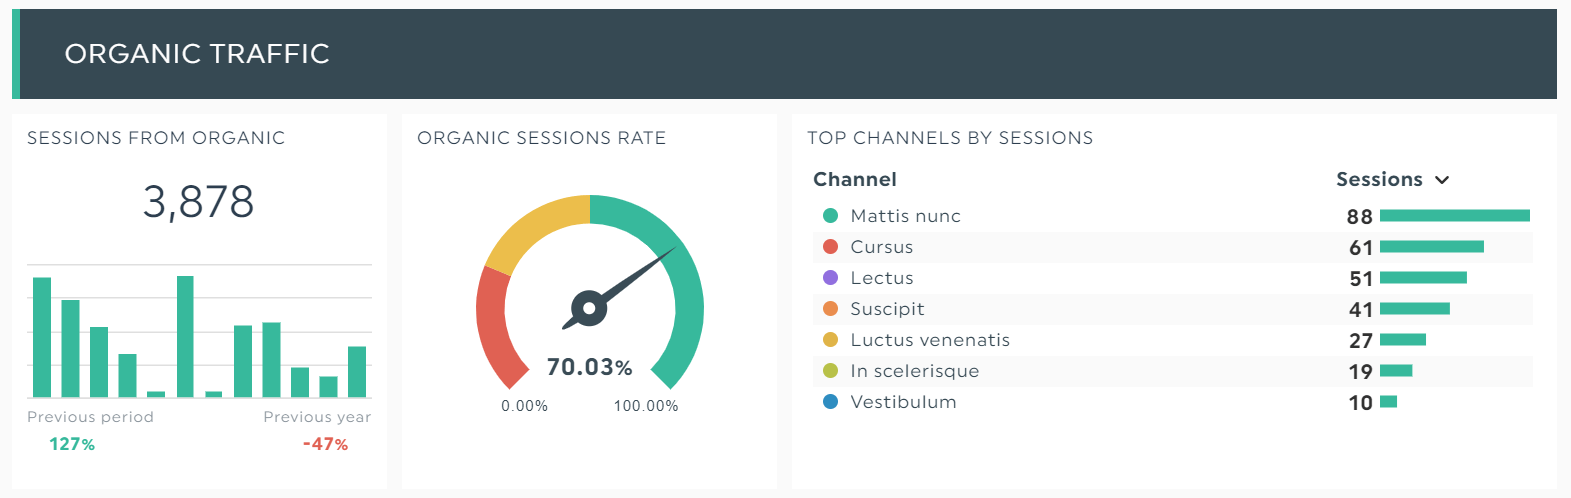
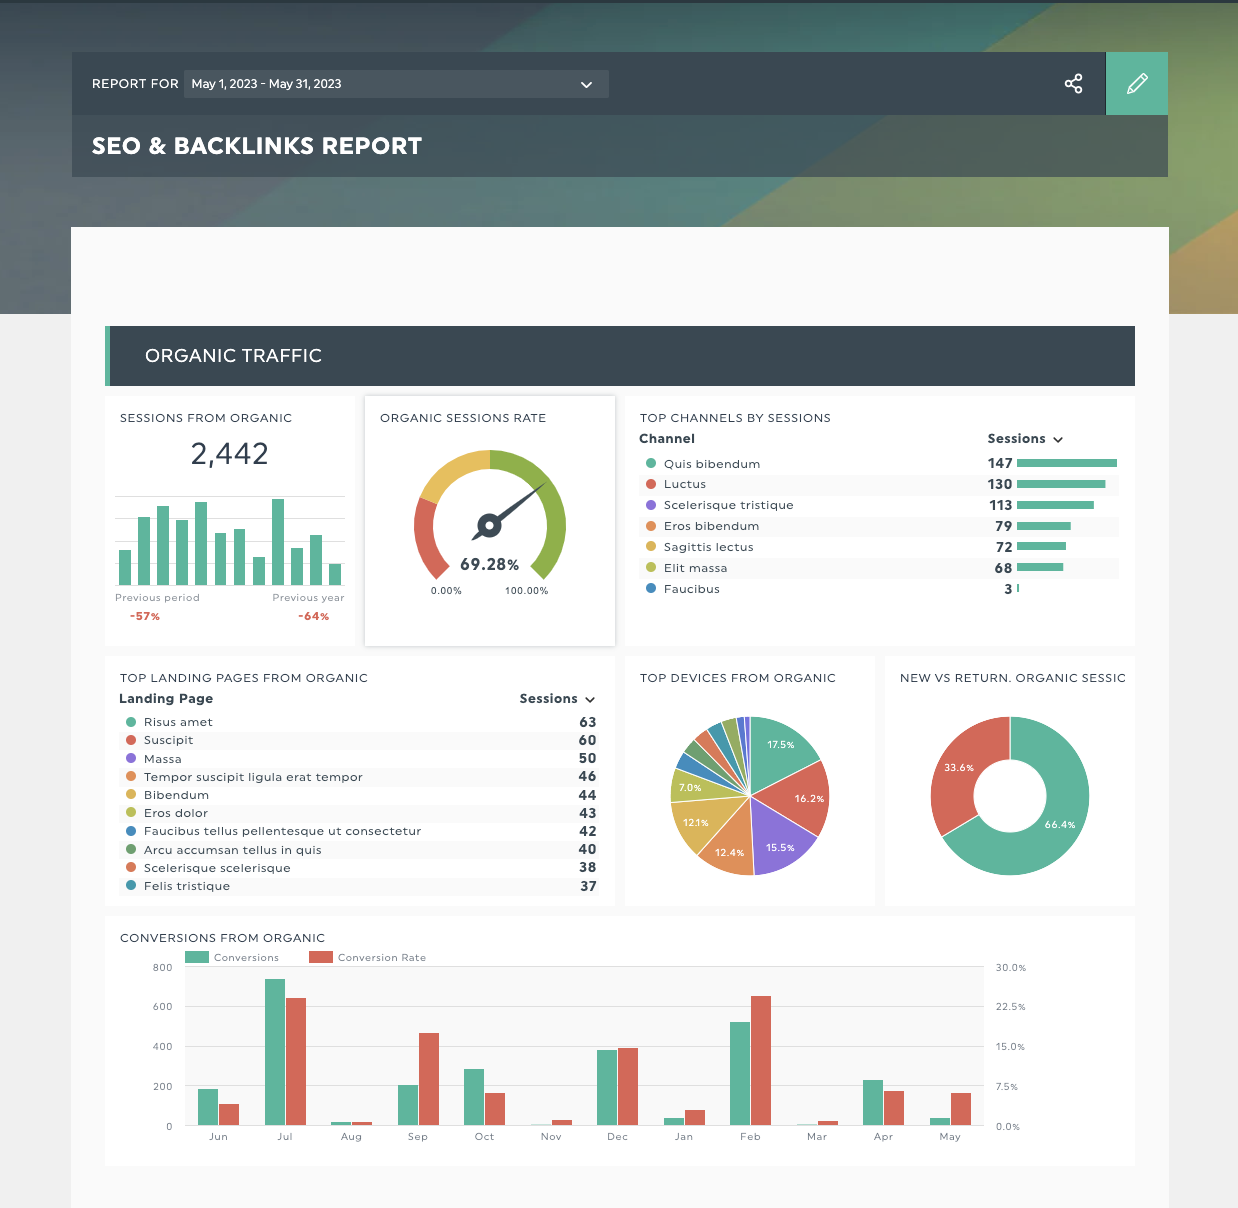
Organic traffic is the number of visitors who land on a website from unpaid search results. It is the foundation metric for SEO and the single best indicator of search performance over time.
Track total organic sessions month over month and year over year. Year over year matters most because SEO is seasonal in nearly every industry. A 12 percent drop in March looks alarming until you compare it to the same drop in March last year.
Where to find it: GA4, under Reports > Acquisition > Traffic acquisition, filtered to "Organic Search". Dashthis to track it overtime in one SEO report.
Healthy benchmark: Steady growth quarter over quarter. Sudden drops over 15 percent warrant investigation.
2. Keyword rankings
Keyword rankings show where pages appear in search results for specific queries. Rankings still matter, but only when grouped by intent and tracked alongside traffic. A page that drops from position 4 to 7 for a high intent keyword is a real problem. A drop from 47 to 53 for an irrelevant query is noise.
Group keywords by topic cluster and by funnel stage (top, middle, bottom). Watch the cluster average, not individual movements.
Where to find it: Ahrefs, Semrush, or Google Search Console for organic position data. Dashthis to track it overtime in one SEO report.
Healthy benchmark: 60 percent or more of tracked keywords in positions 1 to 10 for established sites.
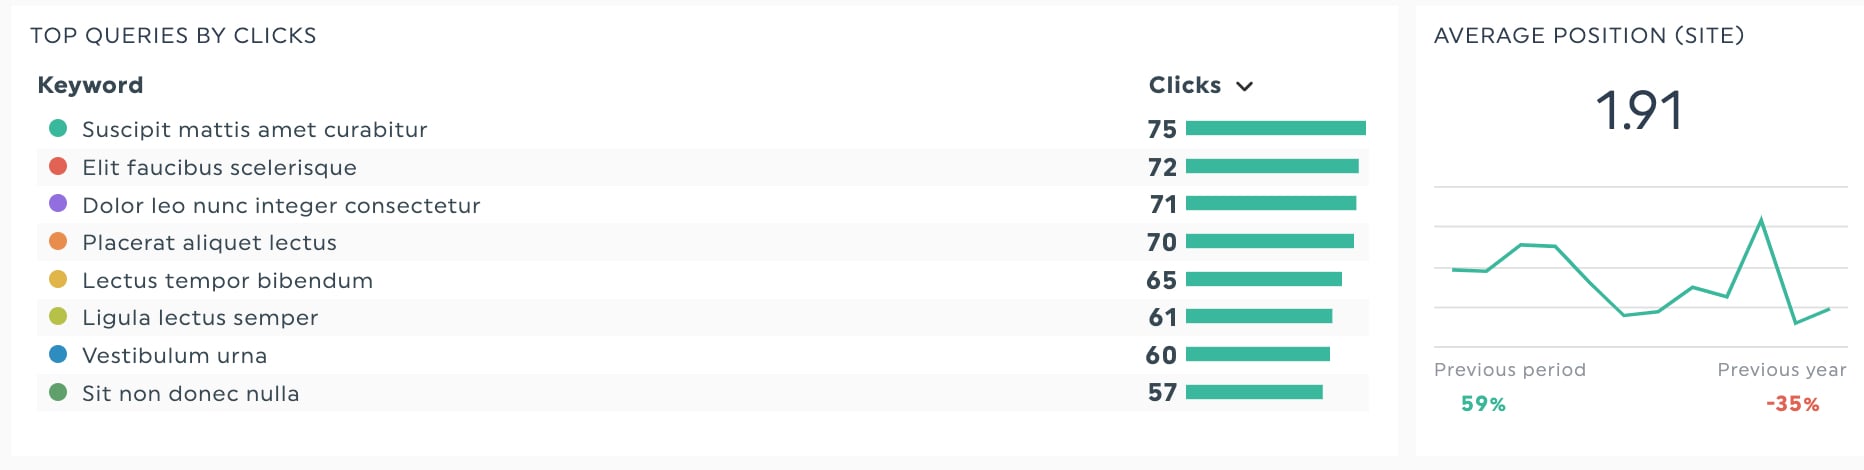
3. Click through rate (CTR)

CTR is the percentage of people who click a result after seeing it in search. The formula is:
CTR = (clicks ÷ impressions) × 100
Average position 1 in Google has a CTR around 27.6 percent, position 5 around 6.5 percent, and position 10 around 2.4 percent (Backlinko, 2024). When a page ranks well but CTR is below the curve, the title tag and meta description are the fix, not the content.
Where to find it: Google Search Console > Performance > Search results.
Healthy benchmark: Compare each page's CTR to the average CTR for its position. Anything more than 30 percent below the curve is a rewrite candidate.
4. Impressions
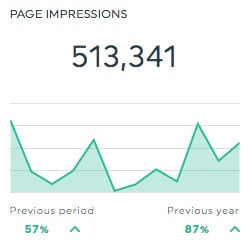
Impressions count how many times a page appears in search results, whether or not anyone clicks. Rising impressions with flat clicks usually means the site is gaining visibility on broader queries but losing the click decision to competitors.
Where to find it: Google Search Console.
Healthy benchmark: Steady growth alongside organic traffic. Diverging impression and click trends signal a CTR problem.
5. Organic conversions and leads
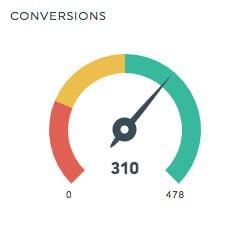
Organic conversions are the actions visitors take after arriving from search: form fills, demo requests, sign ups, purchases. This is the metric that turns SEO from a vanity exercise into a business case.
Track both the volume of conversions and the conversion rate from organic. Segment by landing page so you can see which pages produce leads and which only produce traffic.
Where to find it: GA4 (Engagement > Conversions), HubSpot, or Salesforce when tied to a CRM.
Healthy benchmark: Industry varies. SaaS sites typically see 1 to 3 percent organic conversion rates to free trial; ecommerce hovers around 1.5 to 2.5 percent.
6. Average engagement time
GA4 retired bounce rate as the default engagement metric in 2023 and replaced it with average engagement time, which measures how long the tab was actually in focus. It is a more honest signal of whether content held attention.
Where to find it: GA4 > Reports > Engagement > Pages and screens.
Healthy benchmark: 40 to 60 seconds for short reads, 2 minutes or more for long form guides.
7. Core Web Vitals (LCP, INP, CLS)
Core Web Vitals are Google's three performance metrics for page experience:
- Largest Contentful Paint (LCP) measures loading speed. Target under 2.5 seconds.
- Interaction to Next Paint (INP) measures responsiveness. Target under 200 milliseconds. INP replaced First Input Delay in March 2024.
- Cumulative Layout Shift (CLS) measures visual stability. Target under 0.1.
Pages failing Core Web Vitals lose rankings, especially on mobile.
Where to find it: Google Search Console > Experience > Core Web Vitals, or PageSpeed Insights for page level diagnostics.
Healthy benchmark: All three in the "Good" range on at least 75 percent of pageviews.
8. Referring domains and backlinks
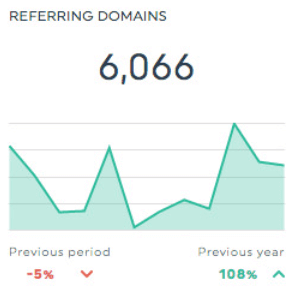
A referring domain is a unique website that links to a target site. Referring domains are a stronger authority signal than raw backlink counts because 100 links from one site count less than 10 links from 10 sites.
Where to find it: Ahrefs Site Explorer, Majestic, or Moz.
Healthy benchmark: Steady growth in referring domains. Lost links should be investigated, since broken backlinks are often easy to reclaim.
9. Indexed pages
Indexed pages are the URLs Google has added to its index and can show in search results. When indexed pages drop suddenly, something is blocking crawl: a noindex tag, a robots.txt error, or a canonical issue.
Where to find it: Google Search Console > Indexing > Pages.
Healthy benchmark: Indexed page count should match the number of pages intended to rank. Large gaps point to technical issues.
10. SERP feature visibility
SERP features are the elements Google adds to search results beyond the standard ten blue links: featured snippets, People Also Ask, image packs, video carousels, and AI Overviews. Owning a featured snippet can double a page's CTR.
Where to find it: Ahrefs and Semrush both track SERP feature ownership.
Healthy benchmark: Track the count of SERP features owned month over month. Set targets for high intent keywords.
11. Branded vs non branded traffic
Branded queries include the brand name (for example, "dashthis dashboards"). Non branded queries do not. The ratio matters: a healthy site grows non branded traffic faster than branded, because non branded traffic is net new awareness rather than existing demand.
Where to find it: Google Search Console > Performance, filtered by query containing the brand name.
Healthy benchmark: Non branded share growing quarter over quarter. A site where 80 percent of organic traffic is branded has not yet built true SEO authority.
12. AI search visibility
AI search visibility tracks how often a brand is cited in AI generated answers from ChatGPT, Perplexity, Google AI Overviews, and Claude. By early 2026, an estimated 25 percent of search journeys touch an AI answer engine at some point, which means traditional rank tracking only tells part of the story. The relevant data points are:
- Mentions: how often the brand is named in AI answers
- Citations: how often the brand's pages are linked as a source
- Share of voice: mentions relative to direct competitors
Where to find it: Ahrefs Brand Radar, Profound, Otterly, or Athena HQ.
Healthy benchmark: Citation and mention growth month over month, with a citation rate matching or exceeding key competitors.
How to build an SEO dashboard that actually gets used
The SEO metrics above live in six different tools by default: GA4, Google Search Console, Ahrefs, PageSpeed Insights, a CRM, and an AI visibility tracker. Most marketers spend two hours building each monthly report by copying and pasting into a spreadsheet.
A unified SEO reporting software pulls every metric into one place, refreshes automatically, and turns the monthly two hour ritual into a five minute review. It also exposes patterns that get lost in tab switching: when organic traffic drops the same week Core Web Vitals fail, the dashboard surfaces both at once.
DashThis connects to GA4, Google Search Console, Ahrefs, Semrush, and 30+ other SEO and marketing tools to combine all the metrics in this article into a single, white labelled report. Agencies use it to deliver client ready reports without the manual work.
Try DashThis free for 15 days and pull all your most important SEO metric into one dashboard
Frequently asked questions


