10 crucial e-commerce KPI examples to track your growth, marketing success and retention

Key performance indicators (KPIs).
Whether they spark thoughts of an upcoming performance review or remind you that a client report is due end-of-day Friday, you’ll be shooting in the dark without proper KPIs.
It’s tricky to measure footfall at your brick-and-motor store. Still, with the right e-commerce KPIs, you can track how many people visited your online store, how much money customers spent on average, and how many people left your online business buying nothing.
Besides the vital e-commerce metrics like conversion rates, which KPIs should you measure for your (or your client’s) e-commerce store? Find out in this guide.
What are e-commerce KPIs?
Get your e-commerce KPI report template with your own data!
Just like how you have KPIs to measure your performance, e-commerce KPIs are essential metrics that track and summarize your progress toward specified business goals. They help you answer critical questions and make the right decisions for your business.
For example, which digital marketing channels or campaigns should you invest in? Compare your traffic KPIs, like the total number of visitors, to assess which channels attract the most website visitors who eventually convert.
Do we need to adjust our pricing, or where’s that average order value sweet spot ripe for a discount code or a promotional campaign? Look at your sales KPIs to make data-driven business decisions like these.
How to choose the right e-commerce KPIs for your business
Step 1: Define your business objectives
E-commerce KPIs are like guardrails - they ensure every action you take focuses on moving towards a specific business aim. Without these guardrails, it’s easier to wander off and allocate time, a growing amount of money, and resources toward actions that don’t result in progress.
But to build the proper guardrails, you need to know where you’re going first, which involves setting business goals. This is why goal setting is one of the greatest challenges when creating an eCommerce business—it’s hard to visualize where you want to end up.
First, ask yourself what you want to focus on in the next 3-6 months.
Example business goals could be:
- Collecting email sign-ups to grow an email list and drive repeat purchases
- Grow the business bottom line by boosting average order value and running a particular cross-selling and upselling campaign over the holiday period.
- Reduce abandoned cart rate by reviewing your checkout flow and user experience.
- Attract more paying customers with organic marketing and search engine optimization (SEO) efforts.
- Improve customer loyalty and increase the total number of repeat customers with a loyalty program.
Step 2: Link your KPIs to these goals
Once you’re clear on your business goals, think about the right KPIs to use to measure progress toward these goals. In this step, you’ll turn big-picture business goals into operational metrics.
Good KPIs apply to the business goal, and you can establish a clear cause-and-effect between an action and the KPI. Here’s how the above business goals might look with their most important KPIs attached:
- Collecting email subscription KPIs: email subscriber growth rate, unsubscribe rate, email forwarding rate
- Boost average order value (AOV) - AOV, conversion rate on upselling/cross-selling button prompts or landing page call-to-actions
- Attract more qualified traffic to your product pages - track SEO ranking and click-through rates (CTR) for specific keywords, organic search traffic.
- Reduce abandoned cart rate: Abandoned cart percentage, number of customers who completed a transaction.
- Improve customer loyalty: Customer lifetime value, new vs. returning customers, customer churn rate
Step 3: Review your KPIs regularly to ensure they’re relevant.
It’s normal for your KPIs to change over time, so it’s worth reviewing them every set period of time (either each quarter or every 6 months) to ensure they still fit your business goals.
For example, a client starting their e-commerce business for the first time might focus on ensuring their site can accept orders and product-market fit.
Over time, as their store has a steady base of customers, shift your focus to tracking e-commerce KPIs that focus on customer retention and marketing efficiency or reducing the cost of customer acquisition.
E-commerce KPIs measuring website traffic
Is your e-commerce website attracting visitors?
These e-commerce KPI examples tell you if your website and marketing strategy are doing their job to grow your site traffic. From there, you can segment your audience into different channels and assess where to invest your resources.
1. Number of visitors
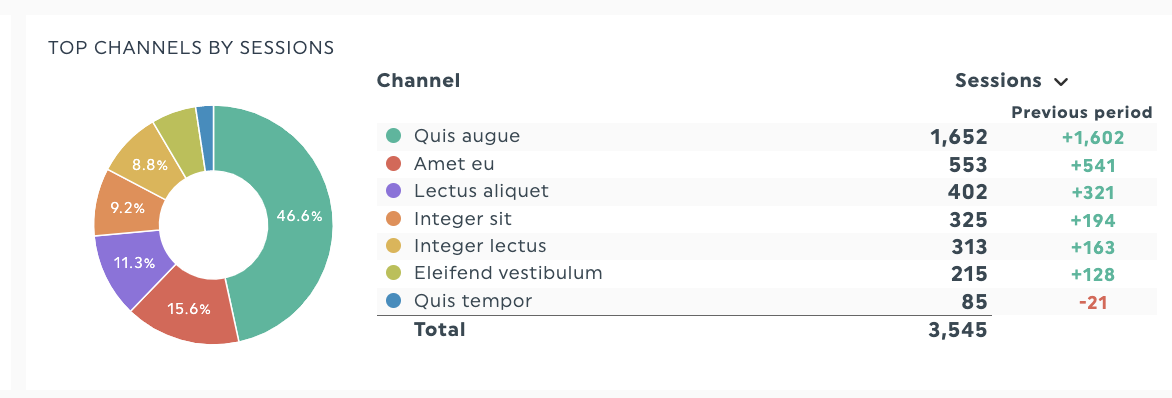
Site visitors must first be aware of you and visit your website before they can become customers. That’s where tracking the number of visitors comes in handy. This metric helps you with two decisions:
Which marketing channels should we invest in more?
Compare your channel traffic numbers to decide whether to invest more in pay-per-click (PPC), social media, or email marketing channels. You can also compare traffic numbers against your number of conversions to see which channel attracts the best customers.
Is there an issue with my checkout flow or audience targeting strategy?
If you’re seeing a high number of visitors but low sales, it’s an early warning that something in your marketing or sales funnel isn’t working as expected.
2. New vs. returning customers
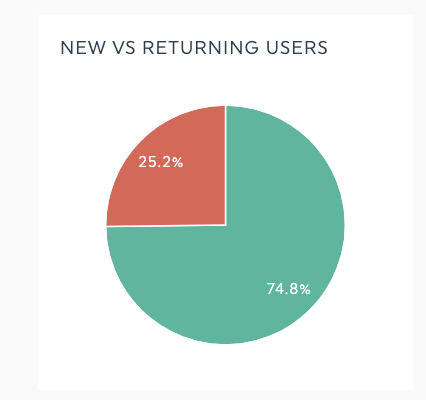
What percentage of your traffic comes from new customers, and how many are returning? With customer acquisition costs rising, reviewing this ratio will help you decide if you need to invest more in customer retention strategies or broaden your marketing efforts to attract new customers.
3. Bounce rate
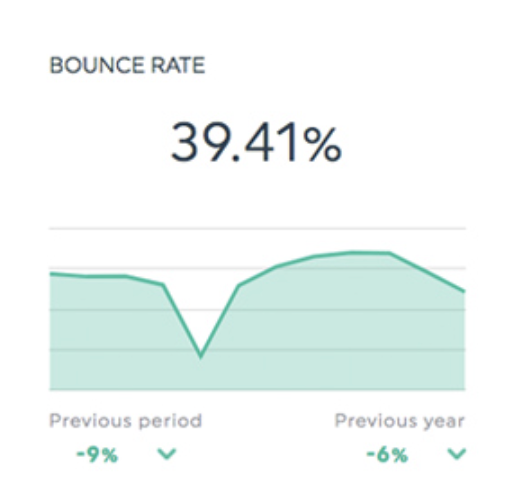
According to Google Analytics 4 reporting definitions, bounce rate measures the percentage of sessions that weren't engaged.
A session counts as engaged if:
- It lasts longer than 10 seconds
- Has a conversion event (someone makes a purchase or adds an item to a cart
- Views at least two pages on the e-commerce website
There will be some bounces, especially on informational pages, where people find what they seek and leave. However, pay attention to bounce rates on conversion-focused pages such as product pages, homepages, or checkout pages.
E-commerce KPIs to track sales
Every e-commerce business relies on sales, from small home-based businesses to multinational brands. The KPIs listed here will help you track your sales performance.
4. Average order value (AOV)
![]()
Average order value refers to the average amount customers spend when ordering. A reflection of your customer’s current buying habits, AOV influences:
- Pricing decisions: Offering discounts, coupons, or free shipping above a certain order value can help boost sales
- Cross-selling/up-selling strategies: Offering a low-cost complementary product to go with a higher value product like socks and running shoes can help increase AOV
AOV values vary across industries, so contextualize any benchmark data to your industry. For example, 2023 data from Dynamic Yield puts the home & furniture industry AOV at $235, whereas the pet care industry had the lowest AOV at $63.
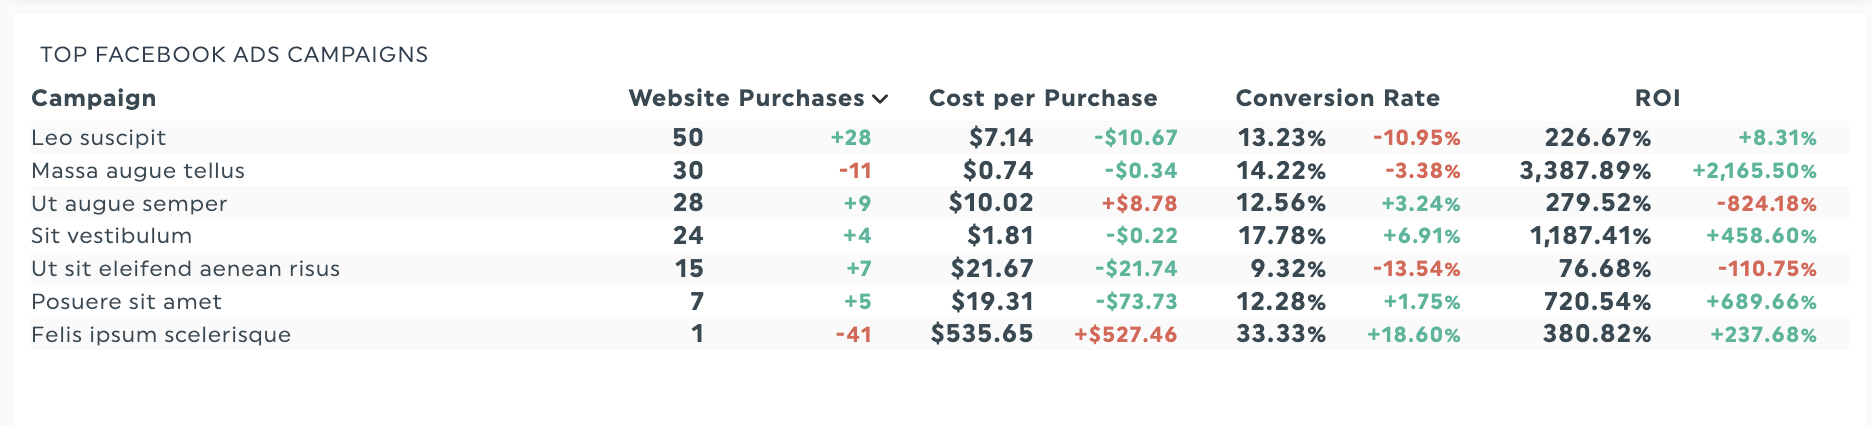
5. Conversion rate
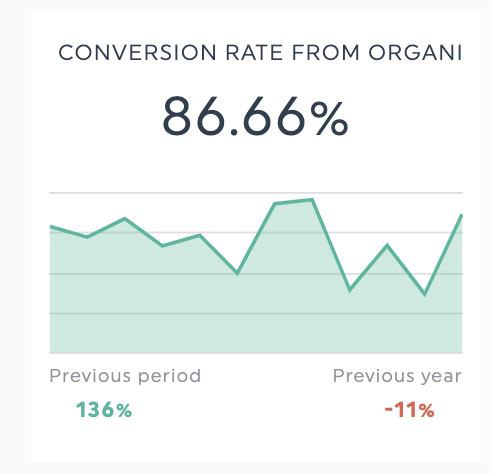
One of the most important e-commerce KPIs is the conversion rate, which measures the percentage of visitors who complete a purchase on your website.
A high conversion rate indicates that your website effectively attracts and persuades customers to buy your products or services. To optimize your conversion rate, you must analyze various factors influencing customer behavior, such as traffic sources, landing pages, product pages, checkout processes, etc.
A cloud business intelligence tool can help you collect, integrate, and visualize data from different sources and platforms and provide you with actionable insights to improve your e-commerce performance.
Conversion rates in e-commerce answer two questions:
- Are people buying my products?
- Does a view on my product page or an add-to-cart result in a transaction?
Besides the average conversion rate, it’s worth comparing your conversion rates across these dimensions for a more nuanced picture on your e-commerce performance.
- Region: Understand where your high-value customers live for geo-targeted campaigns
- Seasonality: Compare conversion rates over time to see popular or slower months
- Channel: Know where your visitors who are more likely to make a purchase come from.
- Device: See where people make purchases more often
In DashThis, track this as Session Conversion Rate straight from your Shopify integration, calculated on real orders.
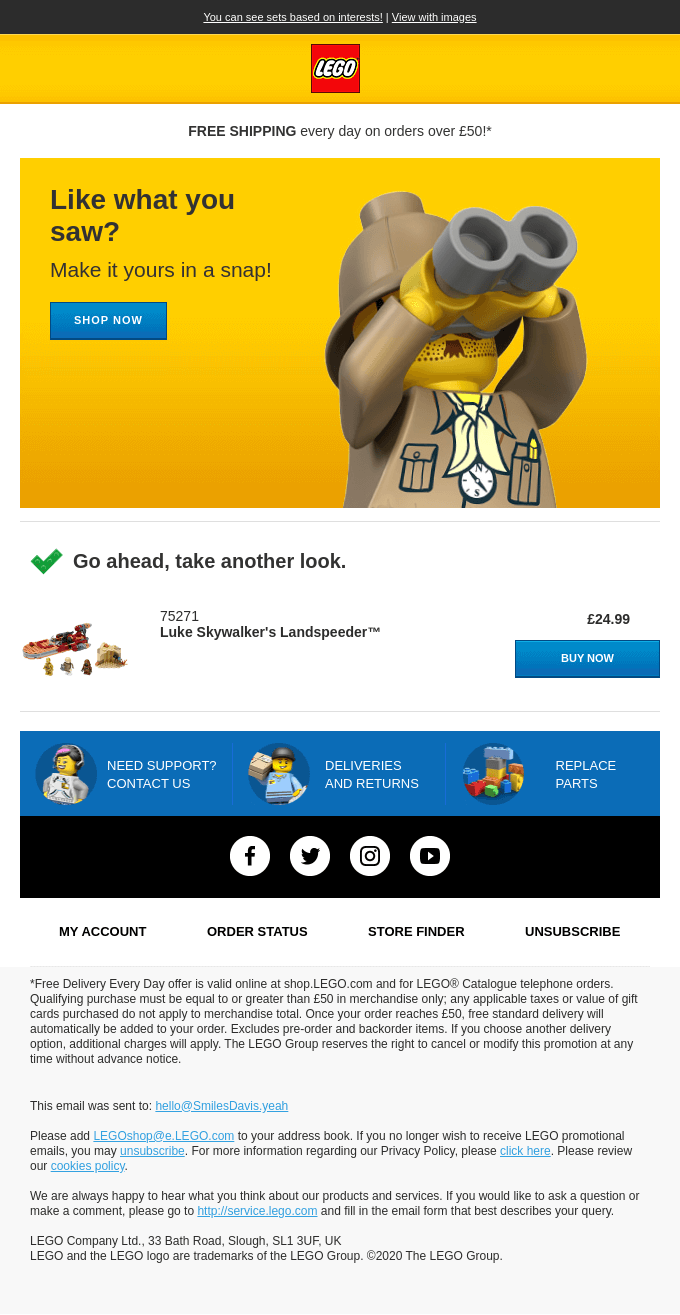
6. Shopping cart abandonment rate
Cart abandonment rate refers to the percentage of people who added items to their cart without checking out.
While you’ll expect a certain percentage of cart abandonment from people shopping around who aren’t ready to buy, a too-high value might suggest an issue with your checkout process.
Besides reviewing your checkout process, brands have also gotten creative with their emails to help inspire leads to buy from them. Here’s a powerful abandoned cart email example from Lego reminding the person about the item left behind—while providing a sweet free shipping offer as incentive to complete their purchase.
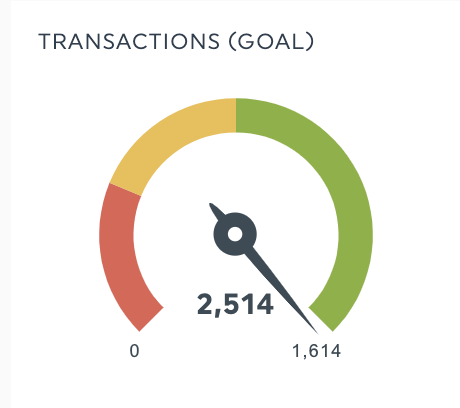
7. Number of orders
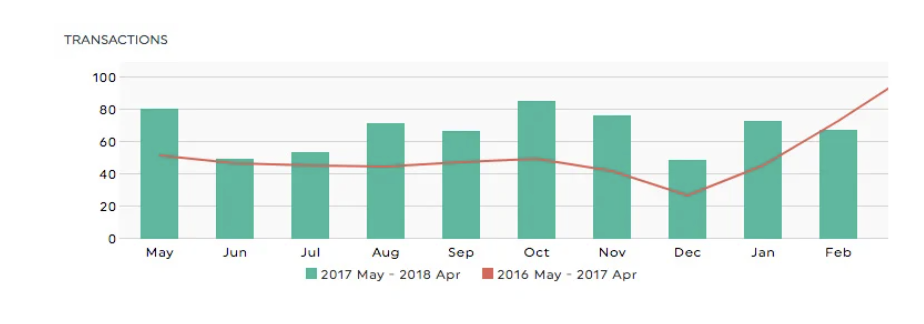
This KPI helps you see order trends over time to forecast inventory or plan a marketing campaign to increase orders during slower months—cross-reference the number of orders with top products to get further clarity on opportunities to improve sales.
Tip: Use DashThis to track Total Orders from your Shopify integration as a goal to see if you're on track.
8. Customer acquisition cost (CAC)
Getting a sale is outstanding. But spending less money in marketing costs to get that sale - even better!
Keep a close eye on how much you’re spending to get new customers by tracking the total cost of customer acquisition during a specific time, including ad spend, software subscription costs, etc. Compare marketing channels and your acquisition costs to determine which marketing channel works best for you.
9. Top products
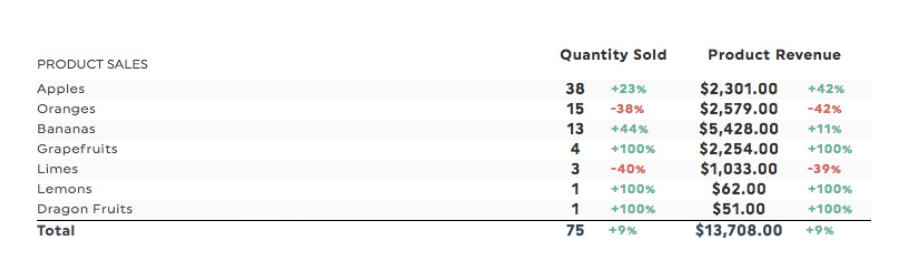
Which products are selling well? More importantly, what’s my total revenue, or what does my profit margin look like?
Mark Alexander Clement Andersen, the owner of the e-commerce store Cosina, also uses this metric to get clarity of his total revenue against the cost of goods sold.
Most e-commerce stores have different brands and suppliers. This means some products are sold at a low margin and others at a high margin. Therefore, you need to push the most profitable products on your e-commerce site, organically or through paid marketing. By setting up this metric in your sales dashboard, you will know if you are turning over the right products.
Break Net Sales and Total Orders down by Product Title and Product Type with the Shopify integration.
E-commerce KPIs for customer satisfaction
Returning customers are likelier to purchase more often and spend more in each order than new ones. Providing a great customer experience is essential for encouraging happier customers to return. That’s where metrics like CLV and net promoter score (NPS) come in to measure customer satisfaction.
10. Customer lifetime value (CLV)
Customer lifetime value shows how much you earn from a customer over time and can make retention and targeting decisions.
Returning customers purchase more compared to new customers. With your CLV data, it’s easier to find and focus on your highest-spending customers or identify opportunities to improve your customer experience to encourage them to return for a repeat purchase.
CLV calculation: Average order value*customer visits/year* average time spent with your company over time.
Track your essential e-commerce KPIs with DashThis
Here’s how to do it with DashThis in 4 easy steps:
- Sign up for your 15-day free trial of DashThis
- Our Shopify integration pulls your sales, orders, and customer data straight from your store, and pairs with Google Analytics so you get a complete overview of your e-commerce performance.
- Select your metrics from DashThis’ preset widgets
- Drag and drop the metrics as you desire to create a cohesive look in your report. Add/remove metrics, switch chart types around and customize your report as you see fit. Once done, share your report with your client or team in a few clicks!
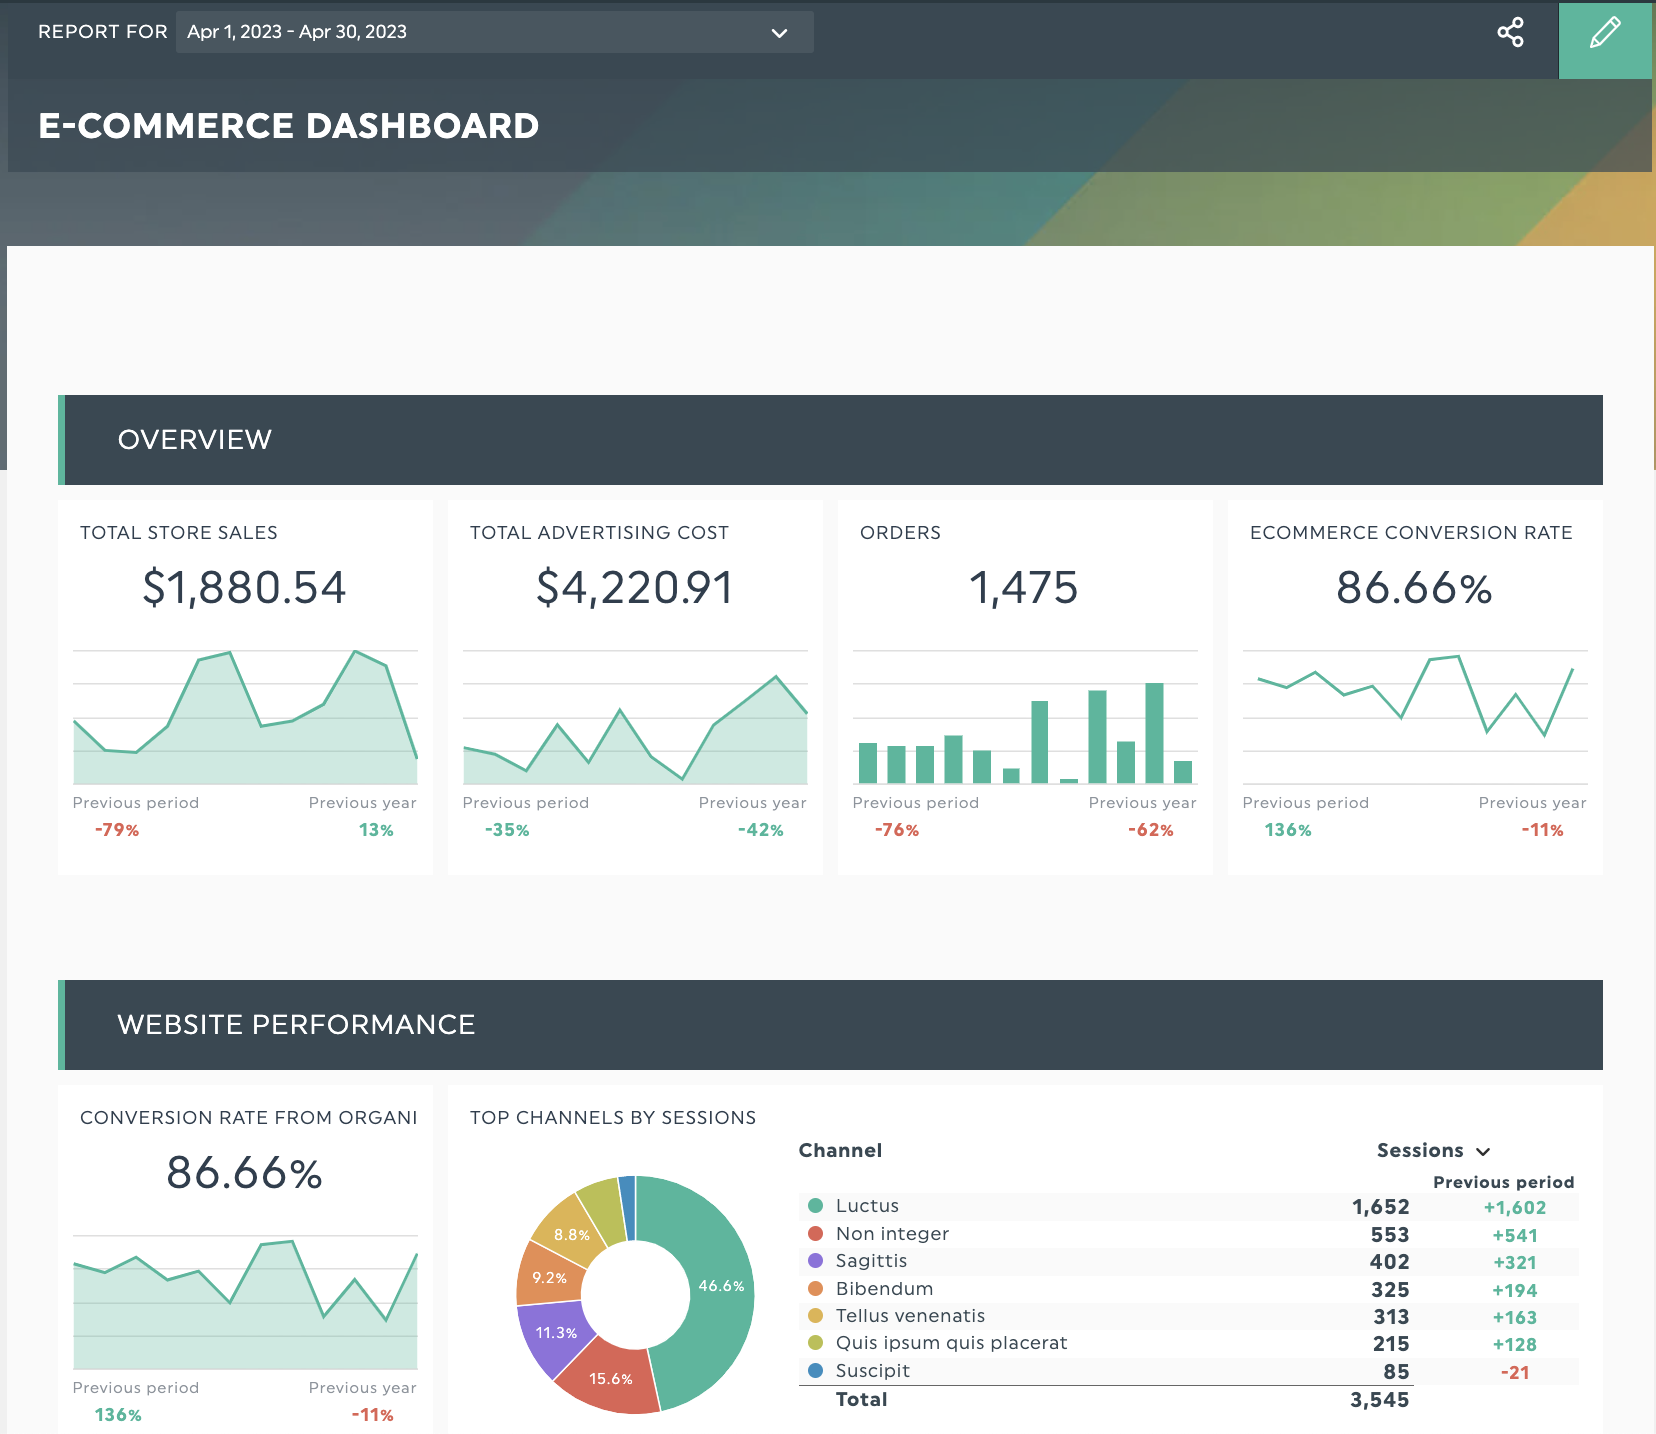
Template spotlight: e-Commerce report template
Get your e-commerce report template with your own data!
Our e-commerce report gives you everything you need to track the performance of your e-commerce clients (or businesses). With a few clicks, you get an easily customizable report tracking your total sales, conversion rate, traffic by channel and so much more.
If you’re struggling to get your data in one place, use our template to help you skip the tedious bits so you can focus on interpreting your data and draw the conclusions you need for your clients to take their business to the next level.
Track and report on your e-commerce KPIs in one place
Whether you have an online retailer client or running your own online store, making informed decisions with the right data is essential. Save hours collating your data from different platforms with reporting software like DashThis.
Sign up for your free 15-day trial of DashThis today
Track all your ecommerce KPIs in one easy-to-use, good-looking dashboard!

Ready to track your eCommerce KPIs?
Read More

Don’t miss out!
Follow us on social media to stay tuned!
Automate your reports!
Bring all your marketing data into one automated report.
Try dashthis for free