20+ Essential Ecommerce Metrics for Your Reporting Dashboard

New: Many of the sales and customer metrics in this guide can now be pulled directly from your store with the DashThis Shopify integration. Look for the "Track this in DashThis" notes below!
This post was first written by Mark from Cosina.dk but was refreshed in 2026 refreshed to include more metrics.
Ecommerce metrics are quantifiable data points that measure the performance of an online store across sales, marketing, and customer experience. Tracking these ecommerce KPIs gives ecommerce teams a clear, real-time view of what is working, where revenue is leaking, and which activities deserve more investment.
After four years of running the b2b ecommerce store cosina.dk I know the importance of tracking and understanding the most essential ecommerce metrics, particularely for ecommerce retailers. Without this data, I wouldn't know if we're on track to achieve our company goals and I definitely wouldn't know which marketing activities are creating value and which are not.
This guide covers 20+ essential ecommerce performance metrics to include in any reporting dashboard, from total revenue and conversion rate to ROAS, customer retention rate, and net promoter score. Let's dive in.
| Category | Ecommerce Metrics Covered |
|---|---|
| Sales metrics | Total revenue - number of transactions - average order value - conversion rate - cart abandonment rate - top performing products - ROAS - return/refund rate - revenue per visitor - gross margin |
| Digital marketing metrics | Total traffic - traffic sources - organic keywords - customer acquisition cost - customer lifetime value - engagement rate - email campaign metrics - mobile conversion rate |
| Customer metrics | Customer retention rate - number of repeat customers - net promoter score (NPS) |
What are ecommerce metrics?
Ecommerce metrics are specific, measurable values that track the performance of an online store. They cover every stage of the customer journey, from a visitor landing on a product page to completing a purchase and returning to buy again. Ecommerce teams use these metrics to set goals, identify underperforming areas, justify marketing spend, and report results to stakeholders.
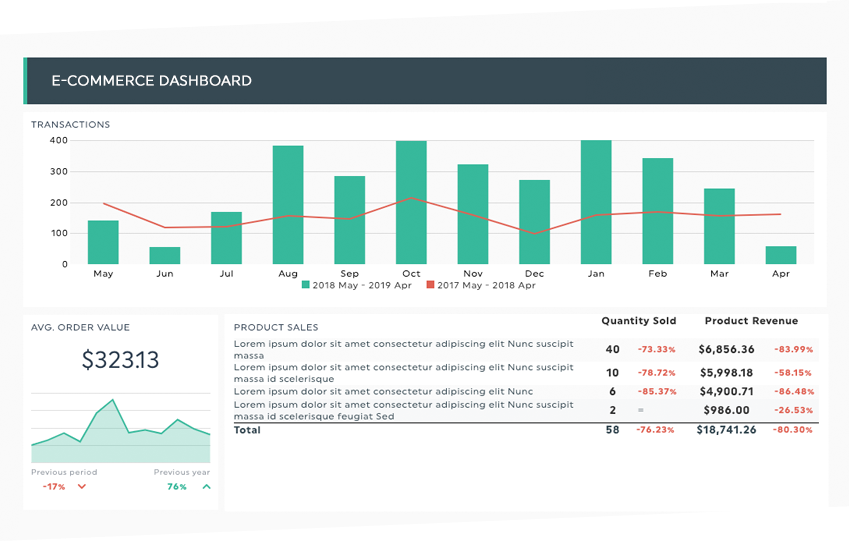
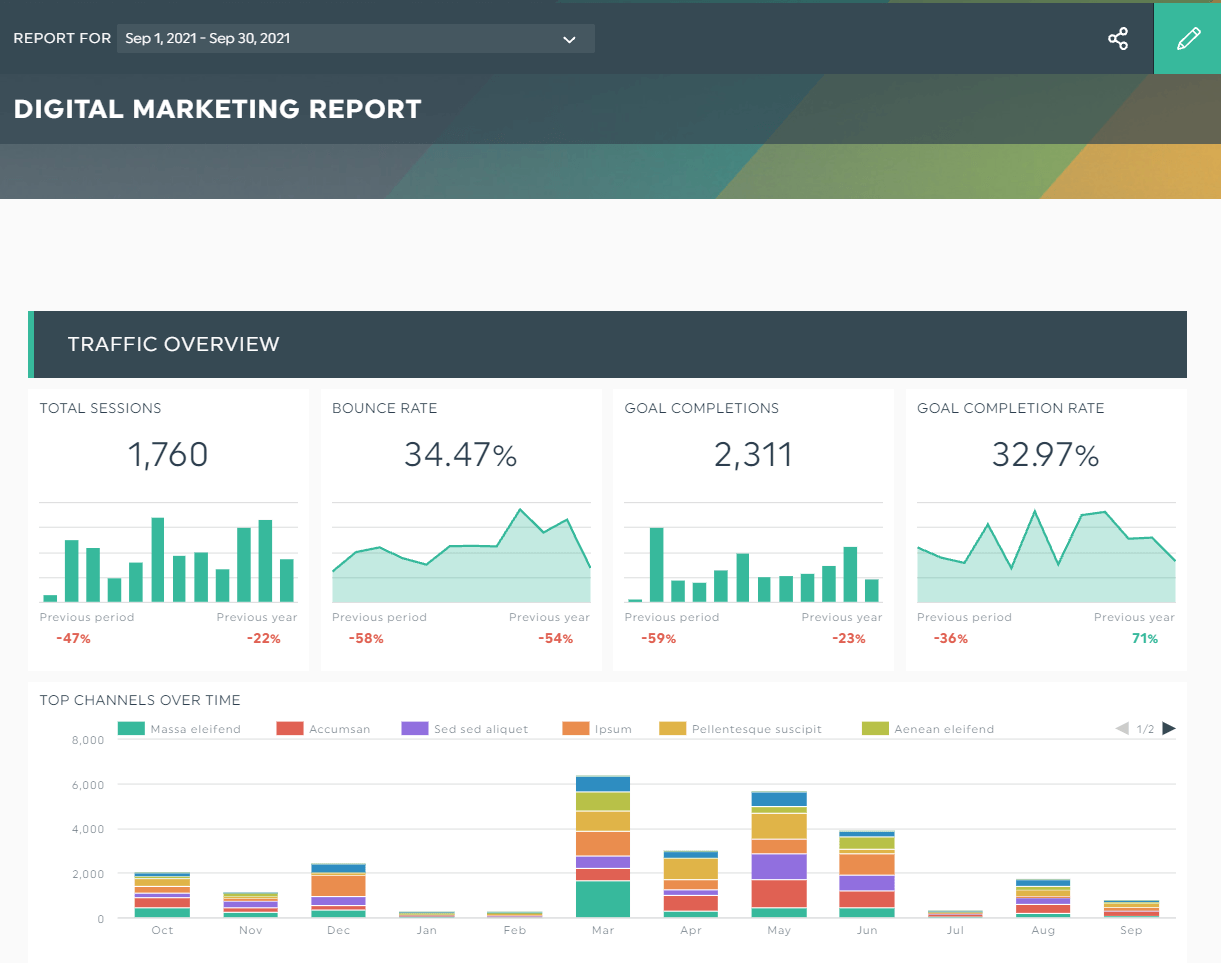
Get this e-commerce report with your own data.
The difference between ecommerce metrics and ecommerce KPIs (Key Performance Indicators) is simple: metrics are raw data points that measure specific activities, while KPIs are the subset of metrics tied to a specific business goal. Not all metrics are KPIs, but all KPIs are metrics. The metrics in this guide are the ones most commonly used as KPIs by high-performing ecommerce teams.
Ecommerce sales metrics: revenue, transactions, and conversion
Sales metrics are data points that directly or indirectly measure your store's ability to generate revenue. Ecommerce sales metrics help you evaluate your online visibility, product pages, checkout process, and pricing strategy. They are the foundation of any ecommerce reporting dashboard.
1. Total revenue
Total revenue is the sum of all income generated from online sales in a given period, before any deductions. It is the top-line figure that tells you whether your store is trending in the right direction against annual revenue goals.
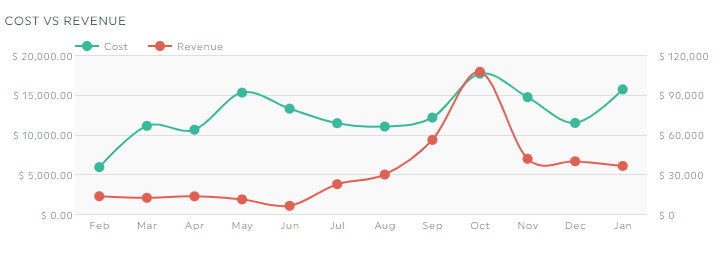
Total revenue alone does not tell the full story. Track it alongside your costs to understand whether growth is actually improving profitability. Revenue that costs twice as much to generate is not automatically a win. Total revenue is automatically available in Google Analytics when ecommerce tracking is configured.
Track this in DashThis: Pull total revenue straight from your Shopify integration for an exact, transaction-level figure, or from Google Analytics ecommerce tracking.
2. Number of transactions
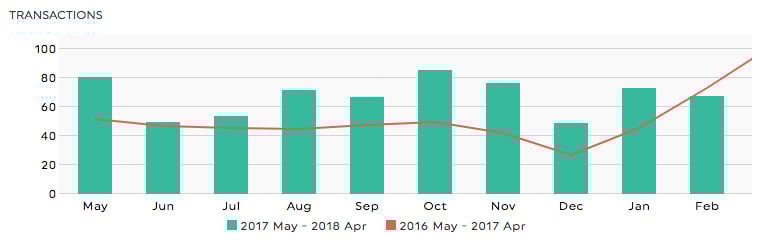
Number of transactions is the total count of completed purchases in a given period. It is a leading indicator of customer acquisition and retention success, and is available directly from Google Analytics ecommerce tracking.
Growing transaction volume shows that your store is bringing in more buyers, whether new or returning. Monitor this metric alongside average order value so you can tell whether revenue growth is driven by more orders, higher-value orders, or both.
3. Average order value (AOV)
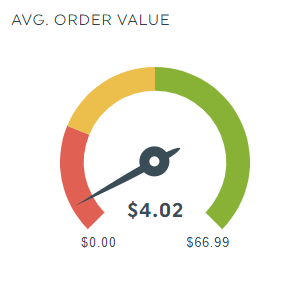
Average order value (AOV) is the mean revenue generated per completed transaction. It is calculated as: Total Revenue / Number of Orders = AOV.
AOV is one of the most actionable ecommerce performance metrics because it can be improved directly through upselling, cross-selling, product bundling, and free shipping thresholds. A rising transaction count with a falling AOV may indicate that customers are buying cheaper products or splitting orders, so always monitor both together.
Benchmark: AOV varies significantly by industry. Track your own 90-day trend as your primary benchmark, and use previous periods as comparison points.
Track this in DashThis: AOV is a native metric in the Shopify integration, so it updates automatically with no manual calculation. It's also available via Google Analytics.
4. Conversion rate
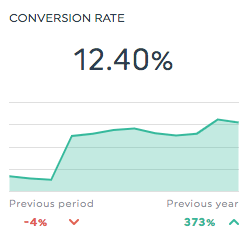
Conversion rate is the percentage of website sessions that result in a completed purchase. Formula: (Number of Transactions / Total Sessions) x 100 = Conversion Rate.
Conversion rate is one of the most important ecommerce KPIs because improving it allows you to generate more revenue from your existing traffic without increasing ad spend. Track your overall conversion rate and break it down by traffic channel so you can identify which sources bring in high-intent visitors and which need work.
Benchmark: The average ecommerce conversion rate is between 1% and 4%. Rates above 4% are considered strong. Conversion rate varies significantly by industry, traffic source, and device type.
Track this in DashThis: Use Session Conversion Rate from your Shopify integration to see the percentage of store sessions that ended in a purchase, calculated on real order data. Also available via Google Analytics.
5. Cart abandonment rate
Cart abandonment rate is the percentage of shoppers who add items to their cart but leave without completing a purchase. Formula: 1 - (Completed Transactions / Cart Initiations) x 100 = Cart Abandonment Rate.
A high cart abandonment rate often signals problems in the checkout experience: unexpected shipping costs, a complicated checkout flow, missing payment options, or unclear return policies. Reducing cart abandonment is one of the highest-ROI optimisation activities available to ecommerce teams because the intent to purchase is already there.
Benchmark: The average cart abandonment rate across ecommerce is approximately 70%. Anything below 60% is excellent.
Track this in DashThis: Cart abandonment data flows in from your Google Analytics ecommerce setup.
6. Top performing products
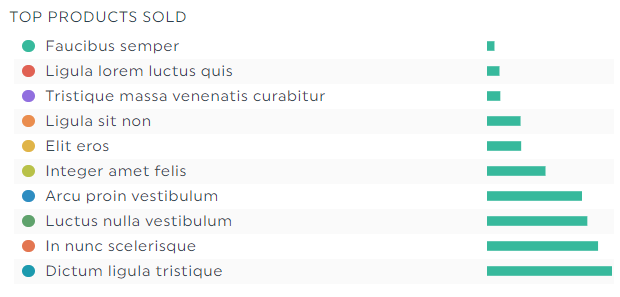
Top performing products is a ranked view of your best-selling items by revenue or units sold in a given period. It is a critical ecommerce metric for stores that carry multiple brands or product categories with different margin profiles.
Tracking your top products weekly or monthly shows whether your highest-margin products are driving sales or being crowded out by lower-margin items. Use this metric to guide promotional decisions, ad spend allocation, and inventory planning.
7. ROAS (Return on Ad Spend)
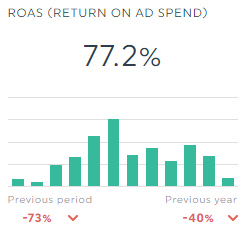
ROAS (Return on Ad Spend) is the revenue generated for every dollar spent on advertising. Formula: Revenue from Ads / Ad Spend = ROAS. A ROAS of 4 means you are earning $4 in revenue for every $1 spent.
ROAS is the number one paid media metric for ecommerce teams. It lets you compare performance across channels, campaigns, and ad sets, and tells you whether your paid investment is paying off. ROAS should always be read alongside gross margin, because high ROAS on low-margin products may not be profitable.
Track this in DashThis: Connect Google Ads and Facebook Ads to see ROAS across all paid channels in one dashboard.
8. Return and refund rate
Return and refund rate is the percentage of orders returned or refunded in a given period. Formula: (Number of Returns / Total Orders) x 100 = Return Rate.
Return rate is a core profitability signal that often goes untracked until it becomes a problem. A rising return rate may indicate product quality issues, misleading product descriptions, sizing problems, or fulfillment errors. Tracking it monthly helps you catch problems early and take action before returns erode margin.
Track this in DashThis: Combine the Returns and Total Orders metrics from your Shopify integration to track return rate over time, directly from your store's order data.
9. Revenue per visitor (RPV)
Revenue per visitor (RPV) is the average revenue generated by each unique visitor to your store. Formula: Total Revenue / Total Visitors = RPV.
RPV combines traffic volume and conversion efficiency into a single metric. It is especially useful when comparing traffic sources, because a channel that sends fewer but higher-intent visitors may deliver a much higher RPV than a high-volume channel with poor conversion. Use RPV to evaluate the quality of traffic, not just the quantity.
Track this in DashThis: Divide Net Sales by Online Store Sessions using your Shopify integration to calculate RPV on real store data, and compare it by Traffic Source Name to judge traffic quality.
10. Gross margin
Gross margin is the percentage of revenue remaining after subtracting the cost of goods sold (COGS). Formula: (Revenue - COGS) / Revenue x 100 = Gross Margin.
Gross margin tells you whether your business is financially healthy beyond top-line revenue. An ecommerce store can show strong revenue growth while its gross margin shrinks due to rising supplier costs, higher discounting, or a shift toward lower-margin products. Tracking gross margin monthly ensures that revenue growth is also profit-healthy growth.
Digital marketing metrics: traffic, acquisition, and retention
Digital marketing metrics measure the performance of the activities that drive traffic to your store and convert that traffic into customers. These ecommerce KPIs help you evaluate paid campaigns, SEO performance, email marketing, and your overall ability to attract and retain buyers.
11. Total traffic (users and sessions)
Total traffic is the total number of visitors (users) and sessions on your website in a given period. It is the top of your sales funnel and the starting point for understanding your store's visibility and reach.
Total traffic is a long-term health indicator. Month-over-month and year-over-year traffic trends show whether your acquisition channels are growing or contracting. Track both users (unique visitors) and sessions (total visits), as repeat visits from the same user can signal high intent or interest.
Track this in DashThis: Track Online Store Sessions and Page Views from your Shopify integration for store-level traffic, or use Google Analytics for full cross-site reporting.
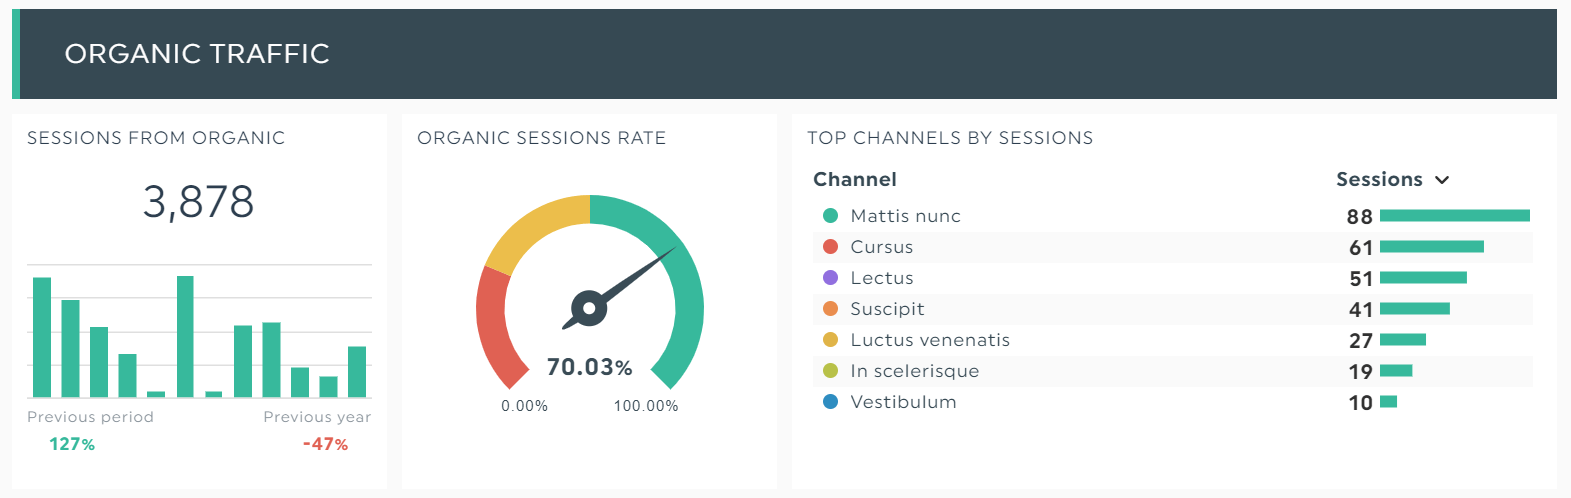
12. Traffic sources
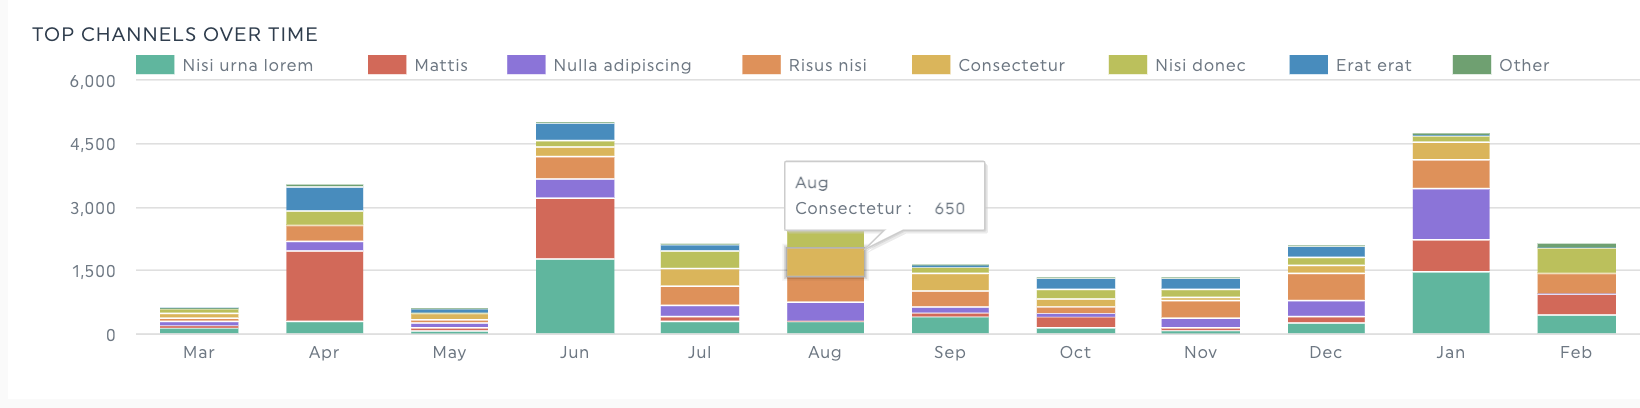
Traffic sources is a breakdown of where your website visitors come from, including organic search, paid search, direct, referral, social, and email channels.
Not all traffic sources are equally valuable. Organic search visitors are typically high-intent and cost-effective over time. Paid search visitors convert quickly but require ongoing spend. Understanding your traffic mix helps you allocate marketing budget more effectively and identify channels that are underperforming relative to investment.
Track this in DashThis: Use the Traffic Source Name, Referrer Site, and Sales Channel dimensions in your Shopify integration to see exactly where buyers come from, then compare against Google Analytics channel data.
13. Number of top organic keywords
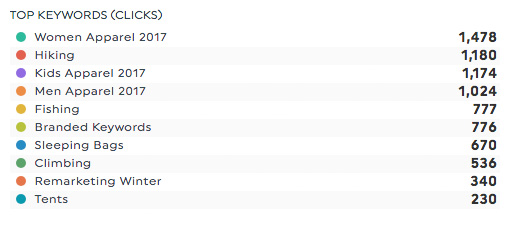
Organic keyword ranking tracks how many of your target keywords appear in the top 3, top 5, or top 10 positions on Google. For most ecommerce stores, organic search is the most cost-effective traffic source at scale.
Monitoring your share of top-ranking keywords gives you a measurable view of SEO progress. It also helps you identify product or category pages that are ranking but not converting, or pages that are close to the first page and could benefit from targeted optimisation.
Track this in DashThis: Connect your rank tracking tool to DashThis to monitor keyword positions alongside traffic and conversion data.
14. Customer acquisition cost (CAC)

Customer acquisition cost (CAC) is the total cost of acquiring one new customer through a specific channel. Formula: Total Marketing Spend on a Channel / Total Customers Acquired from that Channel = CAC.
CAC is one of the most important ecommerce performance metrics for evaluating the efficiency of your paid marketing. It should always be tracked against customer lifetime value. If your CAC approaches or exceeds your CLV, your acquisition model is not sustainable. A healthy target is a CLV that is at least three times your CAC.
Track this in DashThis: Combine cost data from Google Ads and Facebook Ads with conversion data from Google Analytics to calculate CAC automatically.
15. Customer lifetime value (CLV)
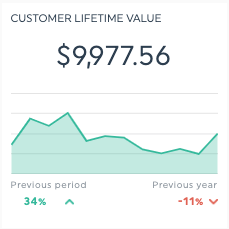
Customer lifetime value (CLV) is the total revenue you can expect from a single customer account over the entire course of your relationship. Formula: Average Order Value x Purchase Frequency x Customer Lifespan = CLV.
CLV is the ecommerce metric that sets a ceiling on how much you can profitably spend to acquire a customer. Stores with high CLV can outbid competitors on paid channels because they recover the acquisition cost over multiple purchases. Improving CLV through loyalty programs, personalised email campaigns, and product recommendations is one of the highest-return strategies available to ecommerce teams.
Benchmark: CLV should be at least 3x your customer acquisition cost. If CLV is lower, your margin on repeat purchases is being eroded by acquisition costs.
Track this in DashThis: CLV can be tracked using purchase history data connected through Google Analytics or your ecommerce platform integration.
16. Engagement rate
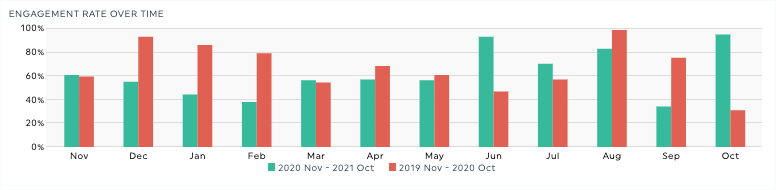
Engagement rate is the percentage of sessions in which a user was actively engaged with your site, meaning they either stayed for more than 10 seconds, completed a conversion event, or visited more than one page. Google Analytics 4 replaced the old bounce rate metric with engagement rate in 2022, following the full sunset of Universal Analytics in July 2023.
If your reports still reference bounce rate, it is time to update them. Engagement rate is a more accurate signal of content and page quality because it accounts for single-page sessions that include meaningful interaction, which bounce rate counted as failures. A session where a user reads a long product description for two minutes was a "bounce" under the old model, but counts as engaged under GA4.
Benchmark: An engagement rate above 50% is generally healthy. If engagement rate is below 40%, investigate whether your landing pages match the intent of the traffic arriving on them.
Track this in DashThis: Engagement rate is available directly from the Google Analytics integration.
17. Email campaign metrics
Email campaign metrics are the data points that measure the performance of your email marketing program, including open rate, click-through rate, unsubscribe rate, list size growth, and revenue generated per email sent.
Email is one of the most effective and cost-efficient marketing channels for ecommerce. It reaches customers who have already opted in to hear from your brand, making it a direct line to your highest-intent audience. Track open rate and click-through rate as engagement signals, but prioritise revenue per email sent as the metric that directly connects email activity to business outcomes.
Benchmark: A healthy open rate for ecommerce email is 20-30%. Click-through rate typically ranges from 2-5%. Revenue per email sent varies by campaign type, with promotional emails outperforming newsletters on a per-send basis.
Track this in DashThis: Connect Mailchimp, Klaviyo, or your email platform to pull all email metrics into your DashThis dashboard automatically.
Customer metrics: loyalty and experience
Customer metrics measure the quality of the relationships your store builds with buyers over time. These ecommerce KPIs help you understand how well you are retaining customers, how likely they are to return, and whether they would recommend your store to others.
18. Customer retention rate
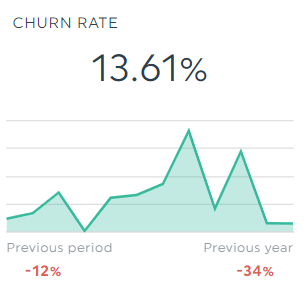
Customer retention rate is the percentage of customers who made a purchase in one period and returned to purchase again in a subsequent period. Formula: (Customers at End of Period - New Customers Acquired During Period) / Customers at Start of Period x 100 = Retention Rate.
Retention rate is distinct from number of repeat customers. While repeat customers is a raw count, retention rate is a proportion that accounts for the size of your customer base, making it a more reliable performance metric over time. High retention rates drive compounding revenue growth because retained customers do not require acquisition spend, and they tend to increase their order frequency and value over time.
Track this in DashThis: Returning Customer Rate is a native metric in the Shopify integration, so you no longer need the manual formula. It updates automatically alongside your sales data.
19. Number of repeat customers
Number of repeat customers is the count of buyers who have made more than one purchase from your store in a defined period. Tracking repeat customers gives you a direct signal of loyalty and satisfaction.
A growing repeat customer base reduces your dependence on paid acquisition to maintain revenue. It also provides a natural testing ground for new products, since repeat buyers are more likely to try new offerings and less price-sensitive than first-time visitors. Segment repeat customers by purchase frequency to identify your most loyal, highest-value cohort.
Track this in DashThis: Use the Returning Customers metric from your Shopify integration for a direct count of buyers who came back, with no setup required.
20. Net promoter score (NPS)

Net promoter score (NPS) is a customer satisfaction metric based on a single question: "On a scale of 0 to 10, how likely are you to recommend this store to a friend or colleague?" Respondents are grouped into Promoters (9-10), Passives (7-8), and Detractors (0-6). NPS = % Promoters - % Detractors.
NPS is the most widely used measure of customer loyalty and overall brand experience. It captures the full post-purchase experience: product quality, delivery, customer service, and return process. A declining NPS is an early warning signal that something in the customer experience is breaking down before that dissatisfaction shows up in repeat purchase rates or public reviews.
Benchmark: An NPS of 50 or above is excellent. A score between 0 and 30 is average for ecommerce. A negative NPS means more customers are actively likely to warn others away from your store than to recommend it.
21. Gross Sales vs Net Sales
Gross Sales is the total value of all items sold before any adjustments, the full price of everything purchased before discounts or returns. Net Sales is what's left after discounts and returns are subtracted, your true product revenue before fees, shipping, taxes, and duties.
Watching the two side by side shows you how much revenue is being given back through discounting and returns. A wide and growing gap between Gross and Net Sales is an early sign that promotions or product issues are eating into your top line.
Track this in DashThis: Gross Sales and Net Sales are both native metrics in the Shopify integration and update automatically.
22. Discounts
Discounts is the total dollar amount of discount codes, automatic discounts, and sale prices applied to orders. Tracking it as its own line tells you how much revenue your promotions are costing and whether discount-driven sales are actually profitable.
Track this in DashThis: The Discounts metric is available directly from your Shopify integration.
How to track all your ecommerce metrics in one dashboard
Tracking 20+ ecommerce metrics across Google Analytics, Google Ads, Facebook Ads, your email platform, and your ecommerce store is time-consuming if done manually. Most ecommerce teams that try to maintain this in spreadsheets spend hours each week on data collection rather than analysis.
DashThis is an automated reporting tool that connects to all your marketing and ecommerce data sources and pulls every metric in this guide into a single, live dashboard. You connect your channels once, and DashThis updates your report automatically on whatever schedule you set.
Here is how to get started:
- Connect your marketing channels to DashThis: Connect your Shopify store for sales, orders, and customer data, then add Google Analytics, Google Ads, Facebook Ads, and your email platform for the full marketing picture. Each one connects in a few clicks.
- Click the free ecommerce dashboard template: DashThis provides a pre-built template with widgets for all the metrics in this guide, already configured and ready to populate.
- Customise your KPIs and share: Edit date ranges, add comparison periods, and share your report by link, PDF export, or automated email delivery.
Ecommerce metrics benchmarks at a glance
Use these benchmarks as a starting reference. Your store's targets should be informed by your own historical trends, your industry vertical, and your traffic mix.
| Metric | Benchmark |
|---|---|
| Conversion rate, 1-4% average | 4%+ is strong |
| Cart abandonment rate, Average is 70% | below 60% is excellent |
| Average order value, Varies by industry | track vs. your own 90-day baseline |
| Customer lifetime value | Should be at least 3x your customer acquisition cost |
| Engagement rate (GA4), Above 50% is healthy | below 40% needs investigation |
| Email open rate | 20-30% is typical for ecommerce |
| Email click-through rate | 2-5% is typical |
| Net promoter score, 50+ is excellent | 0-30 is average for ecommerce |
| Mobile conversion rate, Typically 30-50% lower than desktop | gap indicates friction |
| ROAS, Minimum 2x to cover costs | 4x+ is strong for most categories |
Start tracking your ecommerce metrics today
The ecommerce teams that consistently outperform the market share one thing in common: they measure what matters, they measure it consistently, and they act on what the data tells them.
The 20+ ecommerce metrics in this guide cover every layer of your store's performance, from the moment a visitor lands on your site to whether they become a loyal, repeat customer who recommends your brand to others.
Track all your ecommerce KPIs in one easy-to-use, good-looking dashboard!

Read More

Don’t miss out!
Follow us on social media to stay tuned!
Automate your reports!
Bring all your marketing data into one automated report.
Try dashthis for free