Google Ads Analysis: Top 5 Metrics PLUS When to Measure Them

You need to rethink your Google Ads analysis process if you’re constantly declining the recommendations and randomly adjusting your campaigns every two to three days.
The frequency of analyzing and optimizing your Google Ads often depends on the size and maturation of your account.
Sometimes, it even depends on the company’s internal processes.
For example, a public company with a $30M annual budget, multiple marketing platforms, and strict quarterly reporting process will probably review the ads daily and optimize on a weekly basis.
This guide shares the top metrics on Google Ads and recommends how often you should track them today.
- Quick Recap: What are Google Ads?
- Daily, Monthly, Yearly…Why It’s Crucial to Perform Google Ads Analysis
- Big-Picture View: How to Evaluate Google Ads Results
- Top 5 KPIs & Metrics in Google Ads Analysis (PLUS When to Measure Them?)
- How to Simplify Your Daily, Monthly & Annual Google Ads Analysis
- Automate Your Google Ads Analysis with DashThis Today!
Quick Recap: What are Google Ads?
Google Ads (formerly Google AdWords), a pay-per-click (PPC) advertising platform where brands promote their products and services, boasts 20+ types of ads, with each boasting unique strengths.
For instance, while Google Search Ads suit high-intent customers, Google Shopping Ads usually work best for eCommerce brands. When an agency implemented both ads for a B2C conservatory installer, it generated 33 conversions and closed three deals averaging at €5,500.
Daily, Monthly, Yearly…Why It’s Crucial to Perform Google Ads Analysis
While your daily performance metrics monitor engagement, and your quarterly and annual metrics measure your ads’ impact on revenue growth, your monthly metrics mostly gauge whether you’re making the most of your ad budget to drive conversions.
TLDR; You’re trying to see how your “shallow” metrics feed into the bigger ones, so you can jump in and improve them before it’s too late.
Big-Picture View: How to Evaluate Google Ads Results
Typically, people break down measuring a Google Ads performance into the following four steps.
(i) SET A MEASUREMENT POLICY FOR YOUR KEY METRICS
Determine how often you want to check your metrics based on the size and maturation of your account.
Colt Agar, who leads organic marketing at Red Stag Fulfillment, looks at “shallow and one-dimensional metrics” like CTR and impressions every day.
As for “deeper, complex, and harder-to-measure” metrics like return on investment, he analyzes them over longer time frames to gain a fuller-picture view of performance.
“Shallow metrics feed deeper ones,” explains Agar. “So we always start our process there and use those metrics to help improve the big ones.”
(ii) FIDDLE WITH YOUR CAMPAIGN STRUCTURE & SETTINGS
At this stage, you’ll tweak your campaign or ad groups structure to maximize conversions per dollar spent.
You might ask yourself questions like:
- “Should we consolidate campaigns or use RSLAs?”
- “Does this structure get me the lowest CPC?”
- “How many ad groups should I average per account?”
Consider the search traffic, budget, search intent, and market size. These factors will help you answer the questions as you rejig your campaigns.
(iii) SPOT TRENDS & PATTERNS
Top-performing ads offer valuable insights into customer behavior, all the way from their personal preferences to decision-making processes.
Once you spot patterns among your top-performers, conduct more keyword research to capitalize on these emerging trends. At this stage, you’ll likely:
- Analyze the SERPs of the search terms you want to advertise on
- Determine the search intent of each keyword
- Create ads that meet the search intent, while experimenting with new angles
Consider using a reporting tool like DashThis to make sense of your attribution data. You can spot opportunities quickly and scale success by surfacing all high-performing campaigns, ad groups, and keywords in a single interface.
(iv) STACK UP PERFORMANCE
Finally, set your goals for the upcoming year.
To ensure they’re realistic goals with clear objectives, review past performance.
Laviet Joaquin, who leads marketing at TP-Link, analyzes trends to inform future strategies. She also looks at market share to assess brand presence and revenue growth to gauge the search campaigns’ overall impact on the business.
Reviewing these KPIs, Joaquin sets more attainable goals for the new year ahead.
Top 5 KPIs & Metrics in Google Ads Analysis (PLUS When to Measure Them?)
Unless it’s a brand new account, you probably don’t need to monitor every metric daily. So, how often should you measure then? Here’s what the Google Ads specialists we spoke to recommend (based on the most commonly tracked metrics).
(i) CLICK-THROUGH RATE (CTR)
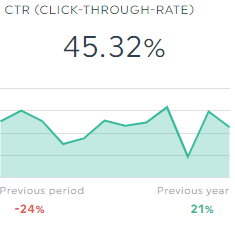
What it is:
CTR is the percentage of clicks your ad receives from all users who see it. High click-through rates correlate with high ad positions.
When to check: Daily
How to improve it:
- Add dynamic keyword insertion to your ad copy (e.g., headline). A PPC specialist reportedly increases CTR by 50% from this tactic alone.
- Include ad extensions to provide more valuable information (e.g., sitelinks and image extensions for users to quickly get to the page they’re interested in and take up more real estate on the search results page)
- Entice users with emotional triggers to increase the number of clicks. For example, an eCommerce store selling protein bars might include “power your busiest days” in its ad text to appeal to time-strapped shoppers.
(ii) CONVERSION RATE (CVR)
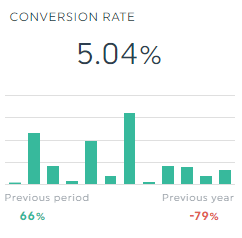
What it is:
CVR is the percentage of users who completed a valuable action measured against the total number of visitors over a time period.
When to check: Weekly
How to improve it:
- Adjust bids on devices (e.g., an enterprise MarTech company might increase ad spend for desktop or laptop devices, as buyers are unlikely to purchase a high-ticket product on mobile devices).
- Improve landing page experience (e.g., remove navigation to prevent distracted visitors, reduce number of form fields to boost lead magnet downloads)
- Add power words in call-to-action button (e.g., “Find my best fit!” instead of a simple “Buy now” for an eCommerce store that sells jeans)
(iii) COST PER CONVERSION
What it is:
Cost per conversion tracks how much each conversion costs from your ads.
This metric is similar to cost per acquisition (CPA), which tracks how much it costs to acquire a customer; and cost per click (CPC), which tracks how much a single click costs.
When to check: Weekly
How to improve it:
- Improve Quality Score. Ads with high scores see lower CPC.
- Add negative keywords to avoid targeting searchers unlikely to become customers (e.g., an eCommerce selling protein-rich beef jerkies might exclude protein supplements like protein shakes)
- Pause keywords with high CPA to free up more budget for top-performing keywords
(iv) QUALITY SCORE
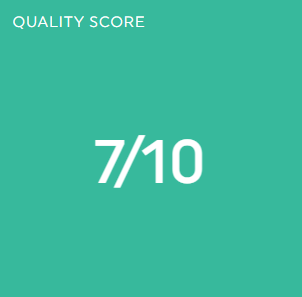
What it is:
Quality Score compares your ad quality to other advertisers on a scale from 1 to 10. It’s calculated based on expected CTR, ad relevance (i.e., how your ad copy relates to the keywords in your ad group), and landing page experience.
The better your Quality Score, the higher the ad rank and number of times potential customers will see your ad.
When to check: Weekly
How to improve it:
- Implement single keyword ad groups, especially if these keywords you’re targeting have high search traffic and conversions (note: SKAGs require a lot of maintenance, so unless you have the resources to manage every ad group for each individual keyword, you’re better off with the tactics below!😊).
- Add negative keywords to prevent your ads from appearing to users with search queries unrelated to your products
- Optimize landing page experience. For example, if you’re trying to increase the number of visitors downloading your ebook, remove the Contact Us button. This will prevent taking away users from your conversion goal.
(v) RETURN ON AD SPEND (ROAS)
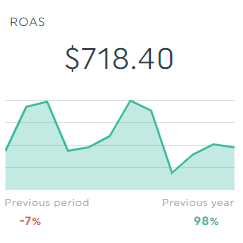
What it is:
ROAS is the revenue you get back for every dollar spent on your ad campaigns.
When to check: Monthly
How to improve it:
- Adjust your maximum bid to reduce ad costs
- Segment your audience to improve targeting (e.g., discount ads for new shoppers who abandoned carts)
- Experiment with different messaging across the remarketing funnel (e.g., customer success videos for prospects in the decision stage)
How to Simplify Your Daily, Monthly & Annual Google Ads Analysis
DashThis is the easiest Google ads reporting tool.
Gather all metrics across different ad groups and keywords into one beautiful Google ads dashboard automatically. This way, you analyze your overall campaign performance in a single interface, extracting insights and spotting optimization opportunities quickly.
Here’s how it works:
- Connect your Google Ads account with DashThis
- Select the Google Ads report template
- Choose your metrics in Preset Widget
DashThis will grab your entire Google Ads data from your account into your report automatically. Drag and drop them to form a cohesive look.
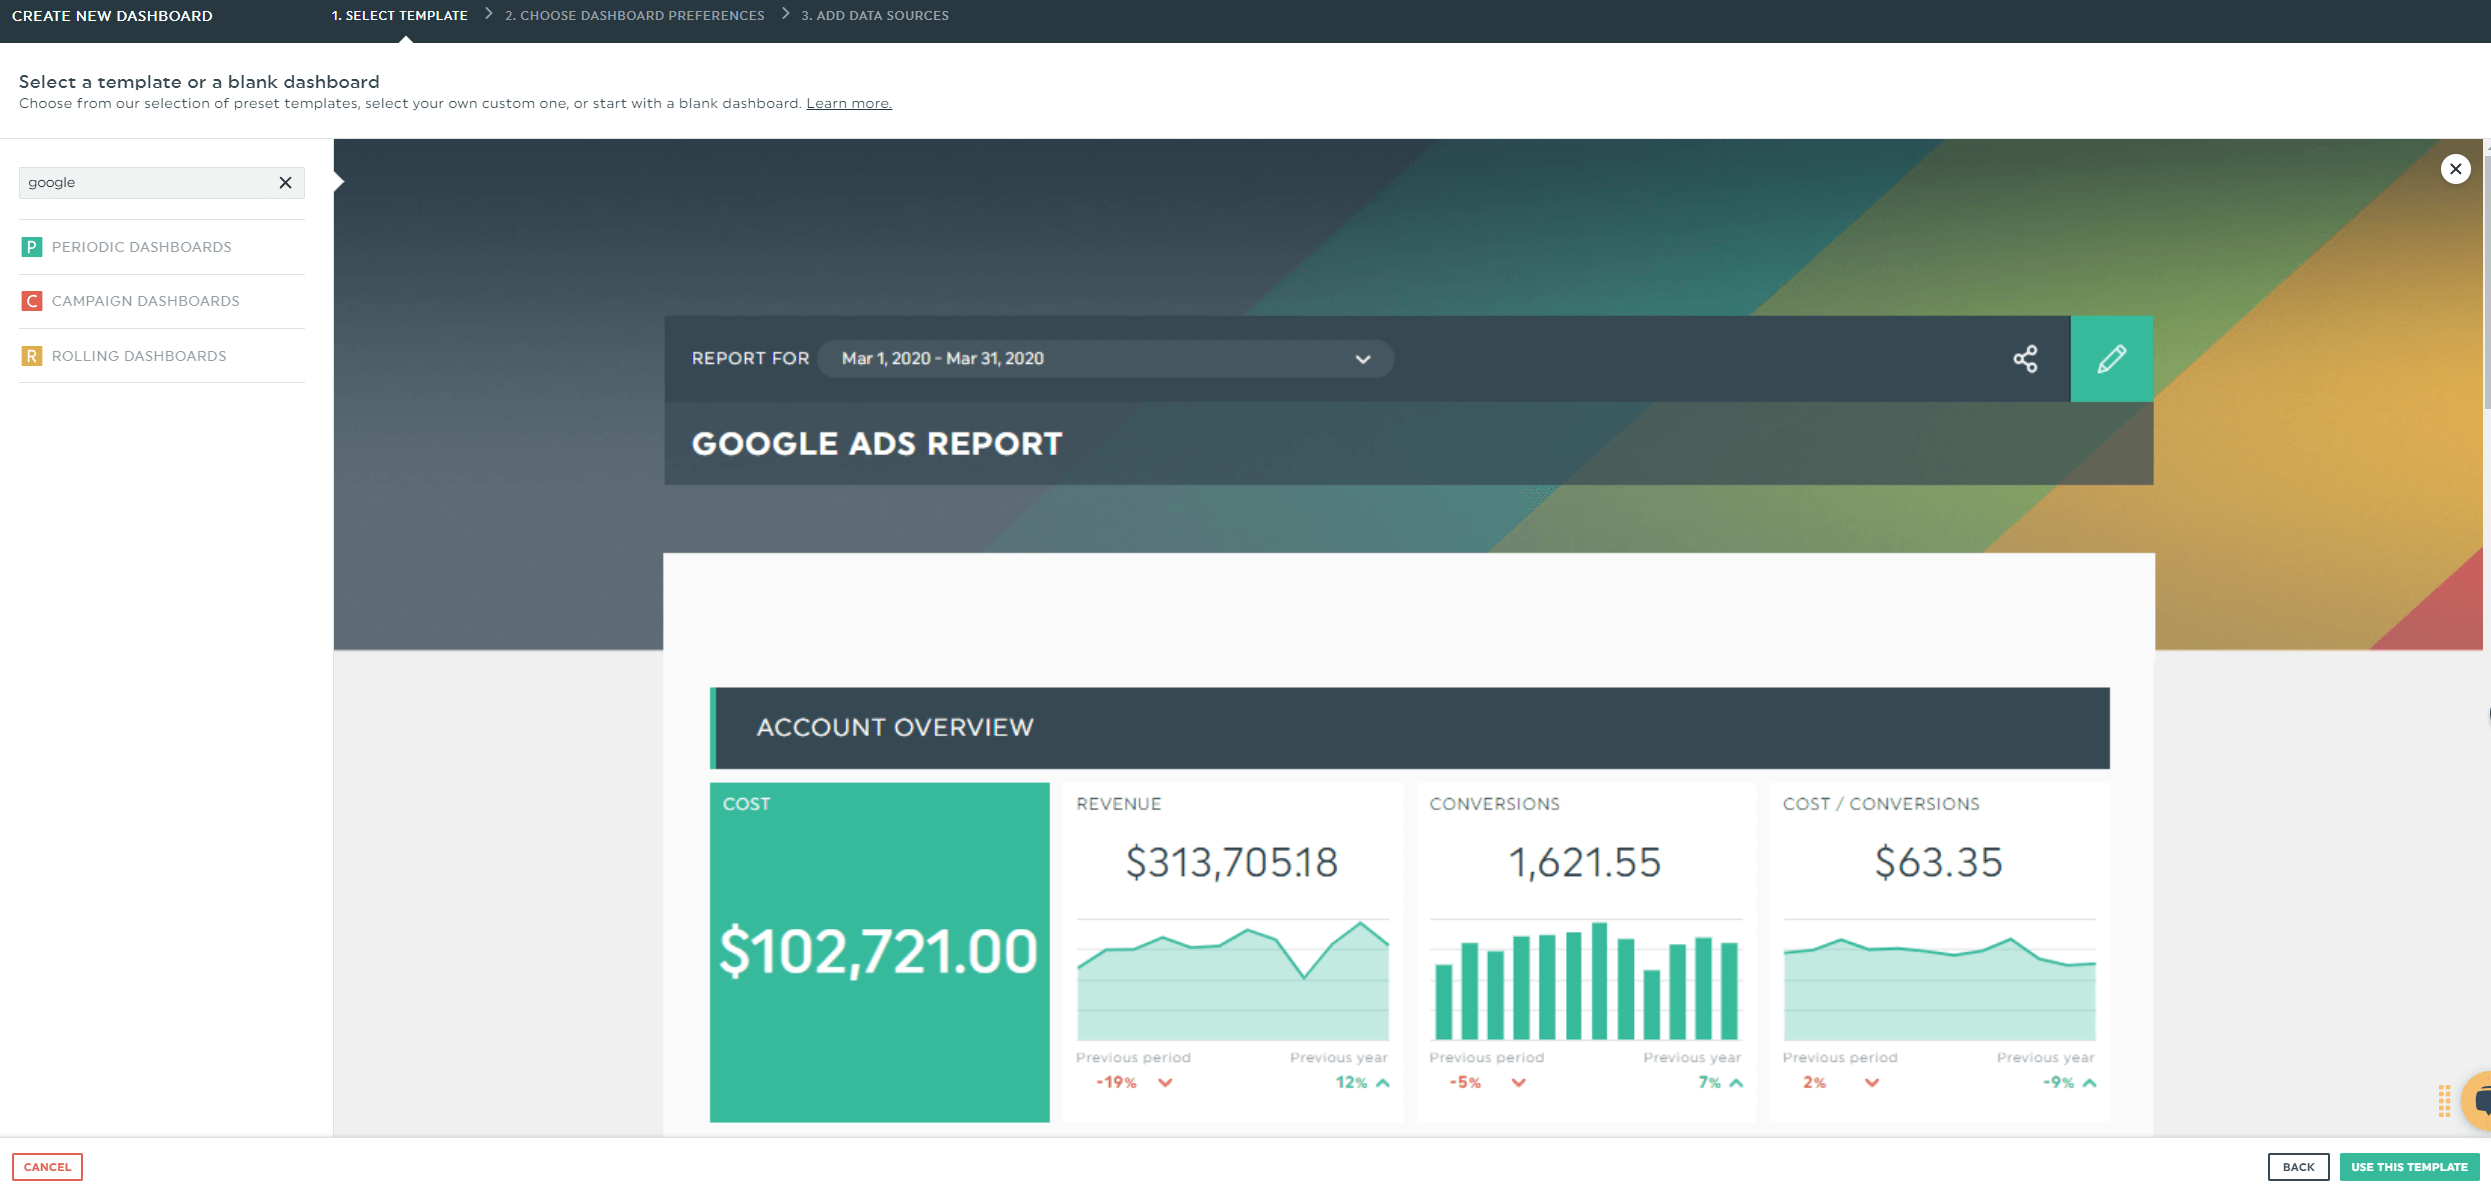
Customize your Google Ads report.
Let’s say you’re running ads for a project management software company.
You noticed from conversion tracking: ads that highlight time saving benefits generated more trial users than ads that focused on team communication. You have a hunch you’ll likely see similar conversions in the blog posts with this messaging.
How do you make your case to management that it’s time to combine paid search + SEO in the next month’s digital marketing strategy?
By using our built-in comments widget!
Click Static Widget > Comment and share your strategy accordingly.
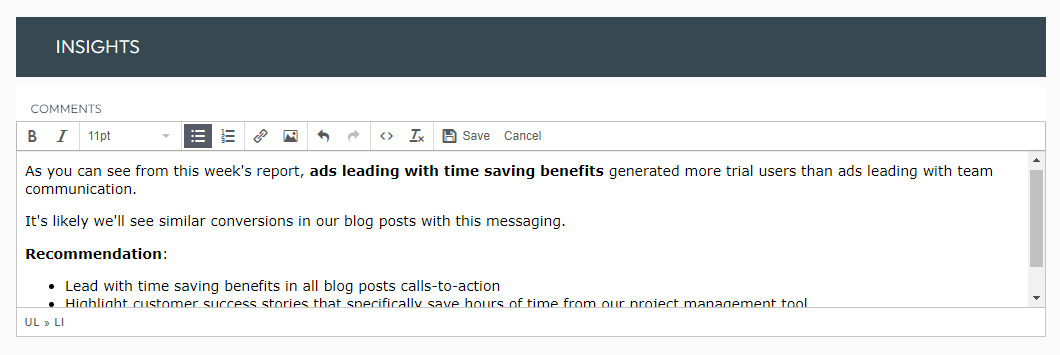
Click Save.
Once you’re done customizing the report, schedule an automated email dispatch.
Here’s how it works:
- Hover to the Sharing Options icon on the top right
- Click Share by Email
- Set the dashboard period and frequency
- Click Schedule
Add an optional note and include the report as a PDF attachment.
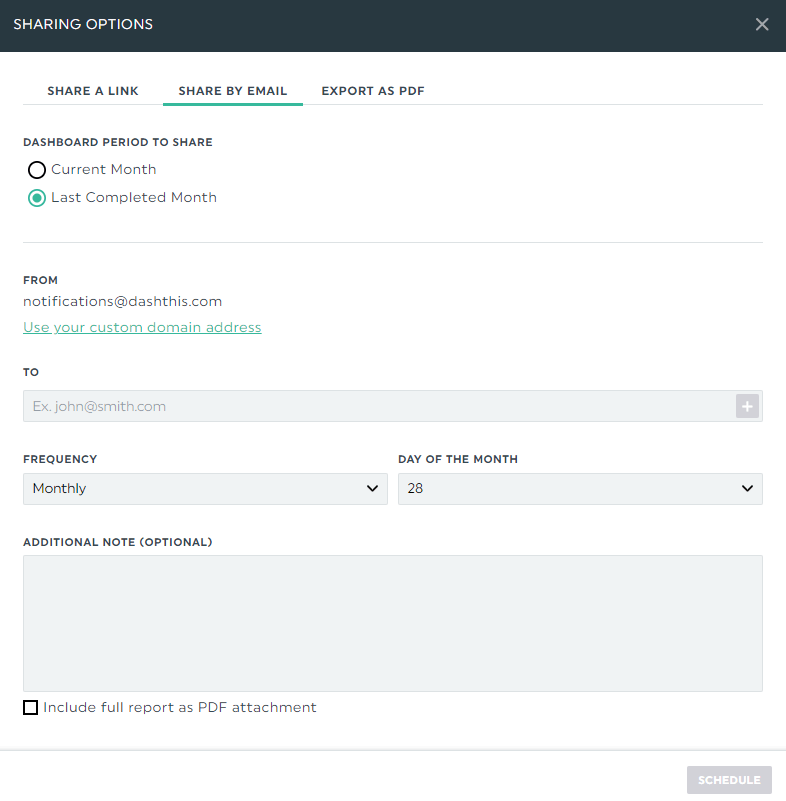
Alternatively, send over the report via a shareable URL link.
Whether it’s a daily, weekly, monthly, quarterly, or annual report, DashThis got you covered.
PPC agencies that automate their dashboards on our powerful tool enjoy additional features like:
- Native integration with 40+ popular marketing tools, including Google Analytics, Ahrefs, and Facebook Ads
- Unlimited users and client accounts in all plans
- 40+ beautiful report templates with pre-built popular metrics
- Built-in notes to provide additional context for specific metrics
Start your free 15-day trial to automate your Google Ads reports today.
Google Ads report
Gather your entire campaigns in this Google Ads report, complete with detailed insights, before making any adjustments to your bidding strategy.
Here, you can analyze your Google Ads campaigns with the highest return, total ad clicks for top-performing ads, and high-performing keywords—all in one place.
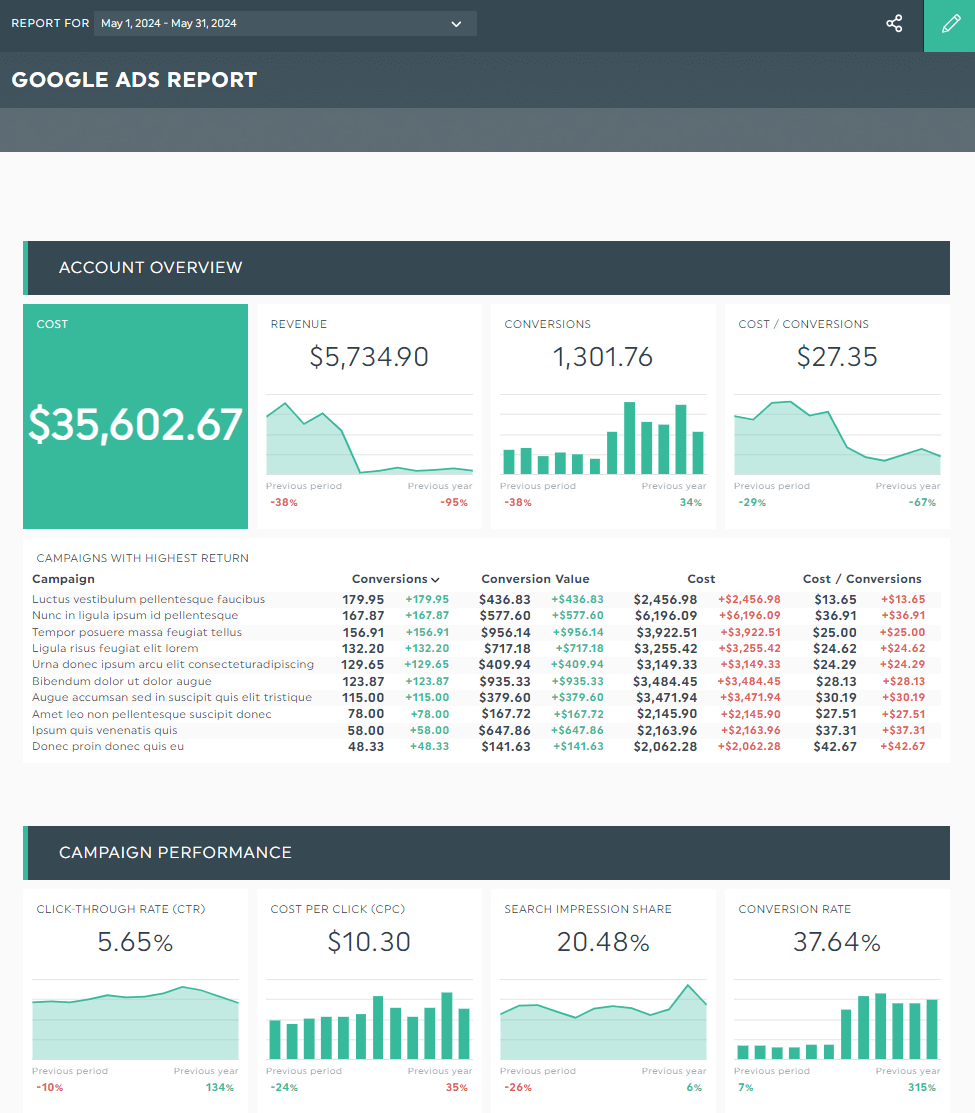
Grab this Google Ads analysis report with your own data!
Automate Your Google Ads Analysis with DashThis Today!
By analyzing your Google Ads metrics according to the size and maturation of your account (and among other factors), you can jump in and improve them before it’s too late.
You probably won’t follow our recommendations verbatim, but it’s good practice to keep these key metrics in mind as you experiment with your ads.
Better if you measure them alongside a reporting tool like DashThis.
Our breezy tool helps you analyze your overall ad campaign performance in a single interface, so you can spot patterns and distill insights quickly.
DashThis is the easiest reporting tool. Automatically gather your entire data across different campaigns, ad groups, and keywords into one beautiful report.
Start your free 15-day trial to automate your Google Ads reports today.

Ready to perform a Google Ads analysis with dashthis?
Read More

Don’t miss out!
Follow us on social media to stay tuned!
Automate your reports!
Bring all your marketing data into one automated report.
Try dashthis for free