How to create a Meta Ads Dashboard in DashThis: A Step-by-Step Guide

With 3.27 billion daily users, Meta is a top business platform for reaching new customers and growing brand awareness. In 2023, its ad solutions generated over $131 billion in revenue.
If you're using Meta's ads for your clients, how are you tracking and sharing the results with your clients?
Creating a report in Excel may not be enough, and you may have attempted to build a dashboard to visualize your data. However, building a dashboard can be tedious without help. Maybe you’ve tried building one, but thought of questions like these.
“Which key performance indicators (KPIs) do I include for Facebook advertising?”
“How do I make it look professional and easy to understand for my bosses?”
“I don’t have the coding knowledge or the time to build or maintain a dashboard.”
Tools like DashThis are here to simplify dashboard creation and save you time. Let’s explore why a dashboard can help you report your Meta advertising efforts and practical tips to build a helpful client dashboard for your Meta ad campaigns.
- What is a Meta ads dashboard?
- Why track your Meta ads metrics?
- Top Meta ads metrics to add to your client dashboard
- How to create a Meta ads dashboard in DashThis
- Best practices to follow when creating a Meta ads dashboard
- Automate your Meta ads reporting with DashThis
What is a Meta ads dashboard?
Besides reviewing data in Meta ads manager, your dashboard is where people go to get information on their campaign metrics. For example:
- Your CEO wants an overview of your cost and return on investment (ROI) metrics for an upcoming marketing strategy discussion? Include these two metrics in your dashboards.
- Your client's digital marketing team requires data to determine which ad elements to test? Highlight KPIs like click-through and conversion rates from the past week.
Some key features of a Meta ad performance dashboard:
- Overview: These help people get a grasp of the important metrics at a glance
- Visual elements: Our brains process visuals faster than text. So, use graphs, charts, and tables to highlight specific metrics and make them easier to understand.
- Data filters: Unlike reports, dashboards are interactive. Clients and stakeholders can adjust data filters on a widget or the entire report. This will help them focus on a specific date range for further analysis.
- Easy access: Offer different ways to share your dashboards with your clients.
- Actionable insights: They make your data relevant to your client's goals. In short, actionable insights answer the question, “What does the data mean, and what should I do with it?”
Pro tip: All these features are already part of DashThis's Facebook ad campaign report template!
Get this Facebook ad campaign report template with your own data!
Why track your Meta ads metrics?
Are your ad campaigns helping your clients increase sales or brand awareness? When your client’s marketing budget is on the line, it’s not enough to make campaign decisions with your gut. You need a guide that tells you what to tweak in your campaigns, which adjustments have an impact, and which don’t.
Tracking the right metrics act as your guide. Here are a few reasons how.
ENABLES DATA-DRIVEN DECISIONS
The Facebook ads dashboard lets you measure everything related to campaign performance. Track metrics like conversion rates and cost per action to help you gauge your campaign's effectiveness and manage ad spend.
That doesn’t mean you must collect and present everything from the Facebook ads manager to your client (you shouldn’t!). But, if you focus on the right metrics, it’s easier to improve your ad campaigns by referring to data. Some examples where this will be helpful.
- More efficient campaign optimization: Meta advertising requires constant testing and experimentation, which works best when measured against a metric. For example, you could test different headlines and ads to find out which gets a higher click-through rate. Or, you could test different audience targeting options to see which variant lets your campaign reach the most people. Monitoring your test results makes it easier to spot which activities improve your campaigns.
- Focus on relevant metrics: Not all of Meta’s 300+ metrics will apply to your client. It's up to you to keep them focused on metrics that matter to their goals. Dashboards make it easier to track the most relevant metrics.
HELPS PROVE CAMPAIGN RESULTS TO CLIENTS
Let’s say you’re working with a client to drive sales with Instagram ad campaigns for their e-commerce store, and your contract is up for renewal. Should they keep using Instagram ads or switch to other social media channels like LinkedIn? Or try a different approach, like search engine optimization? (SEO).
You could put the necessary information in a dashboard to help them make the right decision. Compare today's metrics, like revenue and conversion rate, to when you started working together. This will show how much your ads have helped their business, leading to a more productive discussion.
Top Meta ads metrics to add to your client dashboard
If you’re unsure which Facebook ad metrics to track, start with these six metrics. These cover most reporting scenarios and common client goals.
IMPRESSIONS AND REACH: REVIEW AD DELIVERY EFFECTIVENESS
We’ve grouped these two top-of-the-funnel metrics as key brand awareness metrics.
Impressions are the number of times your ad was shown. These count even if no one clicks on it. In comparison, reach measures the number of unique people who've seen your ads. So, if a person sees your ad five times, it counts as one reached person and five impressions.
These metrics help assess whether your ad campaigns are functioning correctly. High impressions or reach with low engagement can mean two things: Your ad may not be engaging enough, or you may be targeting the wrong audience.
CLICK-THROUGH RATE (CTR): TRACK ENGAGEMENT AND AD RELEVANCE
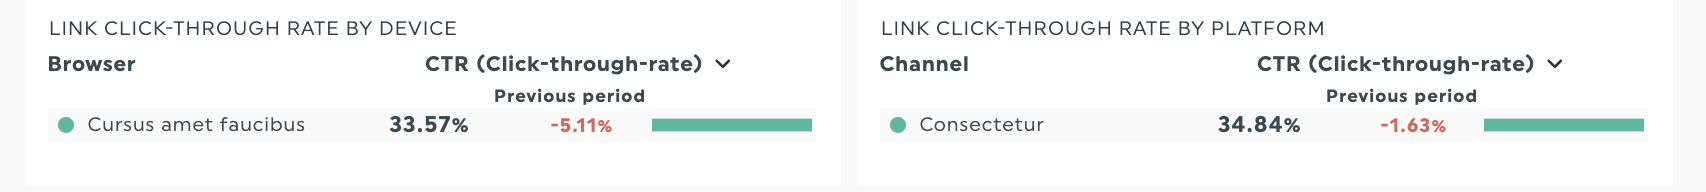
Click-through rate shows how often people click on your Facebook ad and visit your landing page, offer, or website.
A high CTR means your ads capture attention, whereas a low CTR may suggest issues with ad relevance or your target keywords. Use this metric to evaluate whether your ad creatives and ad copy align with your audience's needs.
Click-through rate formula: CTR = (Link clicks / Impressions) 100
COST-PER-CLICK (CPC): MEASURE COST EFFICIENCY
CPC tells you how much of your ad budget you’re spending when someone clicks on your ad.
These metrics help answer questions about marketing spend and campaign efficiency. CPC measures the average cost of your Facebook or Instagram ads, while CPM tracks the cost of 1,000 ad impressions.
CONVERSION RATE: ASSESS CAMPAIGN'S EFFICIENCY
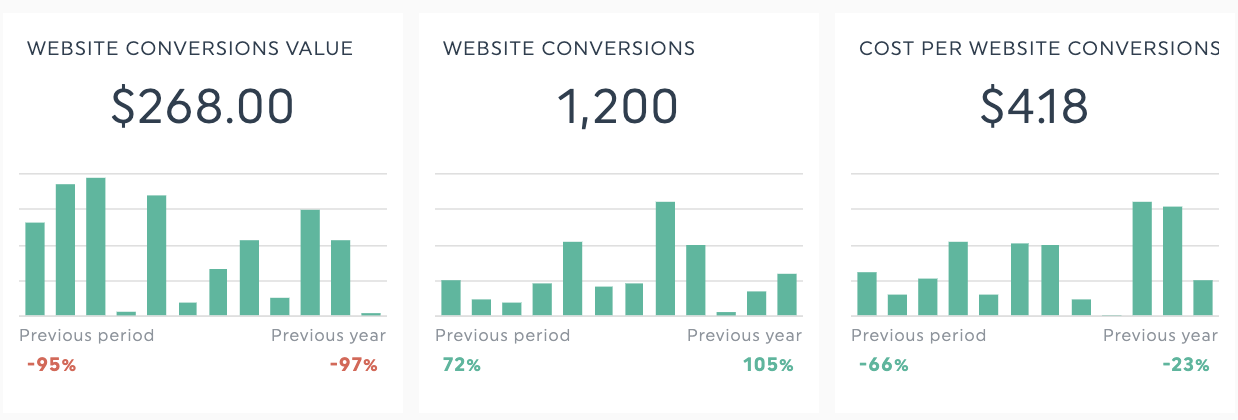
Conversion rate is a key metric for measuring ROI in lead generation. It measures the percentage of visitors who take a specific action within a set time, such as filling out a form or subscribing to a newsletter.
Conversion rate calculation: The number of conversions ÷ the number of visits.
RETURN ON AD SPEND (ROAS): GAUGE AD EFFECTIVENESS AND PROFITABILITY
Are you getting the returns you need to justify spending on Facebook ads? ROAS refers to the amount of revenue that is earned for every dollar spent on a campaign.
It’s a solid metric to add when presenting to executives who want to know how profitable your campaigns are.
How to create a Meta ads dashboard in DashThis
Are you reporting on more channels besides Facebook ads or Instagram ads? Or, do you need your report to look great? DashThis can simplify your marketing reporting and make your data accessible in a matter of minutes.
Here’s a step-by-step guide to everything you need to know to build your Meta ads dashboard in DashThis. First, let’s sign up for DashThis’s 15-day trial here.
STEP 1: Connect your Facebook Ads or Instagram account as a data source
Now, it’s time to put together your dashboard and save yourself some valuable time. Then, let’s add the data sources you’re reporting on with the Connect button.
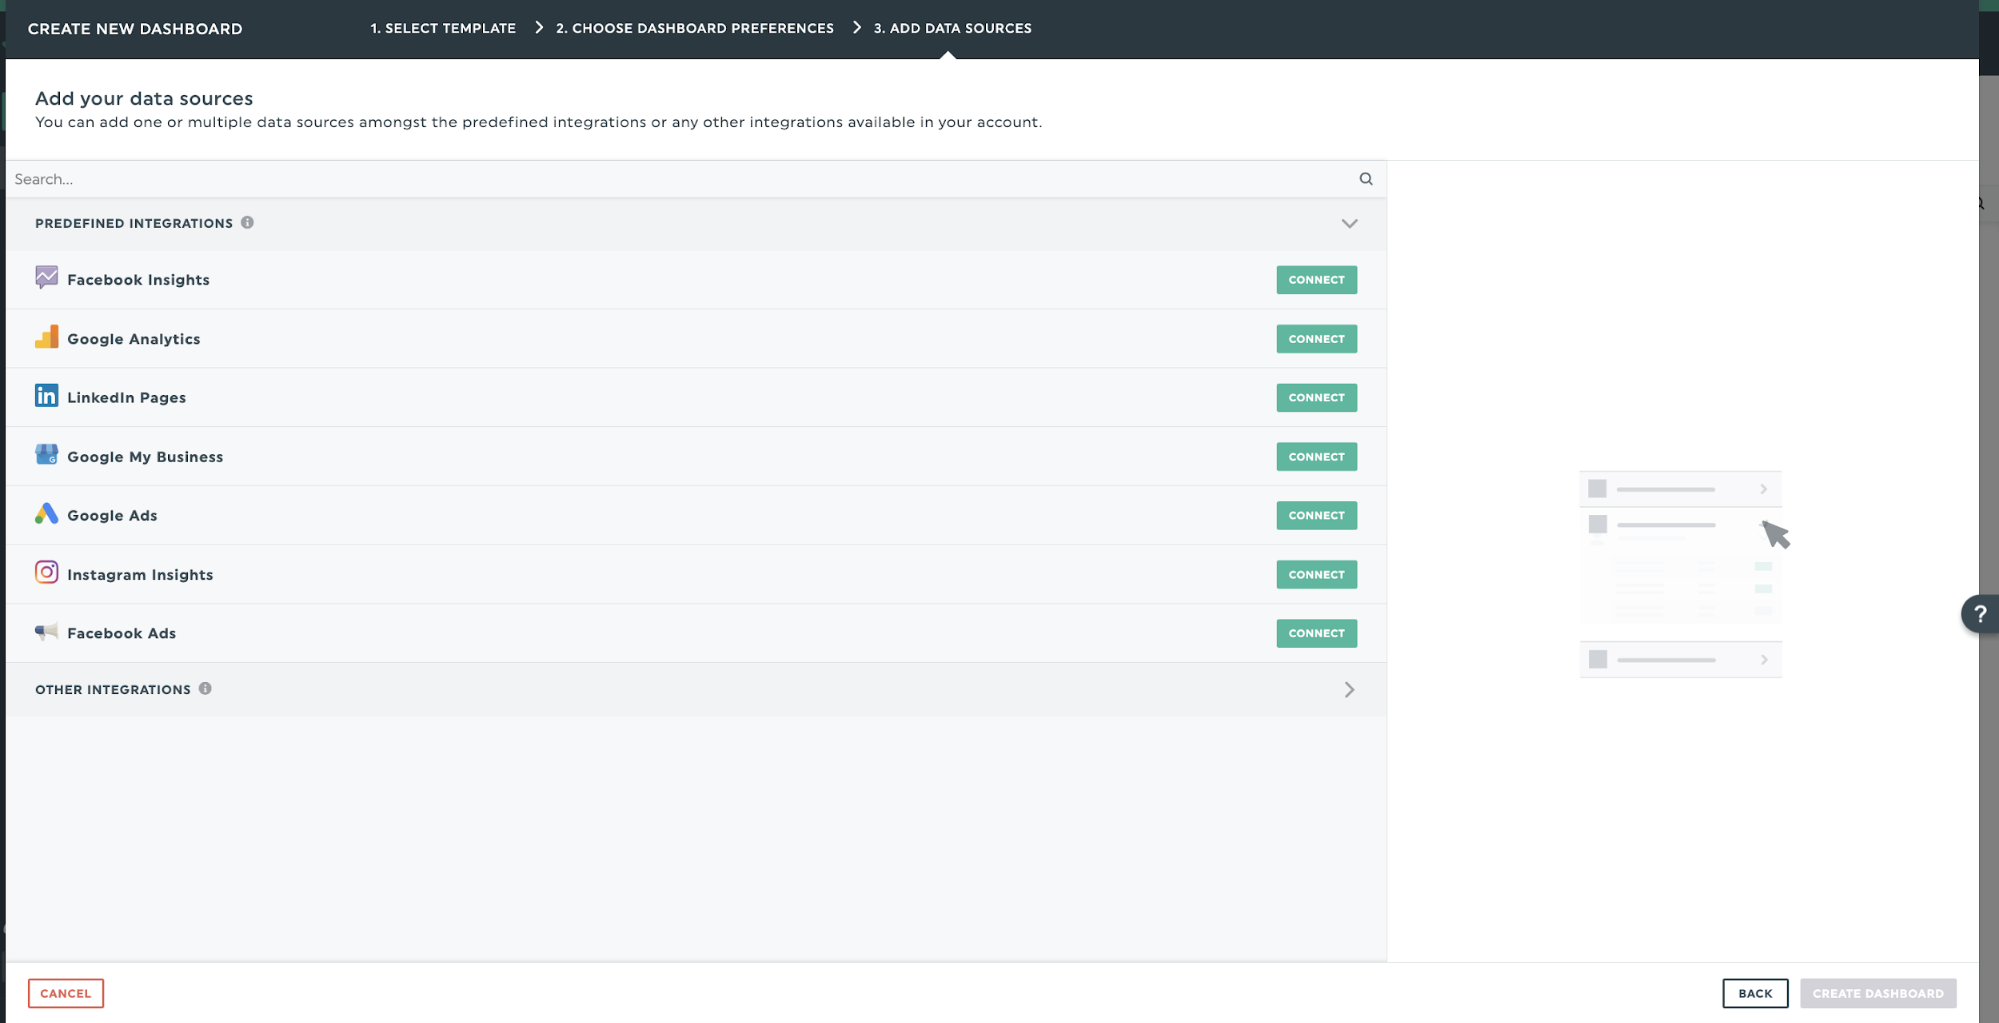
You may need admin permissions to give DashThis access your marketing data in each tool. Once given, DashThis will auto-import your latest data from your Facebook or Instagram ad accounts.
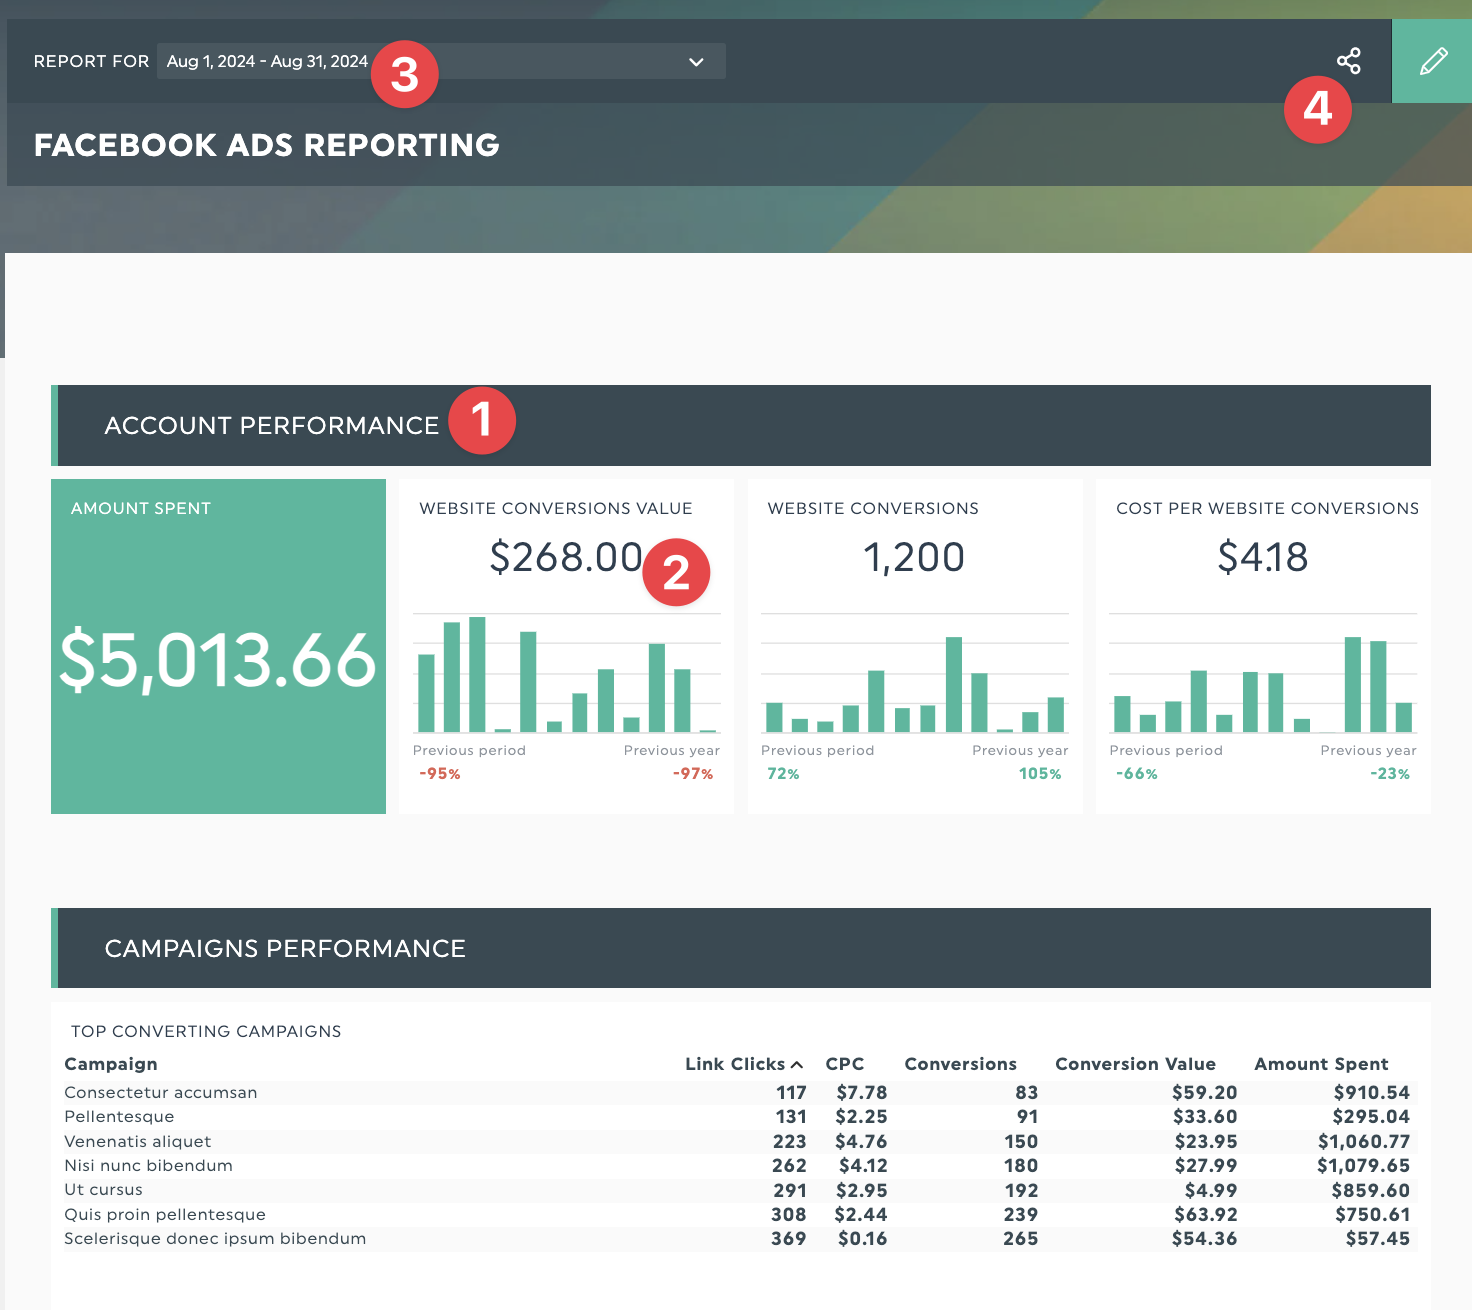
STEP 2: Create your dashboard
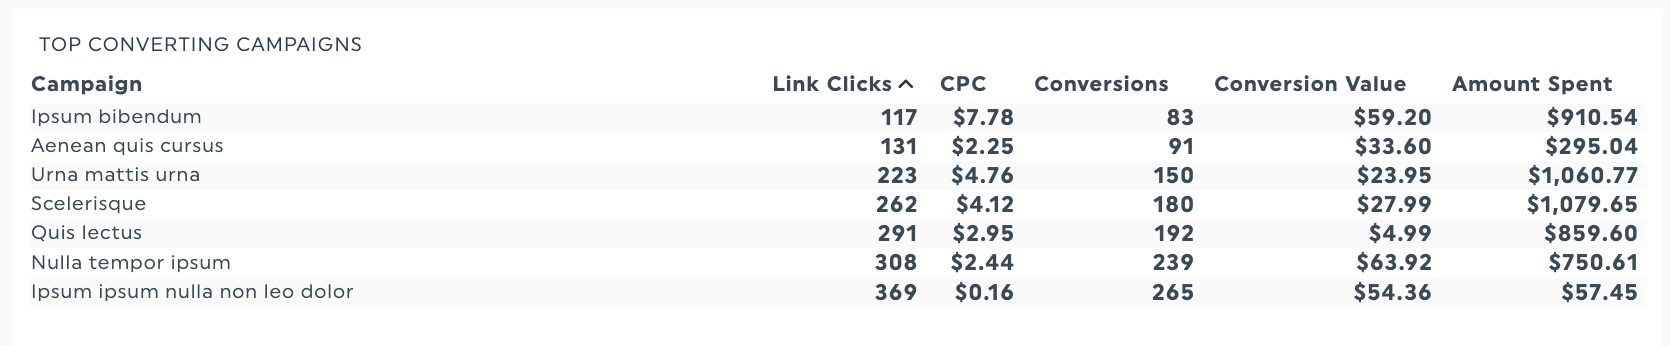
Once you’ve imported your data, it’s time to assemble your dashboard! Start with our Facebook ads report template. It has all the KPIs you need to track your ad campaigns in Meta, such as:
- Reach
- Cost per action
- Cost per conversion
- Conversions
- Amount spent
If you're unsure where to start with creating your dashboard, this template is a great place to begin.
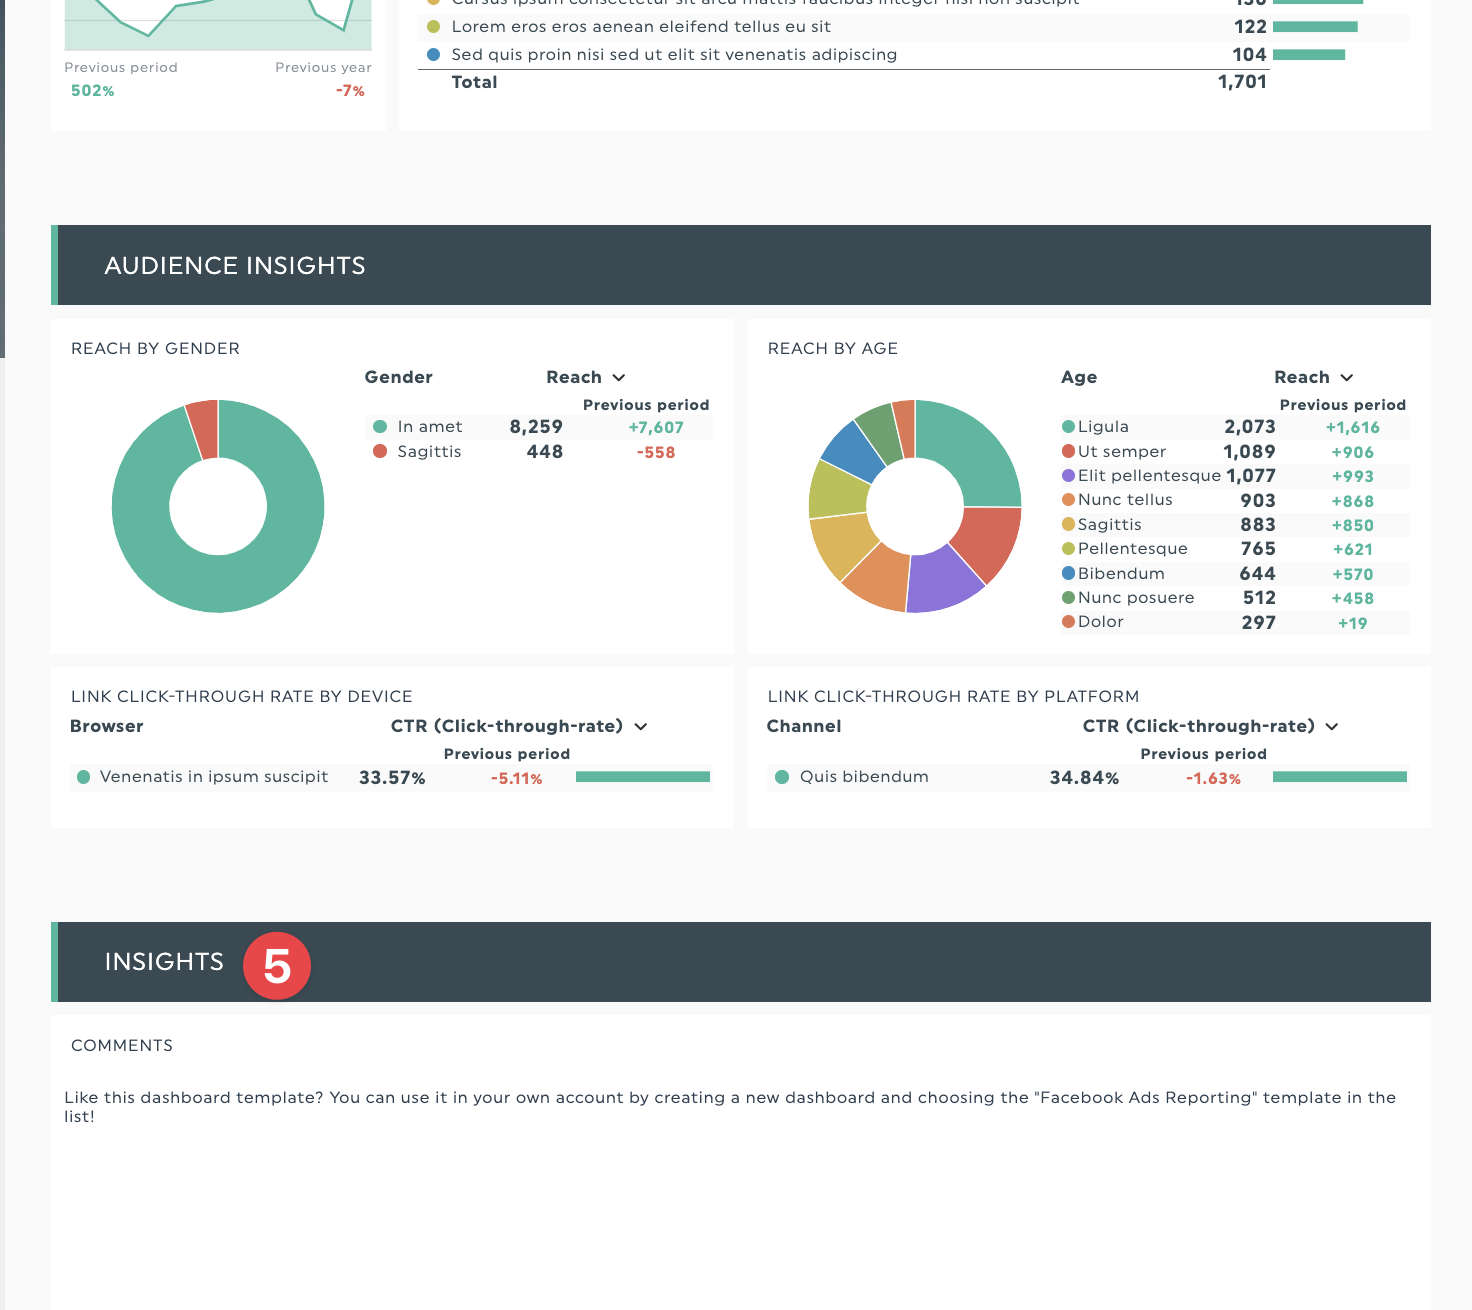
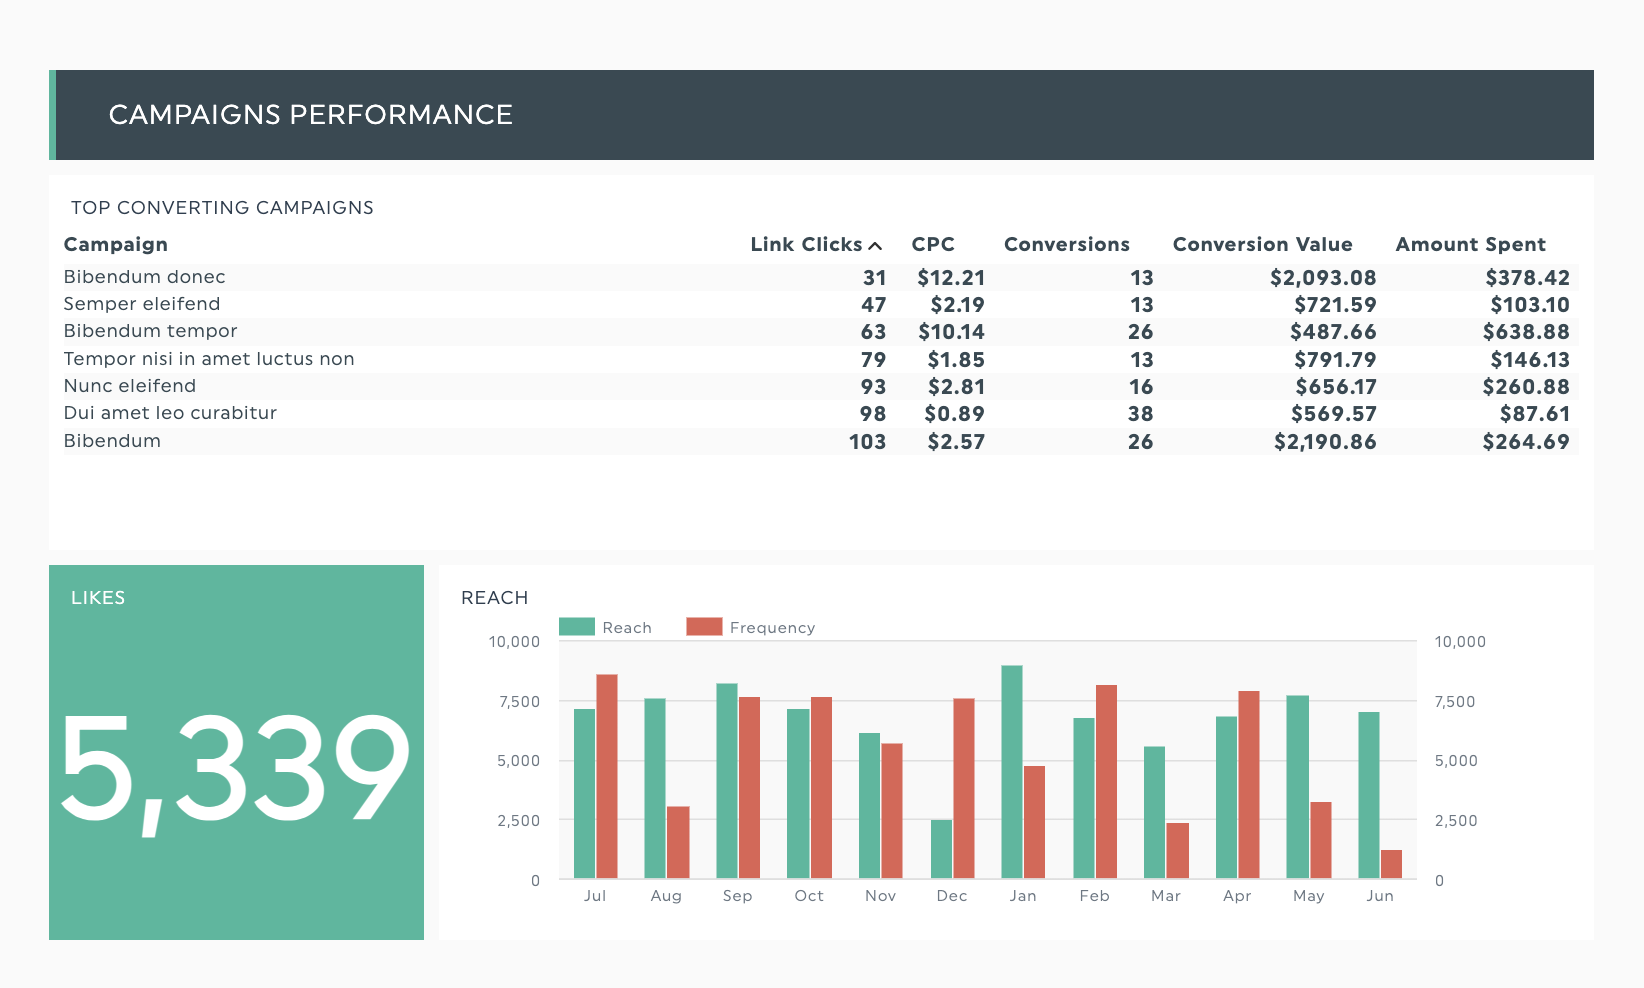
STEP 3: Drag and drop widgets to customize your report
DashThis’s drag-and-drop interface makes choosing the metrics you’re reporting on easy. Use headers and sections to organize your KPIs. This will create a logical, easy-to-follow flow for your client or stakeholder to review. Or, adjust your report to highlight ad data relevant to your client's campaign goals.
Organize your report and visualize your metrics with DashThis’s widgets. Here’s a quick overview of the widgets you can use in DashThis to customize your report
PRESET WIDGET: These are metrics that we’ve already set up with your connected data sources. Think of them as shortcuts to common KPIs for a Meta ads report. With preset widgets, you can show your data instantly. No need to worry about the graph type, data sources, or settings. Which means more time saved.
CUSTOM WIDGET: Prefer to create your own custom widget? Don’t worry. DashThis has the tools for that! We’ve got nine graph types for you to visualize your data
STATIC WIDGET: These tools help you organize your dashboards, including headers and comment boxes. You can also add editable numbers or embed a CSV file (such as leads from your ads). This puts everything in one place for easy reference.
STEP 4: Set up an automated reporting schedule
Once you are happy with your Meta ads dashboard, why not use automated report scheduling to save time?
Click Sharing Options> Share by Email> Frequency. This will automatically schedule an email to your client with the updated dashboard. You won't have to worry about missed or late reports again!
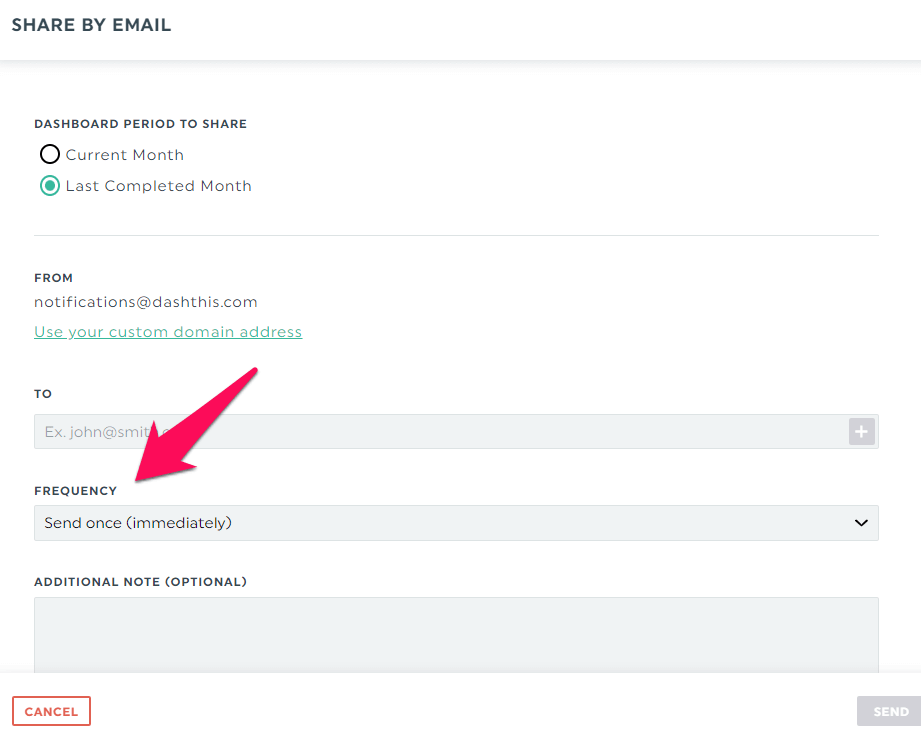
Or share a URL link with your dashboard. This lets clients view the link online in real time, perfect for preparing for an in-person or video meeting to discuss your client's Facebook ad results.
Best practices to follow when creating a Meta ads dashboard
You’ve learned how to create a dashboard, and how DashThis can help you save time. How do you make your dashboard easy to use and access? It should help with decision-making, and not be a pain to use. These practical tips might help.
BE CLEAR ON THE DASHBOARD'S PURPOSE
Before you create a dashboard, ask: why does this dashboard exist?
And yes, to report Meta ad campaign performance or pay-per-click ad results is a valid answer.
But go deeper. Ask yourself questions like:
- What campaign objectives are you reporting on?
- Who will be reviewing the dashboard?
- What’s important to them?
- How often will they check the dashboard?
Answers to these questions will determine how you structure your dashboard. For example, when using Facebook ads for traffic or leads, you'll prioritize different metrics.
In the same way, you'll structure a dashboard according to what your target audience wants to see. Suppose you’re building a dashboard meant for your head of finance and your digital marketing team. The head of finance might want to see cost and ROI-related metrics to assess campaign profitability. In contrast, your digital marketing team might want a detailed breakdown of how each ad campaign compares to decide what to A/B test.
Before you work on your dashboard and assemble metrics, know who will review it and what they want to see in them. It’ll make it easier to choose the right metrics and structure the dashboard for maximum impact.
KEEP THE DASHBOARD'S DATA CLEAN AND UP-TO-DATE
Reporting dashboards are only as good as the data they're fed. Ensure you keep your data up to date and remove any incorrect data to reduce the risk of errors. Check the original sources for inconsistencies every week and ensure your dashboard metrics match your KPIs in the Meta ad account.
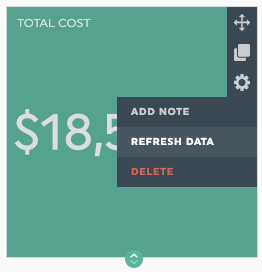
Tip: After you connect your Meta ad account (and others) through DashThis's integrations, it will update your dashboard data daily. You can refresh your widget’s data manually by clicking on Refresh Data under the widget menu
LINK METRICS TO BUSINESS GOALS
As we’ve mentioned before, Meta ads feature a staggering number of different metrics. Including them all in your report overwhelms your client. So, you must be selective to maintain a top-notch user experience.
Curate your metrics on what you’re reporting on. Let’s say you’re tasked to run ads through Facebook and Google Ads to drive sales for an e-commerce store business owner. They operate on a small marketing budget and want to ensure they use their paid advertising budget effectively.
Here, you want to put these two metrics (advertising cost and advertising’s overall contribution to revenue) front and centre. Here’s an example e-commerce dashboard with these high-level metrics in the overview.
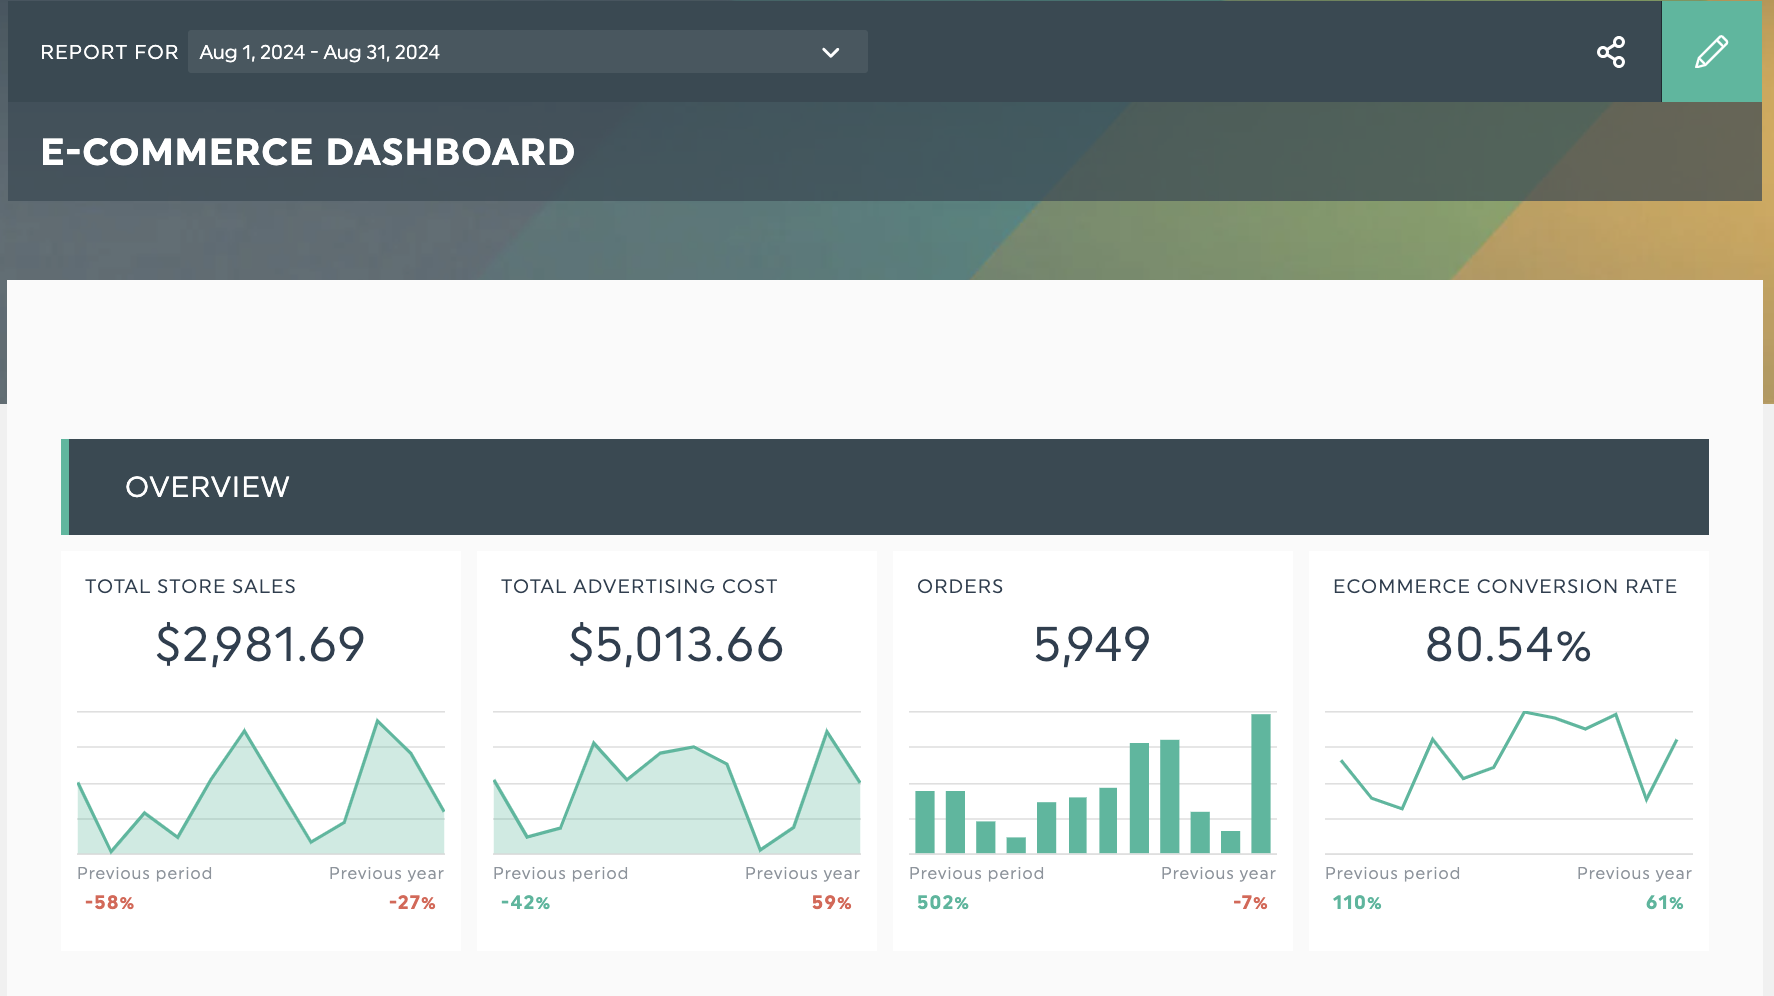
That way, your client can look at these overview metrics and immediately get an answer to their primary concern. You can then go into more detail in separate sections on the dashboard. For example, you can break down advertising costs into campaign or ad group costs with separate headings.
PAY ATTENTION TO STRUCTURE
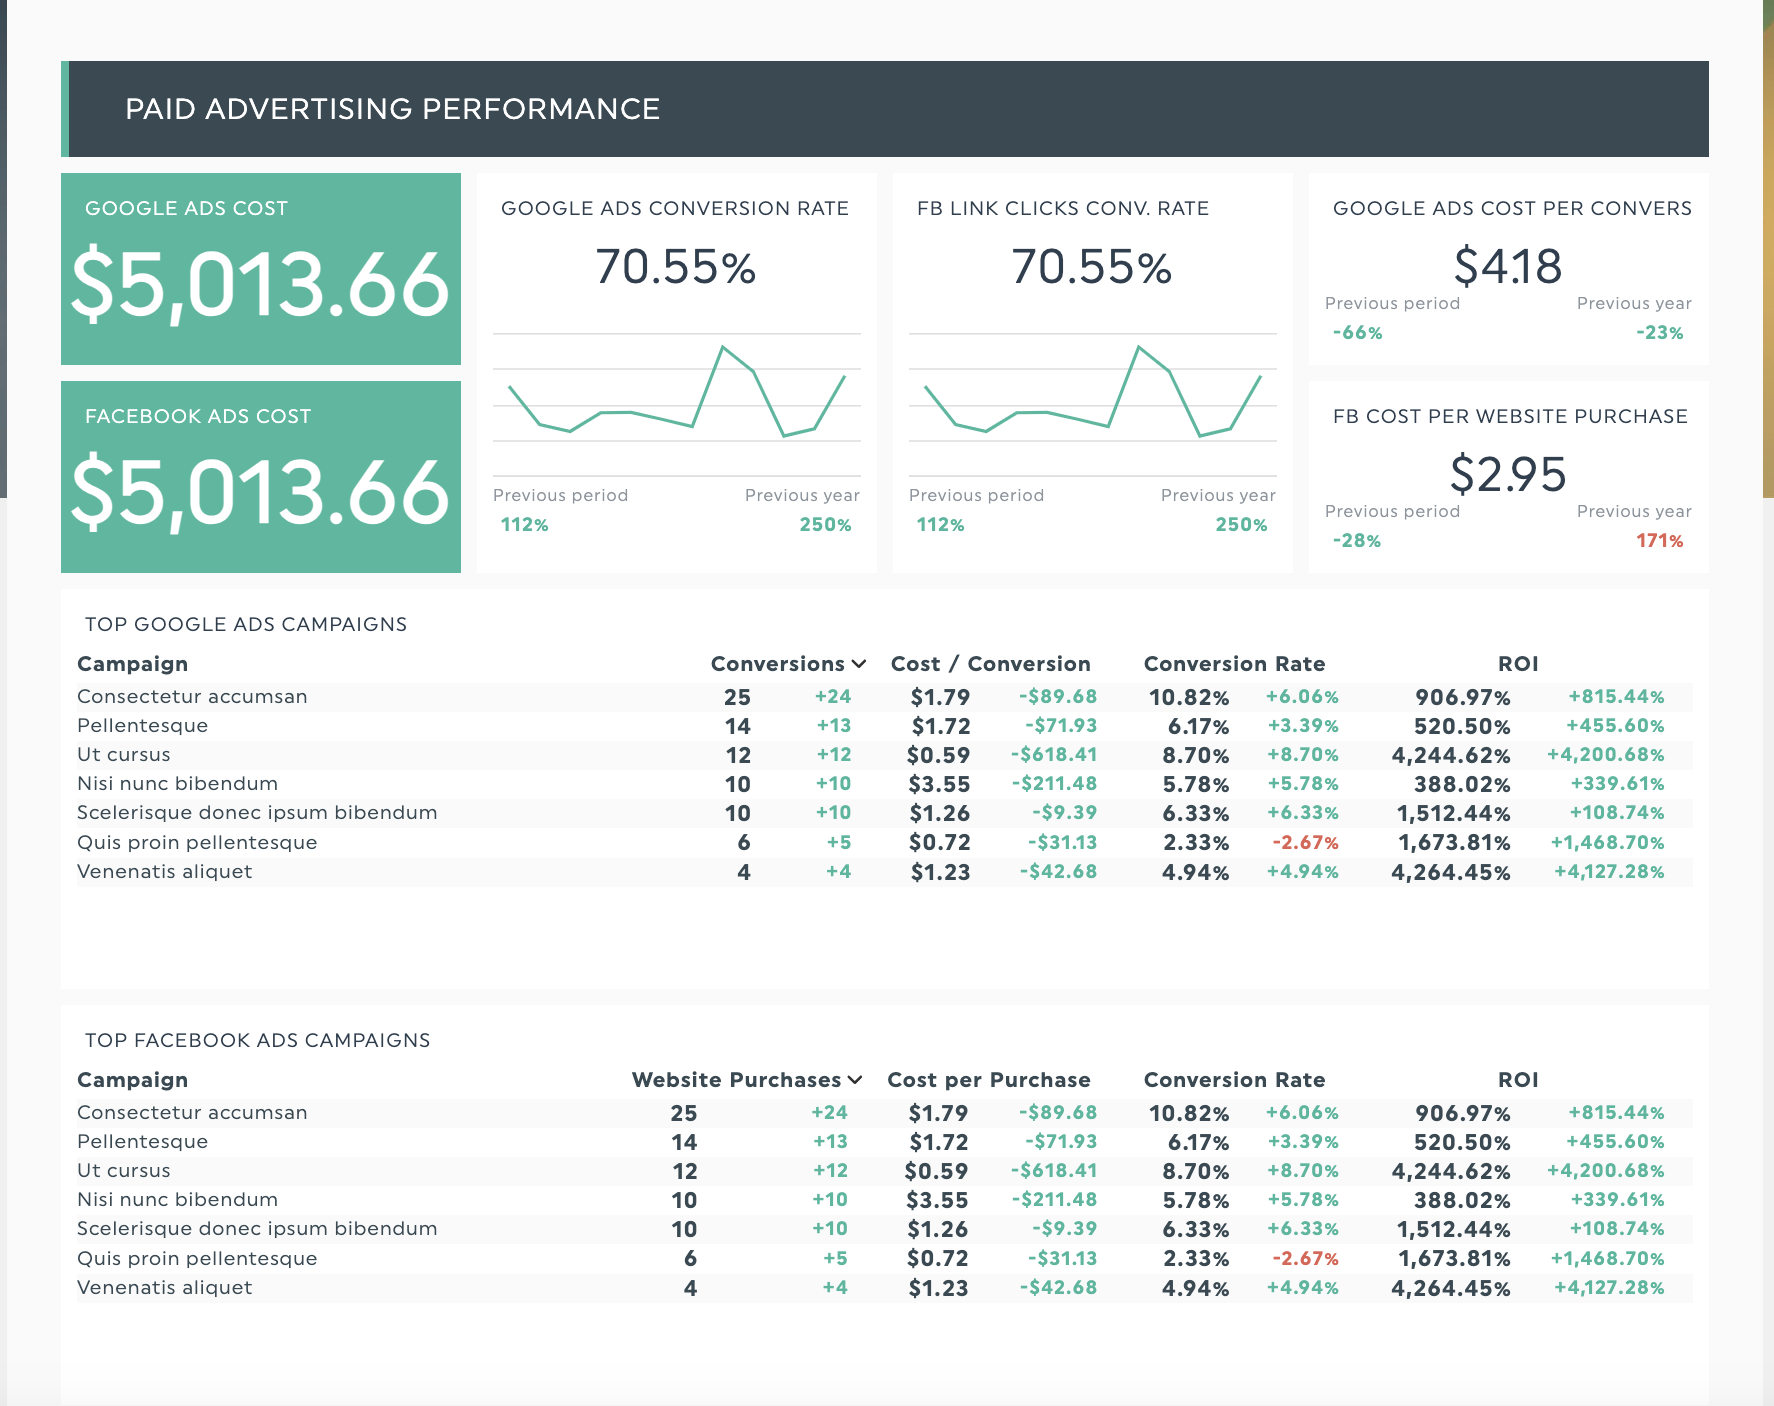
Besides the elements to include in your dashboard, pay attention to how you structure it. Alfred Christ of Robotime recommends using a hierarchical structure in your reports. Here’s his approach to designing dashboards.
“As I design a dashboard, my strategy would be to structure it in a way that tells a story: start from high-level metrics, drill down into specifics such as demographics and ad placements. The hierarchical approach of presentation makes sure that first, the big picture strikes the client, to then be able to focus his attention on details. Presentation aids include color-coding and visual indicators, which help in the rapid identification of trends and outliers.”
A hierarchical structure helps Alfred guide his clients through the reports. He elaborates further:
“I do this face to face, either physical or virtual, in a meeting where I walk them through the results. This helps me contextualize explanations of data, answer questions that may arise, and go through next steps. After the meeting, I send a summary of key points and recommendations; this ensures they have a clear roadmap going forward.”
CONDUCT REGULAR DASHBOARD REVIEWS
If you've followed all the previous steps, you'll have the tools to create a comprehensive ads dashboard for your campaign data.
That’s not all, though. Dashboards are living documents. So, it's worth reviewing them every week or on a monthly basis. During these reviews, aim to gather feedback from your client to see if it fits their needs. What do they like or dislike? Seek your clients' input on your dashboard and adjust as needed.
Automate your Meta ads reporting with DashThis
Streamline your reporting process by building a dashboard for your Meta ad campaigns. Dashboards will also make it easier to explain campaign results and get support for your recommendations. These valuable reporting tools will help your clients optimize their ads for brand awareness, sales, and leads.
Hopefully, this step-by-step guide has made building dashboards less overwhelming. While you’re at it, why not save even more time with report automation? Sign up for DashThis's 15-day free trial and follow the steps in this guide. Take advantage of automated reporting tools to save hours and focus your time where it matters—delivering quality insights that create results for your clients.

Create your own Meta ads dashboard today!
Read More

Don’t miss out!
Follow us on social media to stay tuned!
Automate your reports!
Bring all your marketing data into one automated report.
Try dashthis for free