8 Facebook Ad Metrics to Scale Traffic, Leads & Ad Spend

You spent hours designing the visuals, crafting the ad copy, and experimenting with different bidding strategies.
The last thing you need is running yourself bone tired from managing large volumes of data across dozens of clients.
And yet, that’s the reality of many marketers.
This guide recommends the quickest way to manage your reporting and some of the most important Facebook metrics you should measure today to improve your ad results.
- What are Facebook Ads Metrics?
- Top 8 Facebook Ads Metrics
- How to Create the Perfect Facebook Ads Report
- Automate Your Reporting with DashThis
What are Facebook Ads Metrics?
Facebook Ads metrics measure the performance of your paid ads on Facebook (e.g., number of clicks), so that you can improve results for the next campaigns, whether it’s driving more traffic, acquiring new leads, or scaling up your ad spend.
Why is it important to measure your Facebook Ads results?
It’s getting more expensive to run Facebook Ads.
Even though Facebook advertising is one of the most cost-effective channels in social media marketing, it can still burn a gigantic hole in your ad budget if you’re not careful.
A quick search shows it now costs an average of $11.09 to acquire a lead. Just three years ago, the average cost hovered only at $3.13.
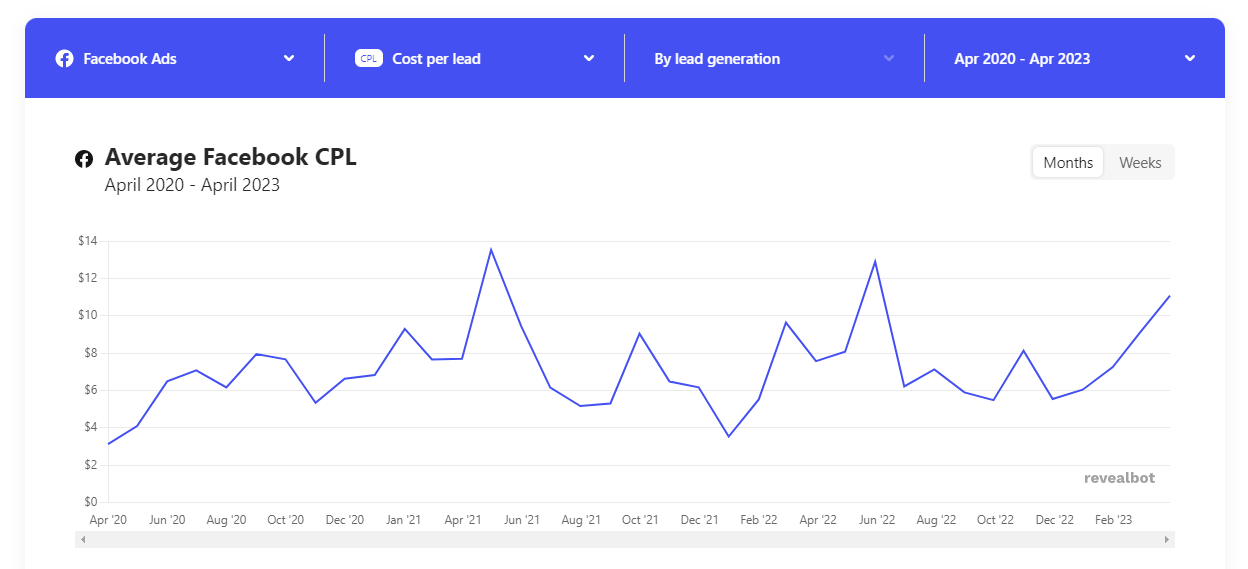
Source: Revealbot
This dramatic jump reminds us of the importance of making attribution a core part of Facebook ads monitoring.
By closely monitoring how users interact with your ad and improving them accordingly, you can achieve our campaign goals without compromising on ad spend.
Top 8 Facebook Ads Metrics
You’ve set the essential KPIs and installed the Meta Facebook pixel on your website, and you’re now ready to get cracking.
Here are the most important metrics you should measure in your Facebook ad account, all the way from brand awareness to retargeting for retention.
Audience Insights (gender, age, device)
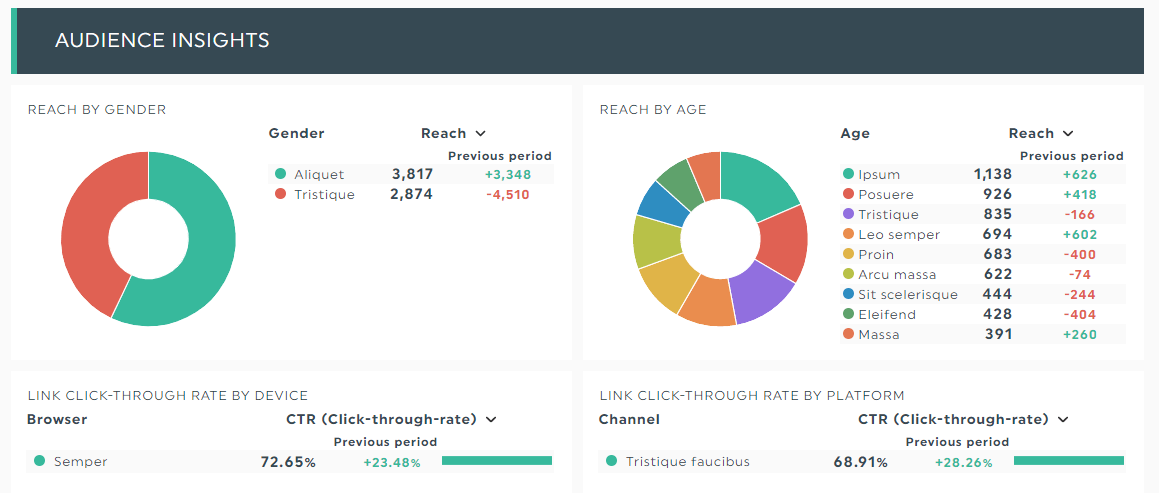
Customer research always starts with learning and your target audience demographics.
The Audience Insights metric looks at attributes about your current and potential customers on Facebook, including age, gender, location, job titles, interests, and the devices they’re using.
This Facebook Insights tool lets you access three main groups of Facebook users: people connected to your business page or event, custom audiences (made from current customers), and the general Facebook audience.
Impressions
Ad impressions is the number of times an ad appears on a user’s news feed for the first time.
Note that the number of impressions is counted the same way for Facebook video ads, even when the video is not played (excluding ads on Audience Network).
Measure it alongside post reach and frequency and CPM (cost per 1,000 impressions) to compare performances between different Facebook ad campaigns.
Ad likes and comments
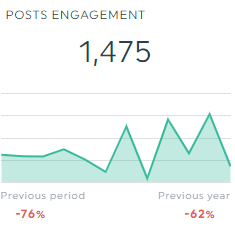
Post engagement, often touted as vanity metrics, actually plays a huge role in your ad and organic reach.
High number of likes and comments, which influence the engagement rate benchmarks, signal to Facebook that your audience finds value in your ads.
The more people engage with an ad, the more Facebook’s algorithm will increase its reach.
Cost per click
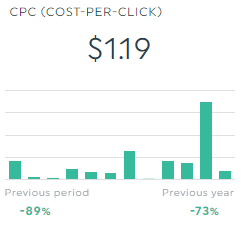
Cost per click (CPC), also known as pay per click (PPC), is the amount of money paid for every click on your ad.
It’s often tracked alongside click-through rate (CTR) and cost per action (CPA).
There are various factors that impact your CPC, such as the format (e.g., video ads), search terms, and bidding strategy.
Focus on increasing your conversion rate to reduce CPC (e.g., improving visuals for a lead generation campaign ad with low CTR and high ad relevance might bring down CPC).
Return on ad spend
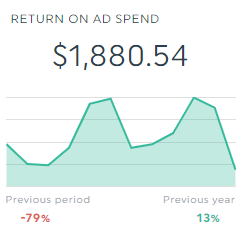
Return on ad spend (ROAS) is the amount of revenue a company gets for every dollar it spends on Facebook Ads.
It’s one of the most common Facebook Ads metrics in e-commerce.
Conversion rate
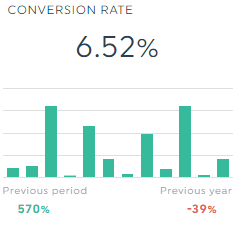
Conversion rate refers to the percentage of Facebook users who have completed a desired action (e.g., completing purchase during checkout in a retarget campaign).
Highlight this metric alongside conversion value, link clicks, CPC, and ad spend to paint a complete picture of your overall campaign performance.

Ad relevance
Ad relevance diagnostics (a new metric that replaced ad relevance score) determines if your ads are relevant to the targeted audience.
This metric involves diagnosing under-performing ads across quality ranking, engagement rate ranking, and conversion rate ranking.
Aim for an average or above ranking to ensure that your ads are meeting the campaign objective.
Ad spend
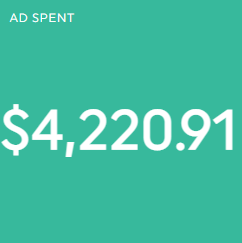
Ad spend is the total amount of dollars spent on Facebook Ads.
There are multiple ways to reduce ad cost, like using Facebook’s optimization tools to expand your audience and broaden your ad reach.
How to Create the Perfect Facebook Ads Report
Managing a single Facebook Ads campaign is stressful enough.
With up to 50 ads in each ad set in a regular Facebook Ads Manager account, it’s only a matter of time you get overwhelmed by the sheer volume of data.
And we’re only talking about an ad set in a single Facebook page!
Imagine what it’s like for a Facebook analytics agency with dozens of accounts across hundreds of clients. *inserts dizzy face emoji*
If you’re wondering how to measure Facebook ad performance across the client base without losing more hours of your sleep (and sanity), this section will help.
DashThis is an automated reporting tool that gathers all your marketing data across multiple channels into one crazy, beautiful report.
Here’s how this works:
- Select a Facebook Ads Reporting template
- Connect your Facebook Ads account with DashThis (note: make sure you have an Analyst role)
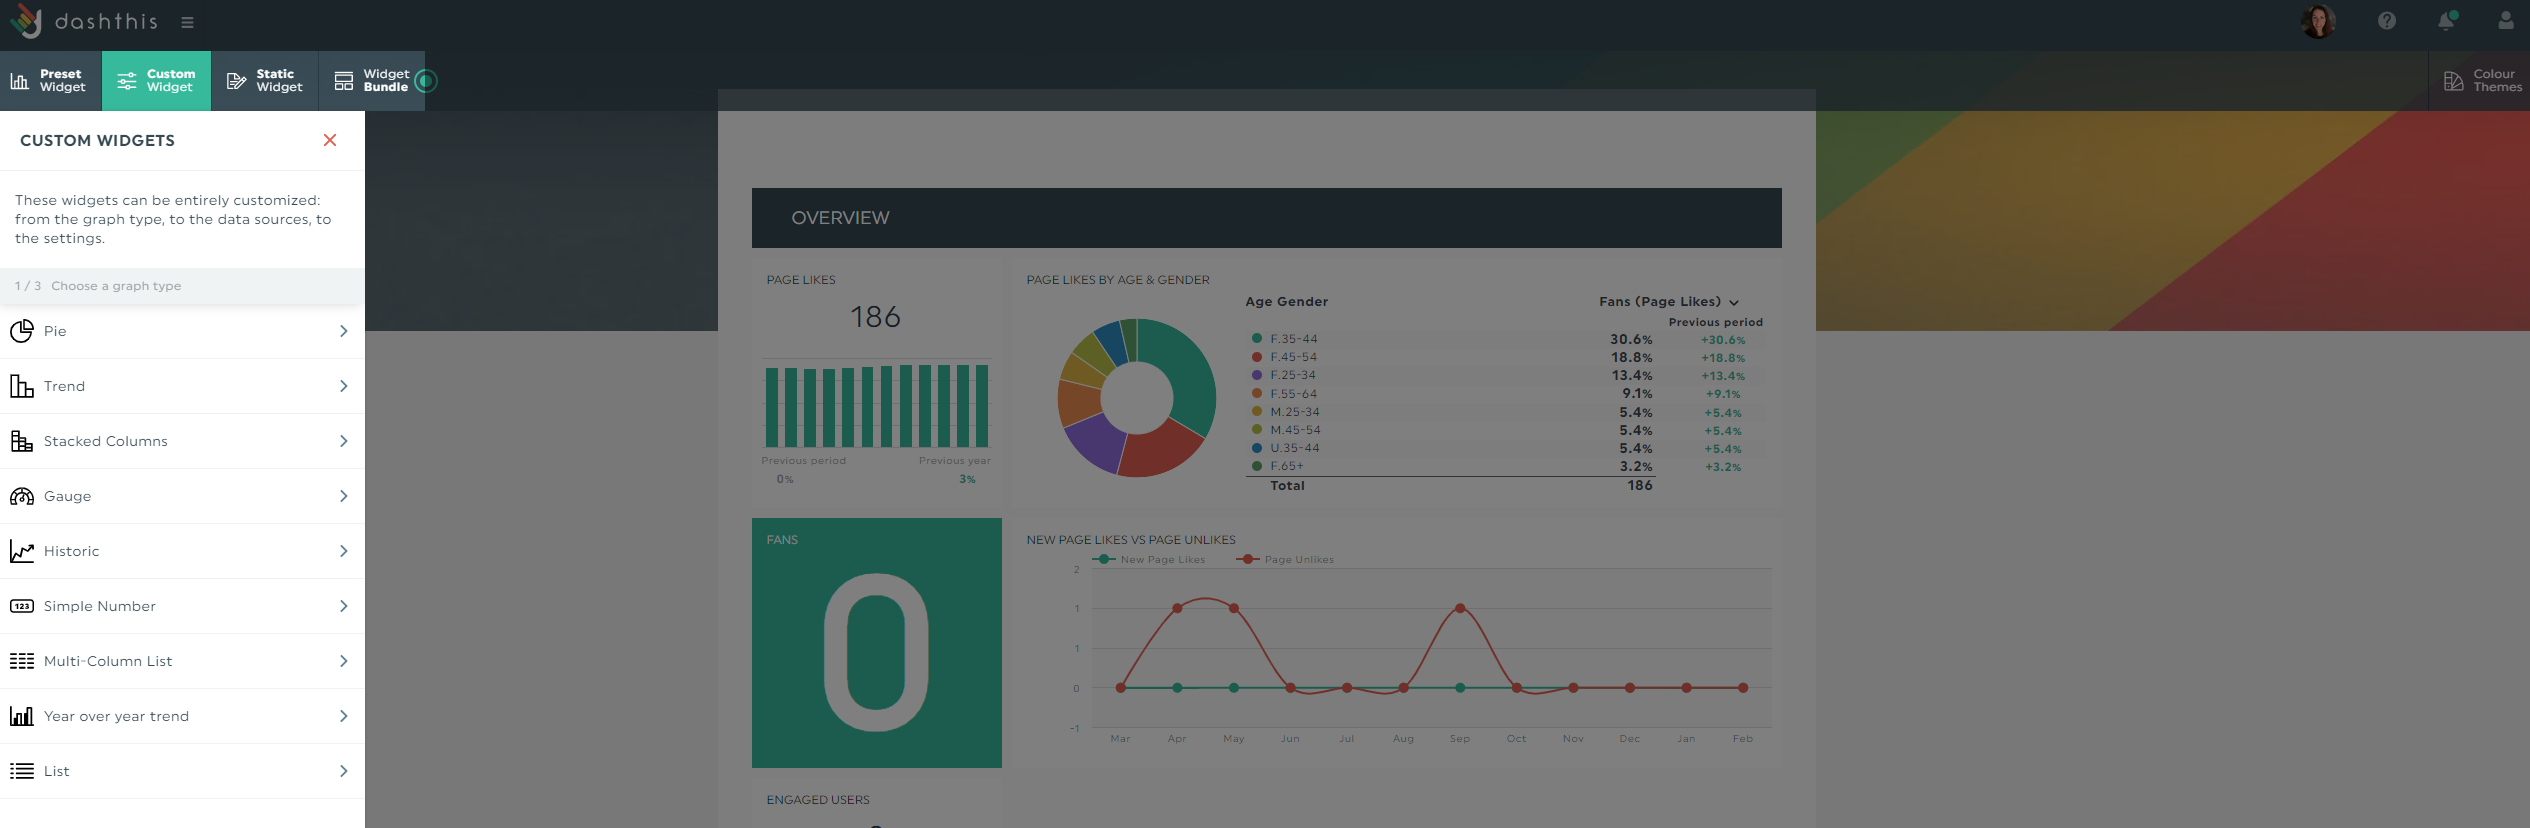
- Select metrics in Preset Widgets
Once clicked, DashThis will proceed to gather your Facebook Ads metrics automatically.
Drag and drop them as you desire (pro tip: if you don’t see a metric you’re looking for, simply create your very own custom metric in Custom Widgets).
DashThis is built for busy marketers in mind.
You can also quickly share your analysis within the report.
Click Static Widgets > Add Comment for recommendations for the next quarter’s campaign.
Or hover to a widget and click Add Note to provide more context around an erratic metric.
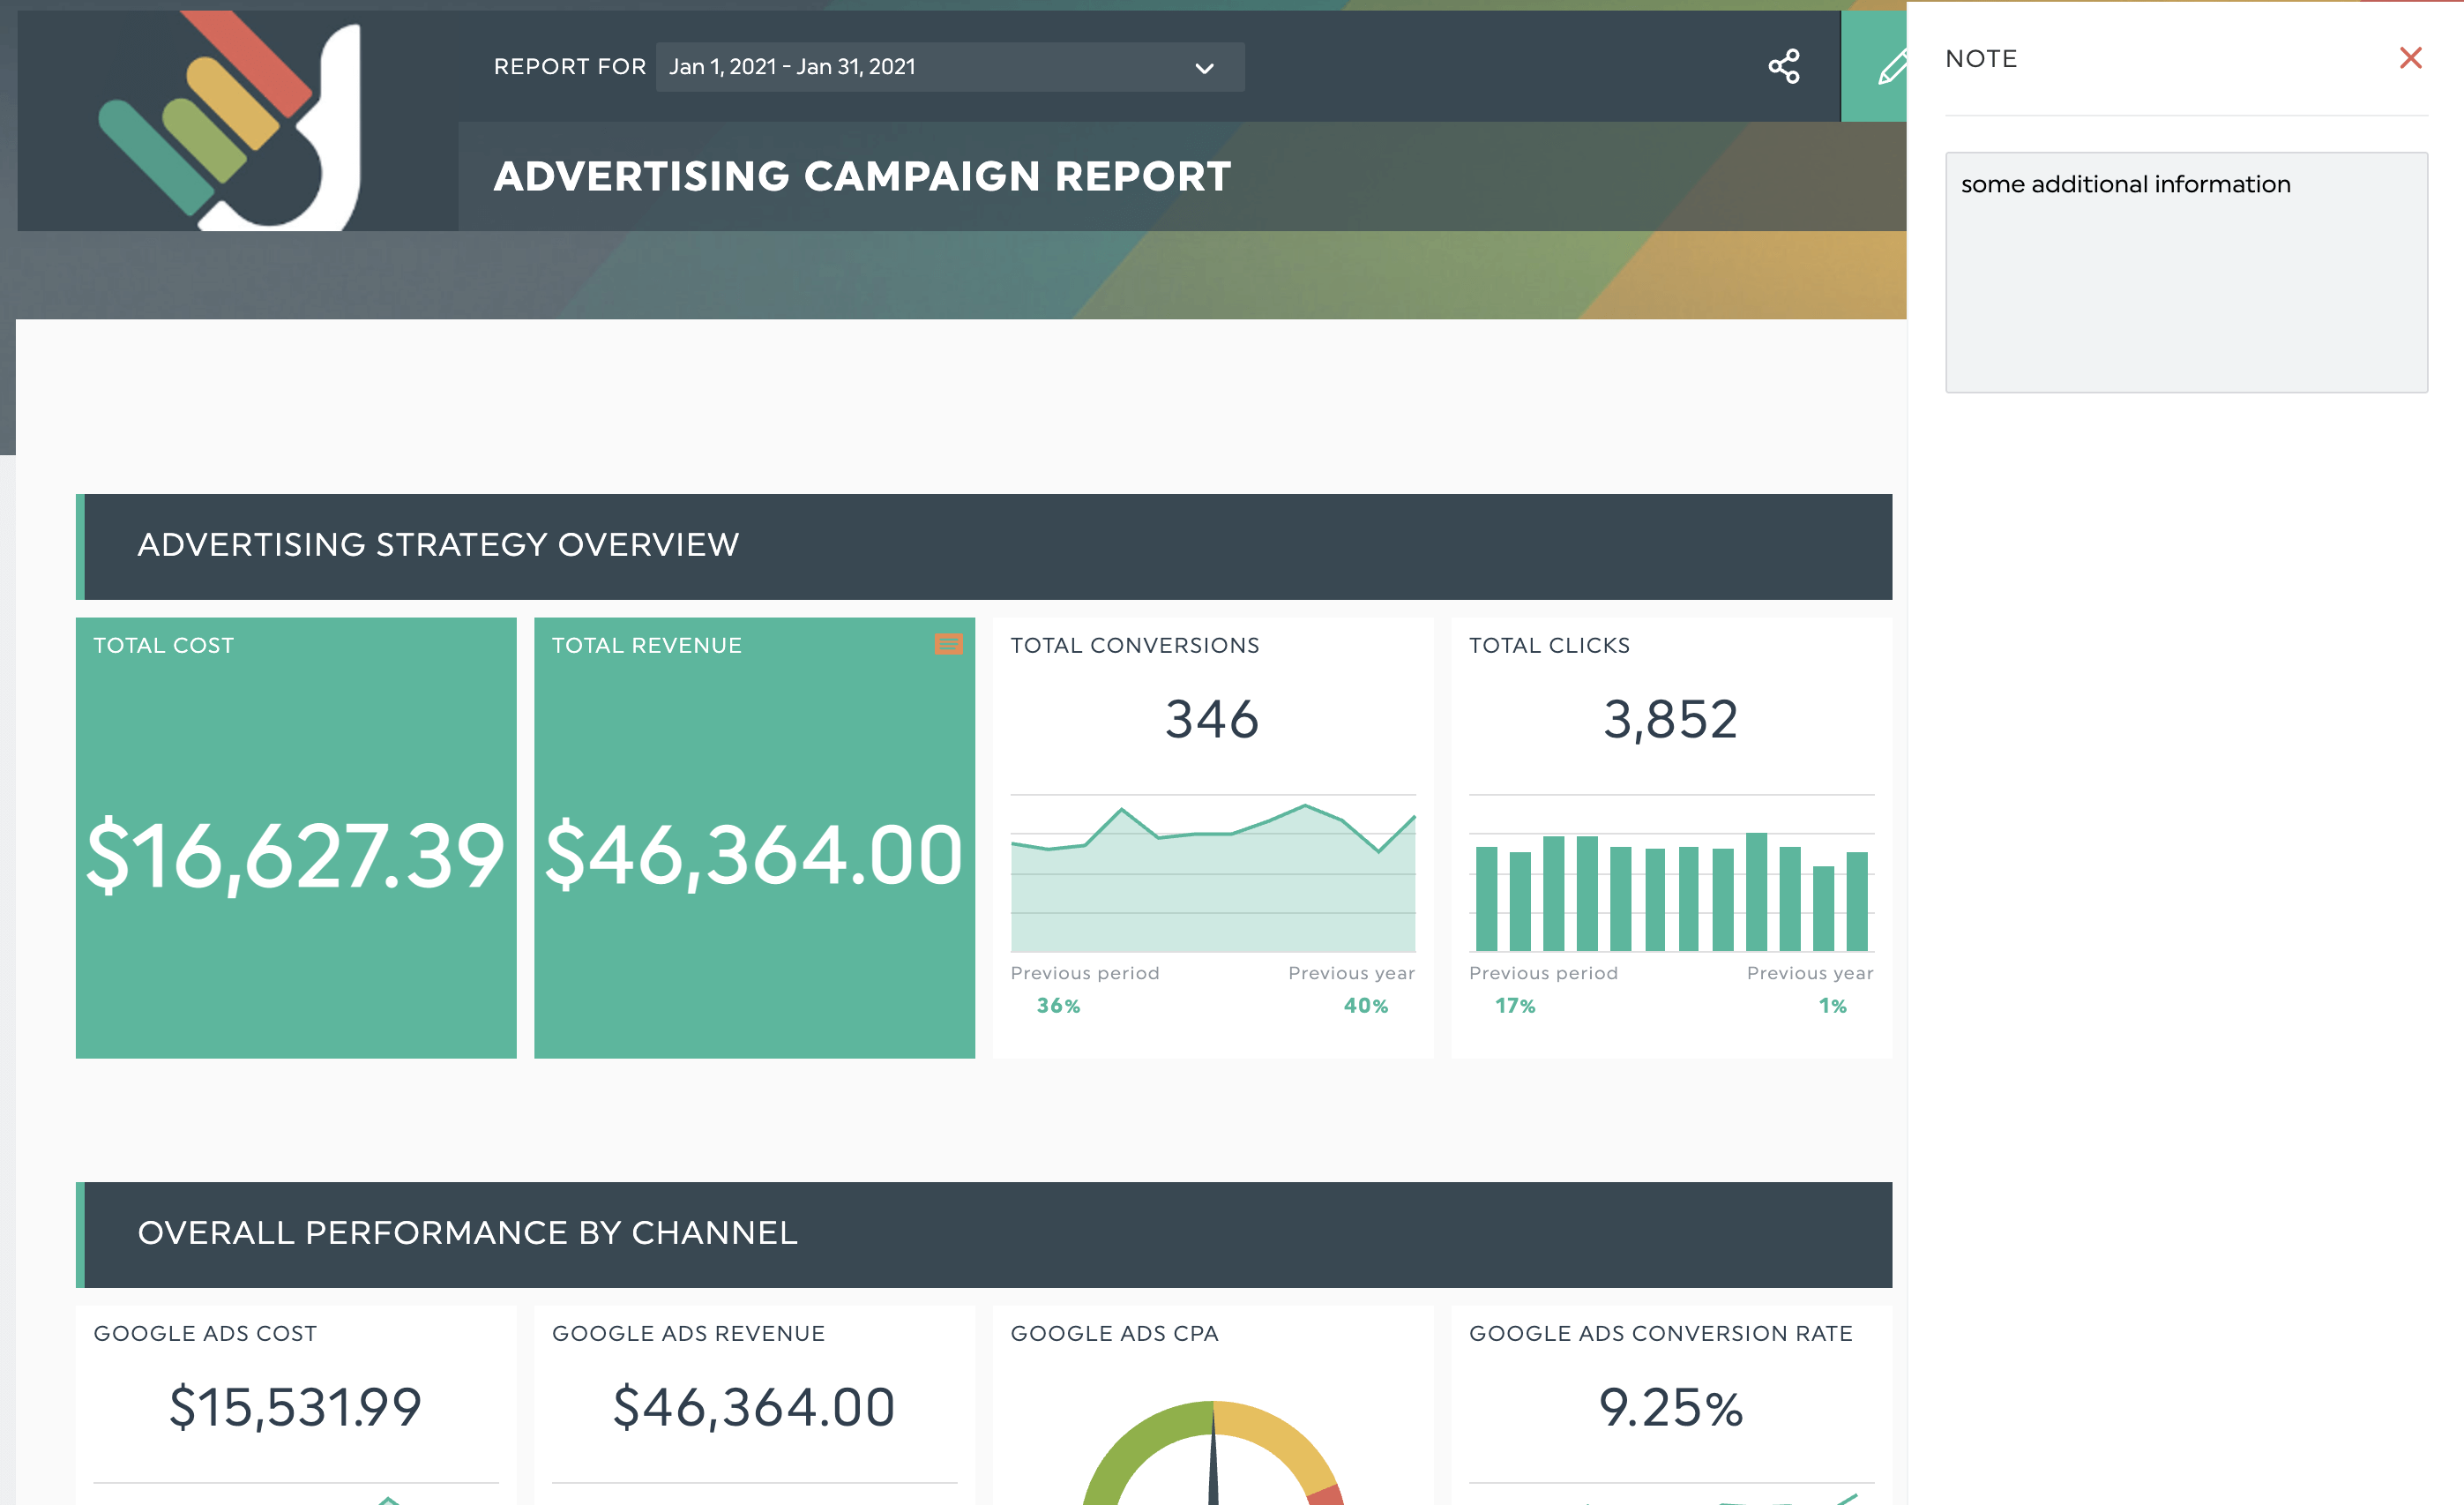
Your note will appear as an orange icon in view mode
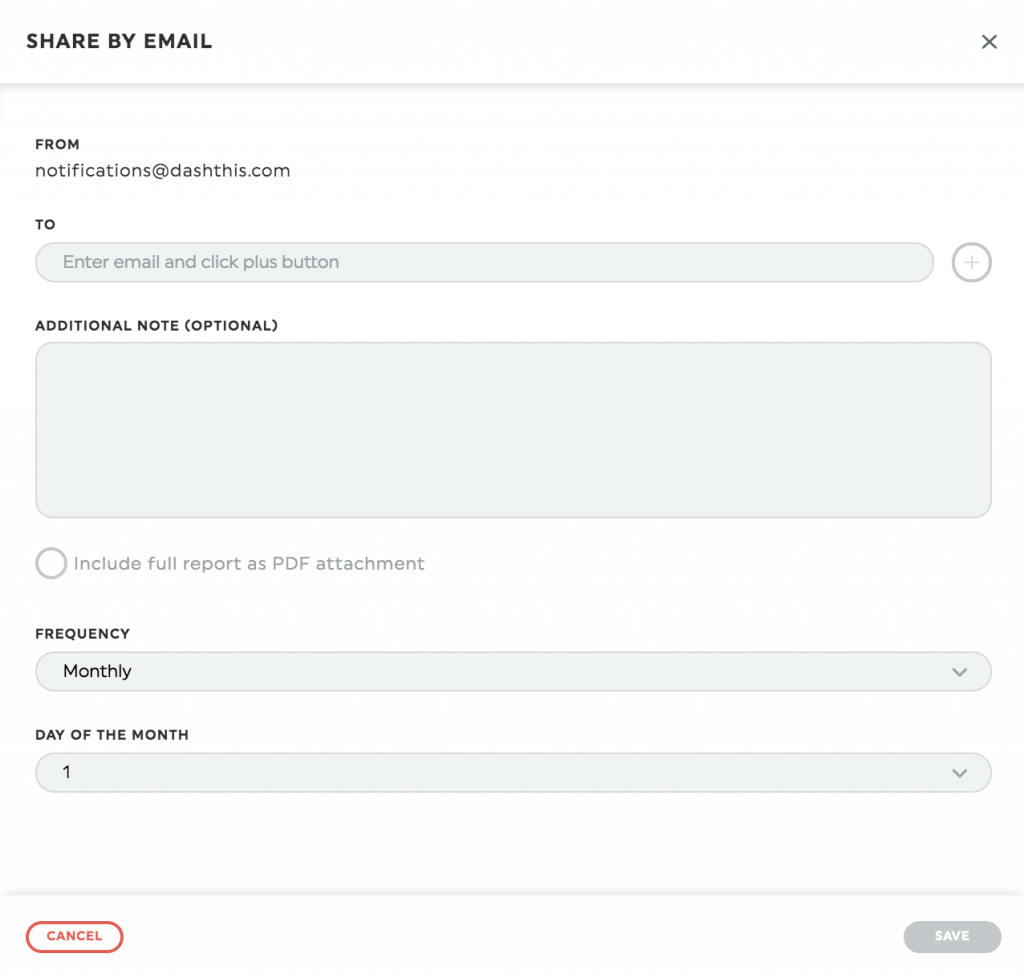
Once you’re done, send all stakeholders a shareable URL link to let them view the report in real-time.
Or schedule an automatic email dispatch without leaving the platform.
Start your free 15-day trial on DashThis today.
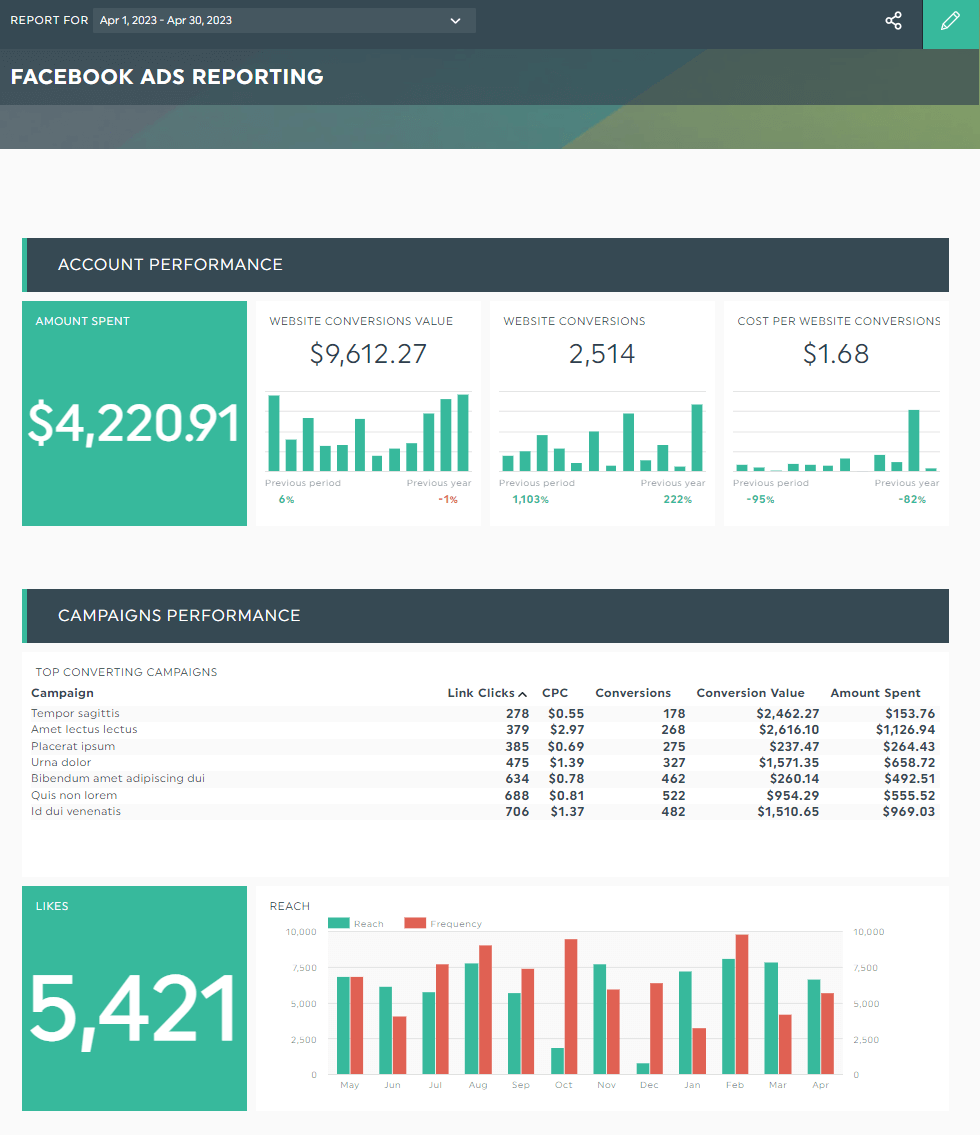
Facebook Ads Report Template
Successful Facebook Ads performance boils down to three main factors: targeting and audience, landing page, and the type of content in your ad (a.k.a. ad creative).
Running an A/B test to uncover the winning image, ad copy, audience, and ad placements? This template will help you
Highlight Facebook metrics across different ad variations, engagement metrics of a specific ad, total number of link clicks per Facebook post, page likes, and more with the template below.
Grab this Facebook Ads dashboard with your own data!
You can also gather key metrics from other marketing channels within this report. Referral traffic from an SEO tool, conversion rate from other social media platforms like LinkedIn...it's totally your call.
Say you want to connect your Facebook Ads report with Google Analytics to analyze user behavior in the post-ad experience.
All you have to do is click a few quick buttons and let our tool do the rest.
DashThis will automatically create a graph that compares link clicks with landing page views to track the number of people who reached the landing page.
Automate Your Reporting with DashThis
Despite the increasing costs of Facebook Ads, this behemoth social network remains a top choice to drive traffic, acquire leads, and boost sales in every professional’s digital marketing strategy.
The success of your Facebook marketing campaigns boils down to many factors, including the metrics you’re measuring, creative assets, and the tools you’re using.
DashThis automatically gathers your data across multiple marketing analytics tools into one beautiful report.
Pricing starts at $44/month when billed annually.
Start your free 15-day trial to track your Facebook Ads, create dashboards in the blink of an eye, and gain back hours of your time today.

Start tracking your Facebook ads metrics with Dashthis
Read More

Don’t miss out!
Follow us on social media to stay tuned!
Automate your reports!
Bring all your marketing data into one automated report.
Try dashthis for free