Metrics Analysis : What Counts is How You Look at Them

Metrics analysis shouldn’t take hours of your time.
As busy marketers, your time is better spent on value-adding activities, like content creation and optimization.
Want to gain back hours of your time? It all starts with selecting the right metrics, keeping yourself on track and accountable, and automating your reporting in the blink of an eye.
Let’s get started.
- What are Metrics?
- What is the difference between KPIs and Metrics?
- Best Practices for Identifying the Right Metrics
- How to Perform Metrics Analysis?
What are Metrics?
Metrics are data points that monitor the progress of a company’s business objectives.
Often, marketers track metrics automatically via reporting software tools.
These tools usually sport pre-made templates with eye-catching graphs and charts, like the one you see below.
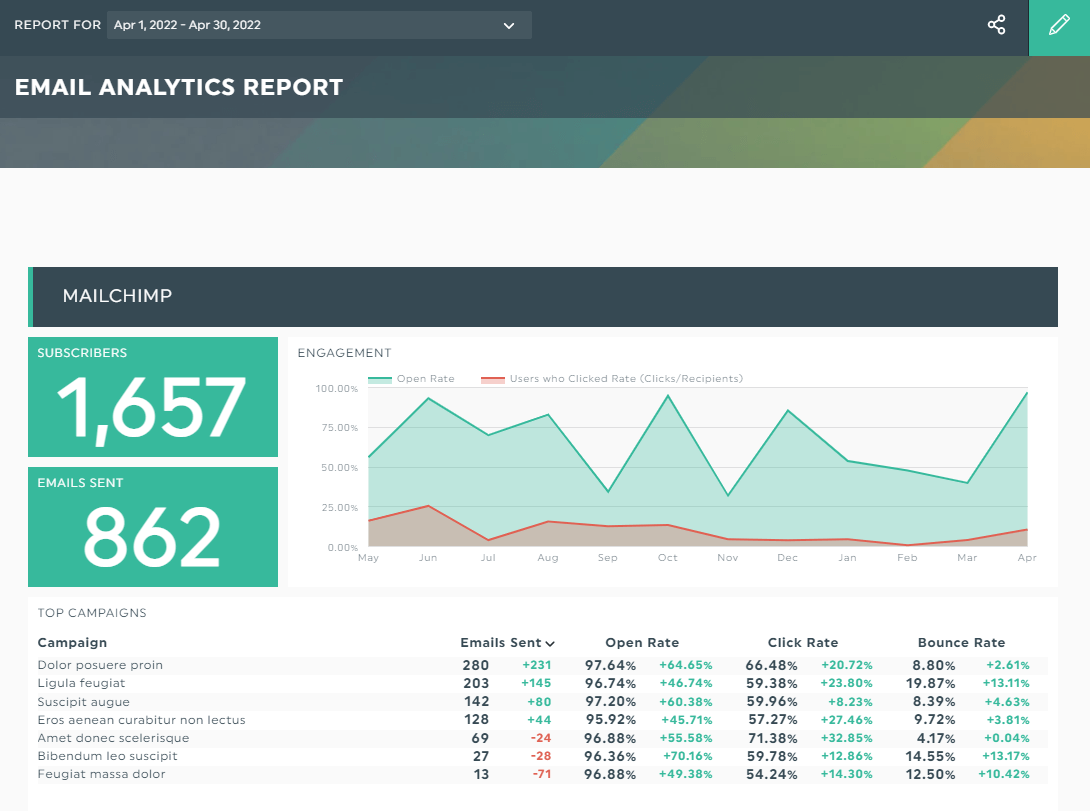
Grab this email report with your own data!
With an email analytics dashboard like this at your fingertips, you can improve your email campaigns with no guesswork.
DashThis gathers all your data from multiple sources into one beautiful automated dashboard automatically, saving you hours of time and streamlining your reporting workflow. Start your 15-day free trial today.
What is the difference between KPIs and Metrics?
Key performance indicators (KPIs) and metrics are frequently used interchangeably.
And it’s not hard to see why.
Both quantitative measurements track how far along you are in hitting your goals. However, there is one big difference that sets these two data points apart.
While KPIs are tied directly to your business goals, metrics are tied to the process of achieving those goals.
For example, if you want to earn $1 million in revenue for your SaaS startup, you'd pick annual recurring revenue (ARR) as your KPI.
Now, to ensure that you’re heading in the right direction, you might gather your department heads to align your shared metrics:
- Marketing: Number of backlinks, number of marketing-qualified leads (MQLs), keyword ranking
- Sales: Number of sales-qualified leads (SQLs), lead-to-win rate, customer retention
- Product: Number of product-qualified leads (PQLs), feature adoption rate, monthly active users
- Customer success: Churn rate, number of onboarded users, number of new customers within the last month
These performance metrics gauge how each department contributes to your revenue growth and uncover hidden revenue opportunities (e.g., a high churn rate and low feature adoption rate might mean a problem in the product).
For Sandeep Kashyap, CEO & founder of Proofhub, tracking his KPIs helps his team know if the strategy is working. “If you’re not tracking your KPIs and making adjustments as needed, then you might be wasting time and money on things that aren’t getting the results you want.”
This reinforces what Gaurav Sharma thinks, CEO & Founder of Attrock.com: For him, "KPIs are the parameters on which you measure the success or failure of your initiatives in achieving the desired goals. That makes tracking KPIs is as important for marketing campaigns as salt is for food."
Regardless, both KPIs and metrics hold equal weight in importance and you need both quantitative measurements to hit your goals.
Best Practices for Identifying the Right Metrics
Automated reporting tools like DashThis boast pre-made templates with preset widgets, saving you the hassle of handpicking your KPIs and metrics.
However, the job is only half-done.
After narrowing down the type of metric to focus on in your KPI analysis, you need to keep yourself accountable.
Our favorite approach is using SMART goals, a goal-setting approach (which stands for Specific, Measurable, Attainable, Relevant, Time-based) that helps you gain clarity and work towards your metrics within a time frame.
Specific
Vague goals lack direction.
They fail to paint a distinct picture of what you want to achieve and often lead to underwhelming outcomes.
The next time you set metrics in your marketing campaign, zero in on the details to keep your team accountable.
Example: “Grow the number of monthly SQLs with the marketing, sales, and customer success teams by creating conversion-focused content, including blog posts, social media, and email drip campaigns.”
Measurable
Your key metrics and KPIs track your progress and determine how close or far off you’re in hitting your goals.
What’s the most important metric that will ensure that you’re making progress? What’s the one metric that will have the biggest impact on your marketing efforts?
Example: “Increase email engagement (0.5% unsubscribe rate, 5% click rate, and 2% conversion rate) and a 30% customer satisfaction rate.”
Attainable
Most goals are ambitious… and exaggerated.
They push you to the extreme end of your abilities, cause burnout and self-doubt, and lead to disappointing results.
Be honest with your team. Set achievable goals that are within your limits.
Example: “Increase our monthly SQLs by 20% with our five-person sales team.”
Relevant
Do your metrics align with your business objectives?
To set goals worth your time, focus on metrics that fit your unique use case. For instance, an infant product-led growth (PLG) startup probably shouldn’t focus on the growth rate metric, as PLG businesses typically have lower growth rates until they cross the $10 million ARR mark.
Example: “Hit at least 500 product-qualified leads (PQLs) every month for our PLG business.”
Time-based
And finally, set a time period to push yourself to hit your target. If it’s a bigger goal (e.g., a whopping ARR target), you’d probably need a set of milestones to get the momentum going.
Example: “Achieve $200K monthly recurring revenue by Q3 of 2022.”
How to Perform Metrics Analysis?
Before automation, data analysis metrics took a long time.
Agency marketers would have dozens of tabs on their screen, manually clicking through each of them to copy-paste mind-numbing data into spreadsheets.
And that’s just for one client. Imagine doing these insane tasks for dozens of clients every month.
Fortunately, manual reporting is a thing of the past. With reporting software development tools, you can create reports quickly and analyze your results at a single glance.
Here’s how you can get started:
We’ll show you how it works using this KPI analysis example as a guide.
- Select a pre-made report from our 30+ template library
- Connect your favorite marketing tools
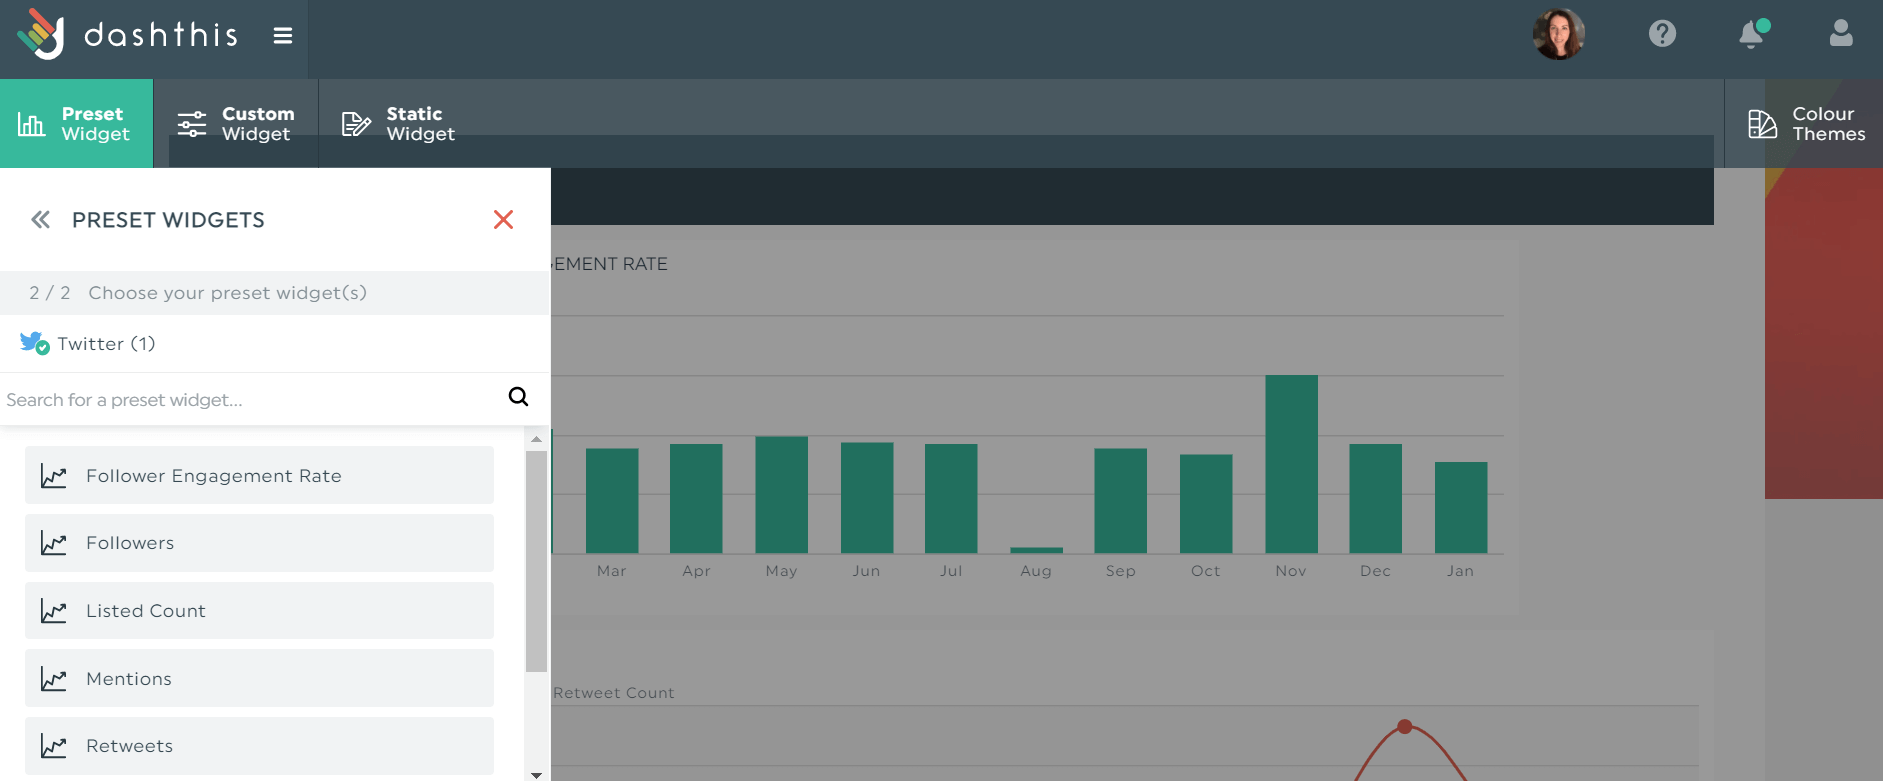
- Pick your metrics in Preset Widgets
DashThis will proceed to gather data from the relevant channels. Drag and drop the metrics for a cohesive look.
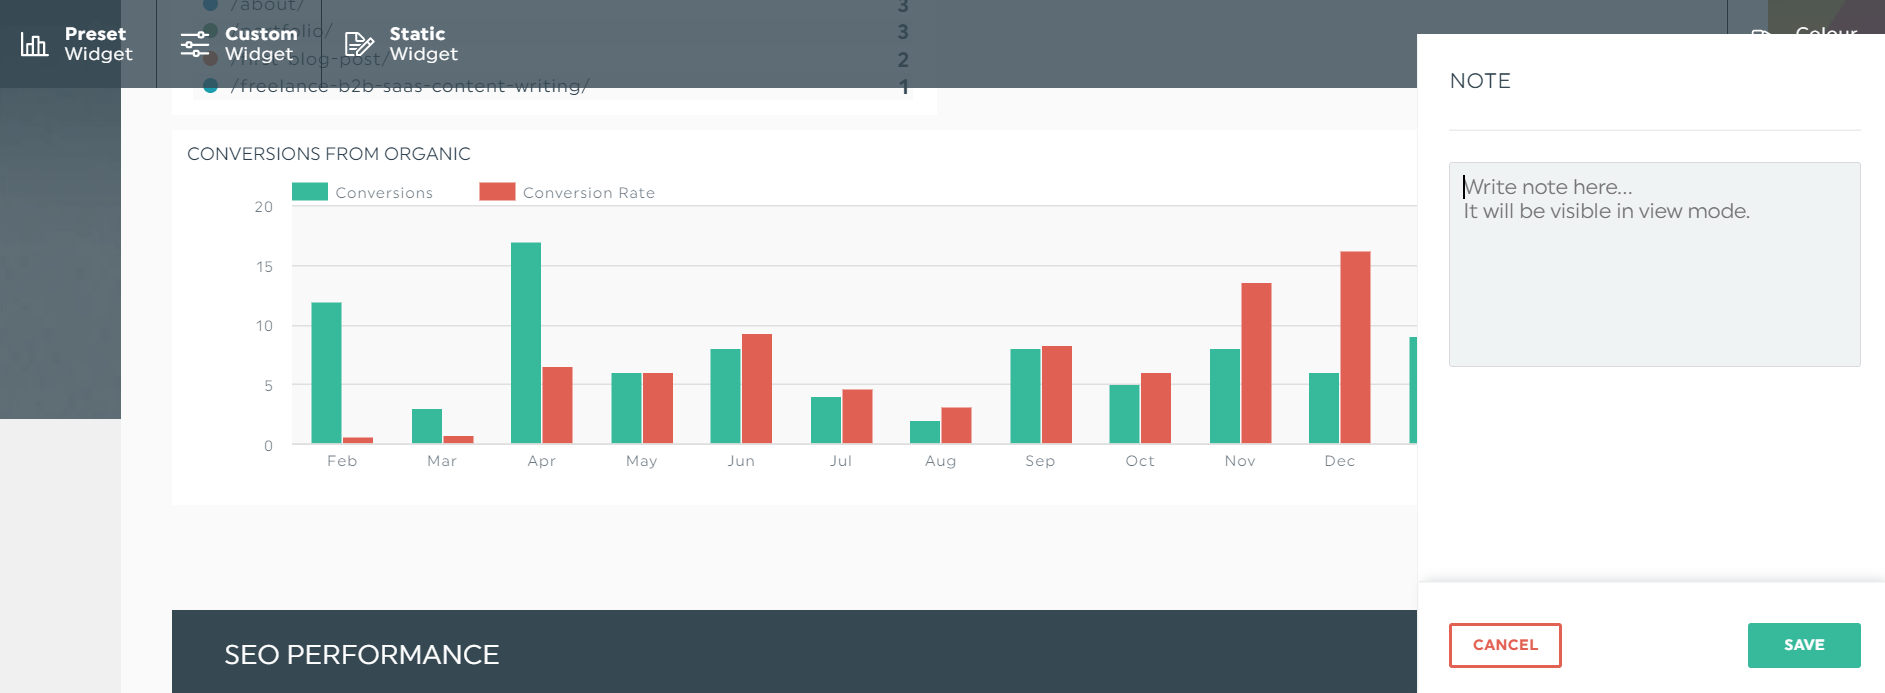
Add notes within the dashboard to explain your results to clients without marketing expertise. Hover to the widget and click Add Note > Save. Clients can access your note by clicking the orange tab in view mode.
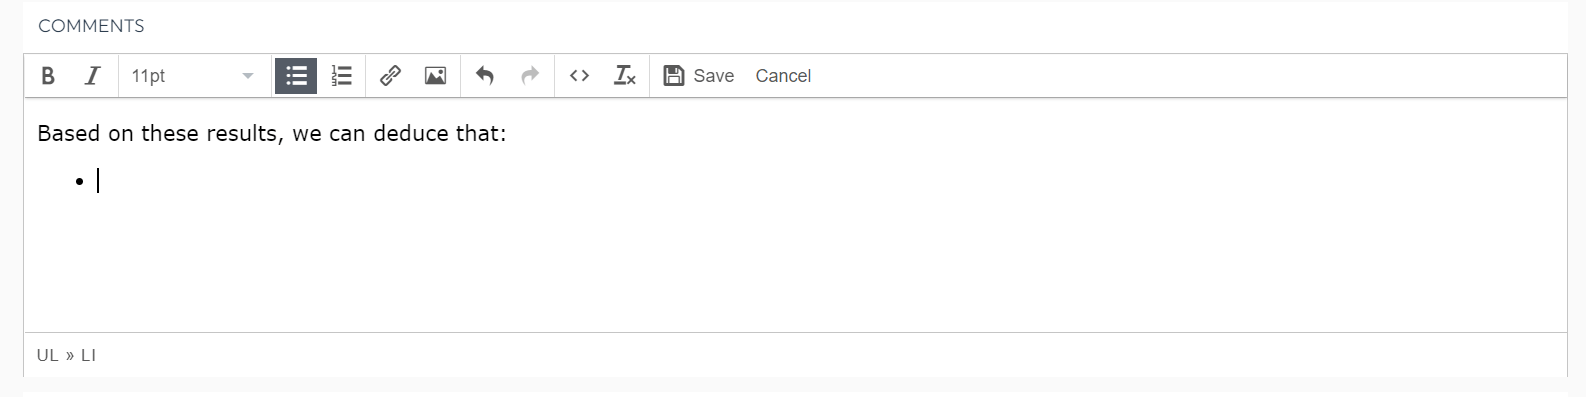
And finally, include a comment at the bottom of your report to recommend the next steps. You can do this quickly without leaving our dashboard manager. Click Static Widget > Comments to share your insights.
After customizing the report to your client’s branding, schedule it via email dispatch. Better yet, share it via a URL link for them to have real-time access.
Now that you’ve finalized your metrics list and understand the ABCs of reporting, conduct your metrics analysis with an automated tool like DashThis.
Our automated marketing reporting tool gathers all data from numerous marketing channels into one customizable dashboard. Grab your free 15-day trial of DashThis today to save hours of your time and create reports in the blink of an eye.

Ready to automate your reporting?
Read More

Don’t miss out!
Follow us on social media to stay tuned!
Automate your reports!
Bring all your marketing data into one automated report.
Try dashthis for free