9 Top Business KPIs To Measure Your Effectiveness In 2024 (Updated)

What is the actual state of your business?
It's easy to lose sight of how your business or campaigns are doing when you have much to do as an employee or a business owner.
That’s where key performance indicators (KPIs) come in.
KPIs aren’t just for assessing individual performance. It’s also an important measure of whether your efforts contribute to business success.
Setting clear KPIs can act as motivational targets and aid decision-making.
Let’s walk through what this process looks like.
What are business KPIs?
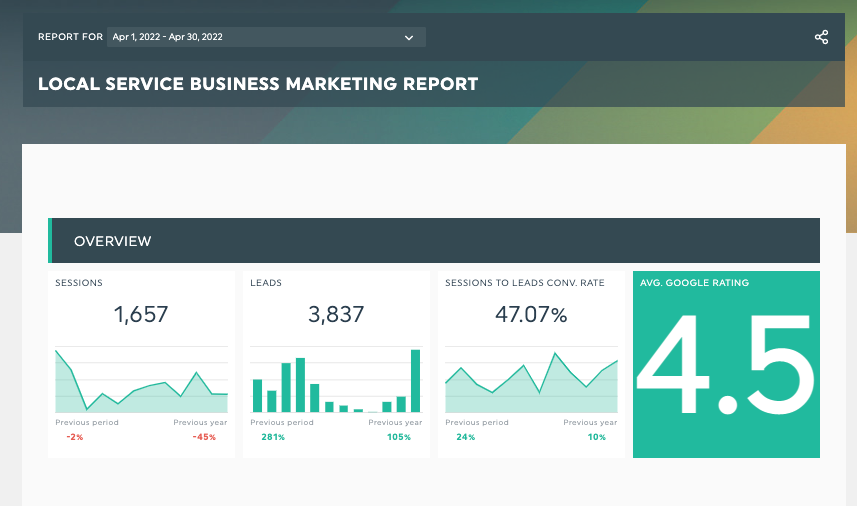
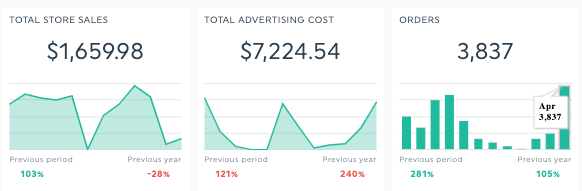
DashThis’s marketing reporting template for small businesses. See this template with your data.
Business KPIs measure how well your business is performing against set objectives. They also act as targets to motivate your team to reach a milestone.
Although KPIs are motivational targets, they are more than that. Teams and management can also use them to determine what is and isn't working.
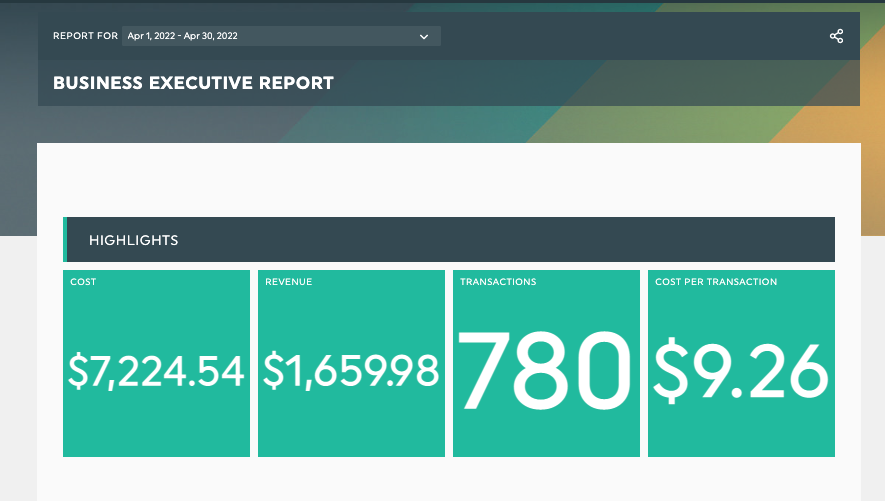
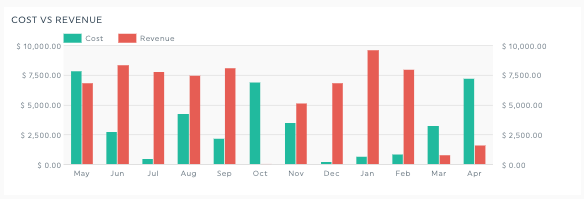
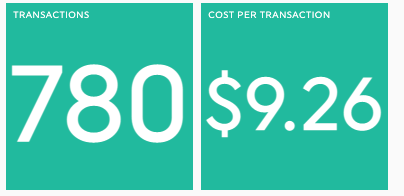
Dashthis’s KPI report for busy business executives. Get this with your own data.
How to find the best KPIs for your business
There are countless KPIs out there, and there is no way to measure everything without losing effectiveness. So, which are the right KPIs, you may wonder?
To streamline things, evaluate your business’s strategic goals, your business needs for the next 3-6 months, and which metrics you should use to measure progress.
Assign two to four important KPIs per objective based on these business objectives.
For example, if your business goal is to increase revenue from a specific product, consider tracking:
- The ratio of profit to revenue
- Sales growth rate
- Net profit margin
Remember, keep it simple!
How to track your essential business KPIs in DashThis
Step 1: Sign up for an account with DashThis (your first 15 days are on us!)
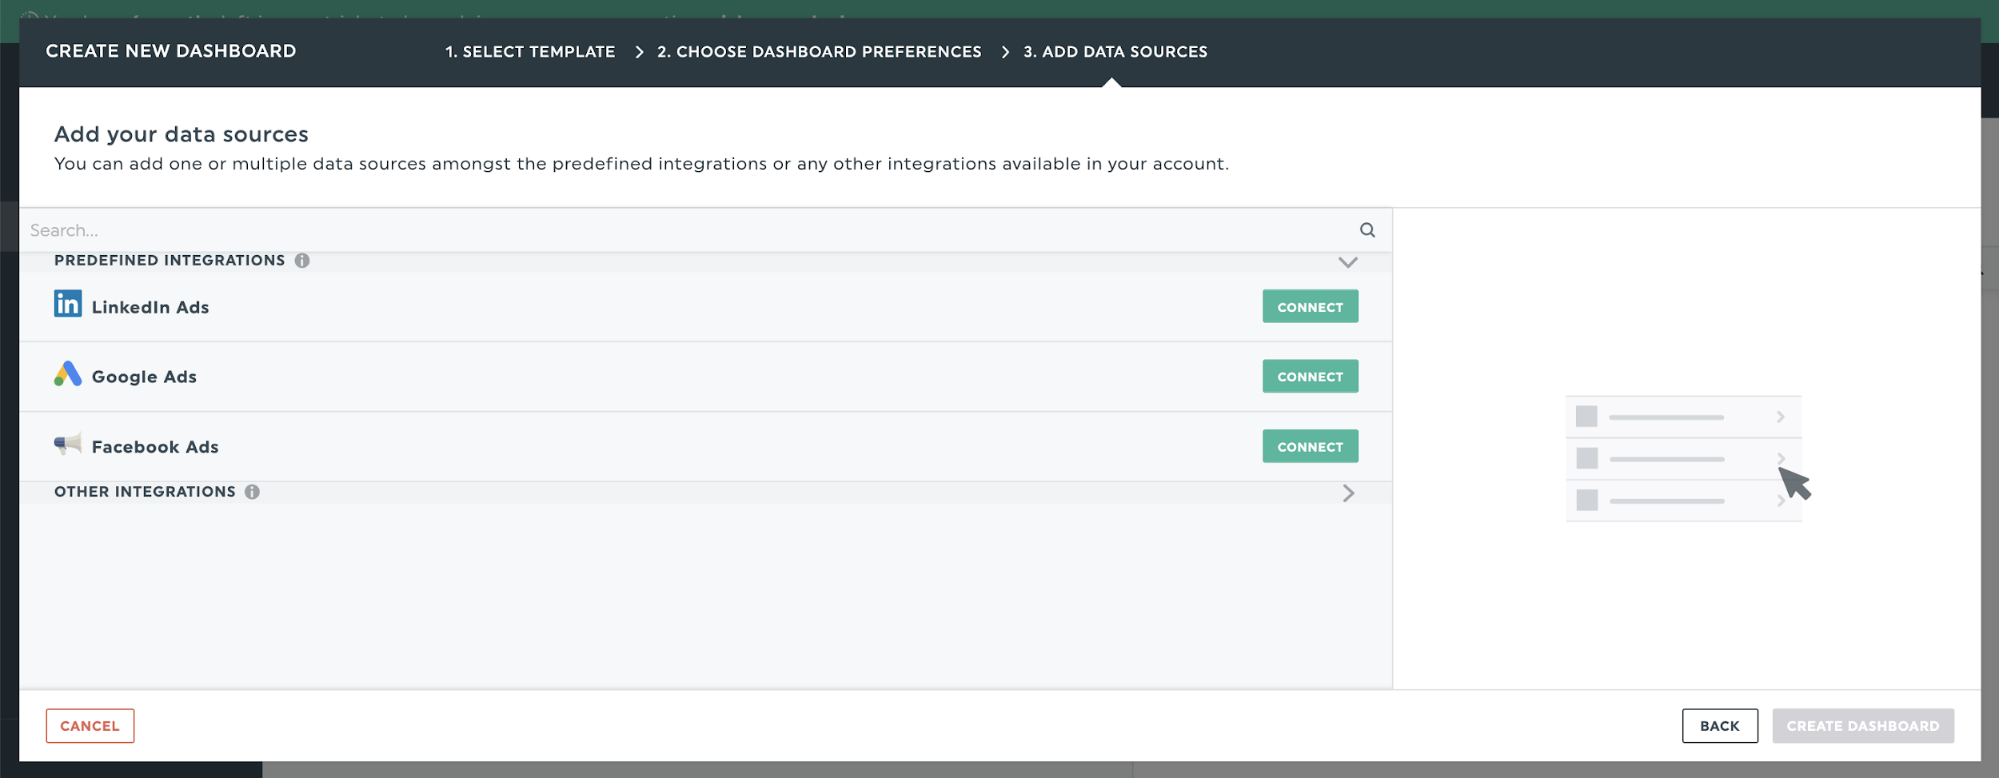
Step 2: Connect your favorite marketing tools in seconds (we support over 40 integrations with top-rated marketing and advertising tools
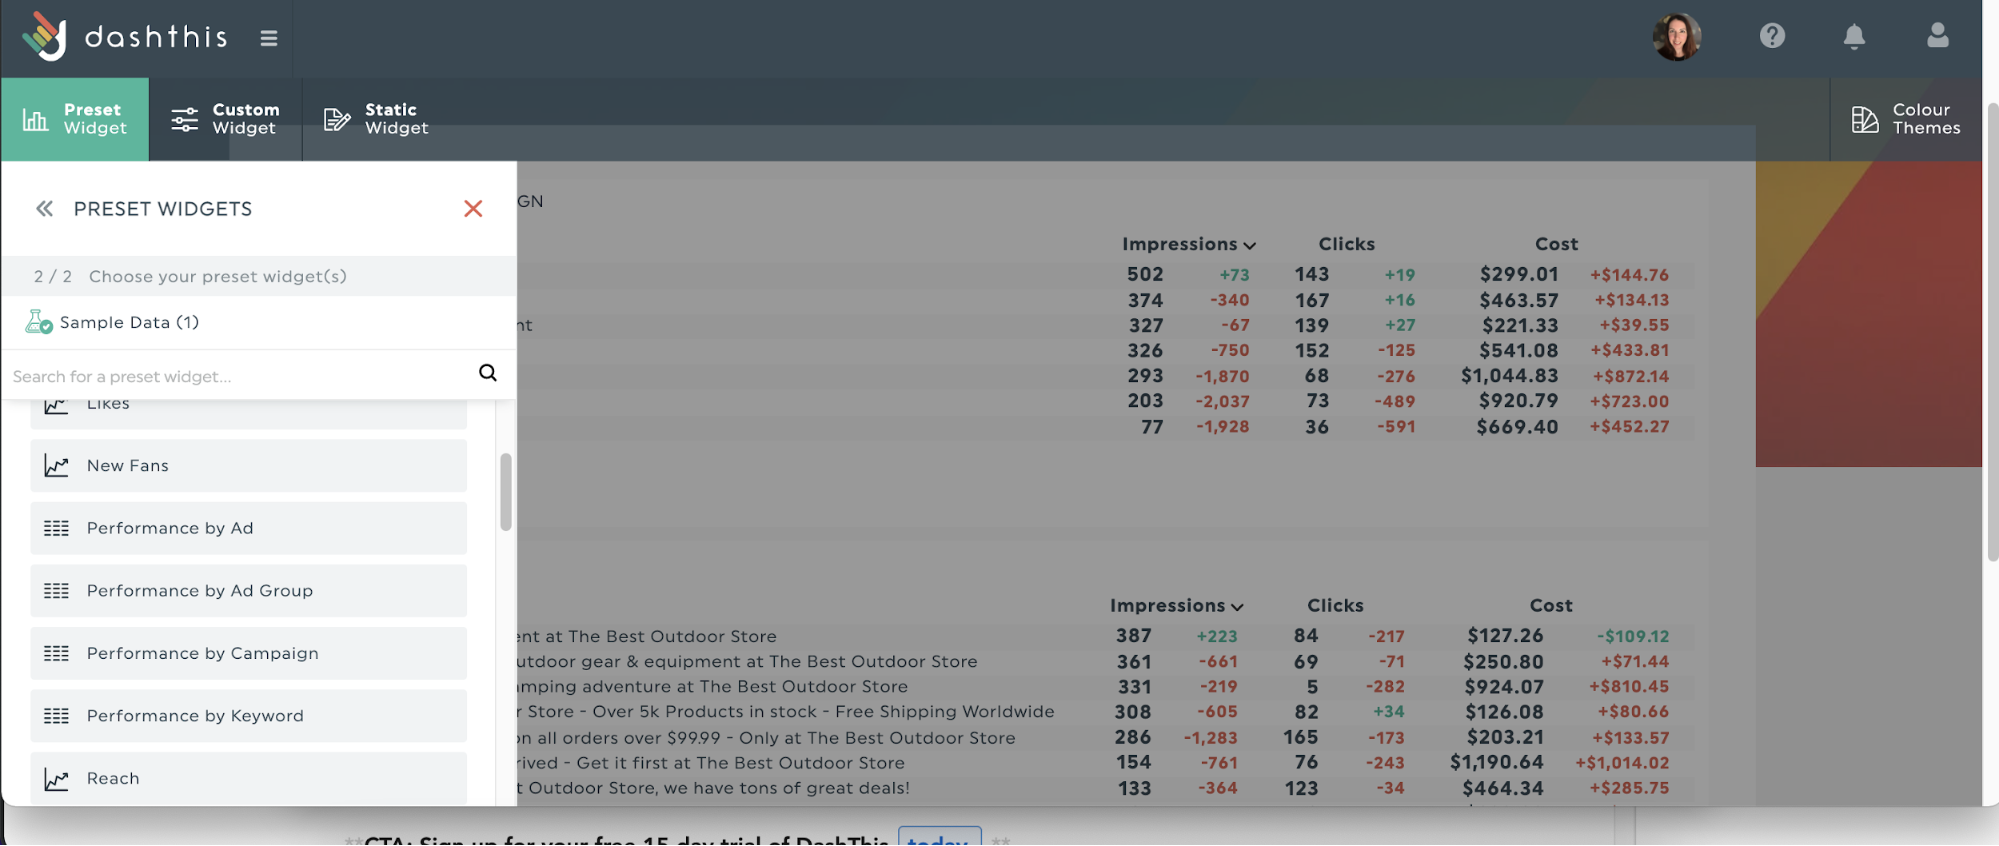
Step 3: Select the business KPIs you wish to track from DashThis’ preset widgets
Step 4: Drag and drop as many KPIs you desire to create your own business KPI tracker template!
Sign up for your free 15-day trial of DashThis today.
Which metrics are essential?
We’ve covered the top three KPI examples for e-commerce, marketing agencies, and what your senior management is keen to see to get you started.
Top KPIs for your e-commerce business
Average order value
An e-commerce business’s lifeblood is the number of customer orders, and average order value (AOV) ensures you know. It can track this vital metric by knowing how much customers spend per order.
Naturally, AOV influences your marketing efforts' return on investment (ROI) and return on ad spend (ROAS) on your advertising campaigns. A higher AOV impacts your customer acquisition costs, pricing strategies, and revenue/profit figures.
AOV calculation: Total revenue/number of orders
Conversion rate
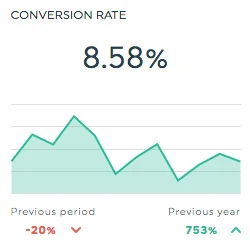
Conversion rate describes the percentage of site visitors who completed a desired action on your website.
For e-commerce businesses, everyday conversion actions include:
- Adding a product to cart
- Signing up for a marketing newsletter
- Checking out an order successfully
Track conversion rate to determine how effectively your website encourages people to complete business-critical tasks. Use this metric to pre-empt potential issues in your marketing and sales funnel or website.
For instance, if you’re seeing high visitor traffic but low conversions, or a marketing campaign bringing in fewer conversions than expected, it may be good to review your analytics.
Shopping cart abandonment rate
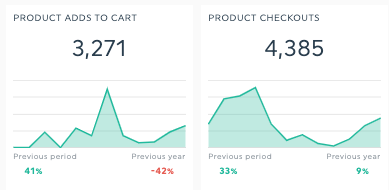
With average cart abandonment rates at an astonishing 80% of all online shopping orders across industries in 2021, you’ll want to keep an eye on this metric as it indicates the loss of potential sales.
While customers abandon carts for many reasons (like people looking out for deals or needing more time to make decisions), a high cart abandonment rate may indicate opportunities for improvement.
- Optimizing your checkout process,
- Offering a better variety of shipping options
- Improving the clarity of the product listings on your e-commerce site.
Top KPIs for your executive business
These financial KPIs focus on tracking and presenting the financial health of a business.
Net profit margin
Net profit margin provides a snapshot of your cash flow and financial bottom line in a specific timeframe. It measures how much revenue you have left after deducting operating expenses from your sales revenue and helps you answer the vital question: “did we really make money this month?”
In the long run, this is a key business metric for investors and the financial viability of your business as it acts as a financial forecast for your business and helps them evaluate any lending or investment decisions.
Calculation of net profit margins = (revenue - cost) / total revenue)
Net promoter score (NPS)
NPS may not measure financial health directly, but it’s an important metric to determine what your customers think about your business while measuring customer satisfaction.
Measuring NPS boils down to one question: “how likely are they to recommend you to a friend or colleague?” This trickles down to more business-related metrics, namely:
- The likelihood of new or repeat business in a specific time period
- How do customers perceive your brand
- The effectiveness of your customer servicing
- The quality of their interactions with your service
Customer acquisition cost / Customer lifetime value
How much are you spending on marketing for new customers?
That’s where customer acquisition cost (CAC) measures.
CAC includes the amount of money you spend on sales and marketing activities to get a customer, including staff salaries and other operational costs. Cost per acquisition is a key value to assess your business’s profit margins and determines financial health in the long run.
How to calculate CAC: total sales and marketing costs/number of new customers
Should you prioritize customer acquisition or customer retention efforts? Which customers should you focus on upselling or customer loyalty programs to encourage them to spend more?
Customer lifetime value (CLV) provides the answers to these questions. CLV takes a longer-term view of your business’s financial status. Using these metrics together helps you to inform your top-level goals and budgeting.
Tip: Combine CLV with customer acquisition cost to see whether your marketing campaigns turn a profit.
Top KPIs for your marketing agency
Traffic sources
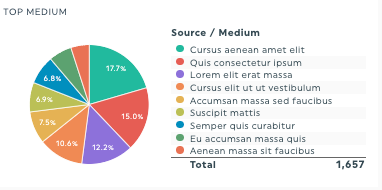
Where does your website traffic come from? Which sources attract the most engaged traffic, and where should you focus your budget?
These are all questions the traffic sources report can answer. It provides the foundational data to help you assess the effectiveness of your marketing initiatives. For example, if you’re focusing on organic traffic efforts but don’t see a corresponding increase in organic traffic, that’s a signal for you to review those campaigns.
Bringing another level to your analysis and client recommendations by comparing other metrics to your traffic sources report can provide context to assess marketing efforts further.
Compare the bounce rate across traffic sources to see which source brings in the most engaged traffic while using the site average as a performance baseline.
You can also track the average time on site across sources to see which source engages with your content the most.
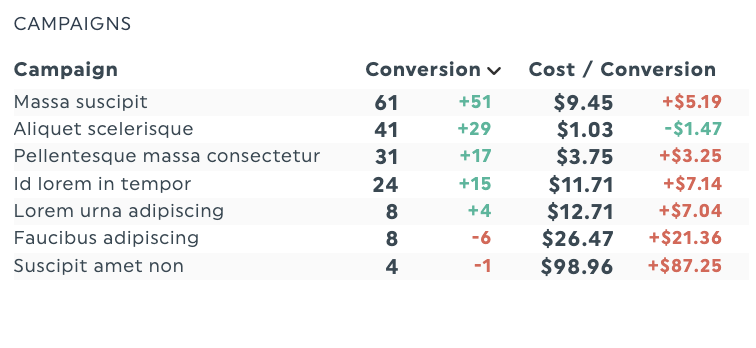
Campaigns metrics
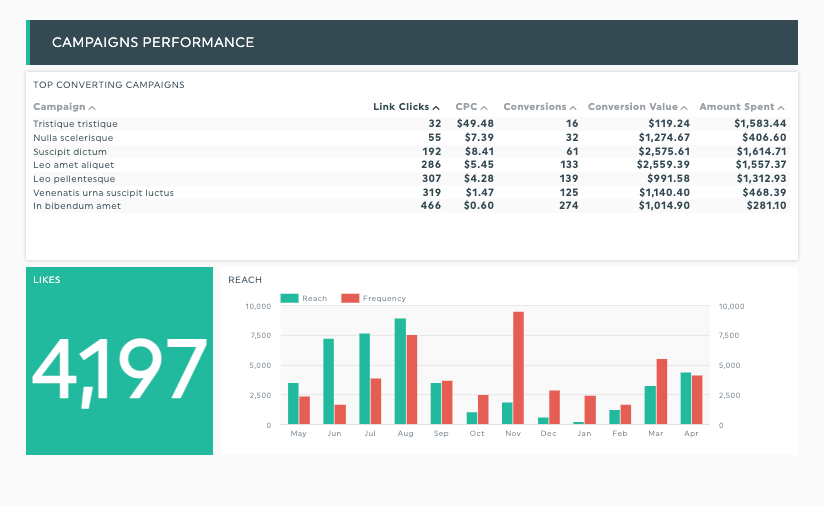
Use this report to track all campaign-related metrics, be it paid ad campaigns, email marketing initiatives, or digital advertising campaigns.
Not only do you have solid insights to prove the effectiveness of your campaigns, but you’ll also have all key metrics on hand to serve as a foundation for deeper analysis and client recommendations.
Social media metrics
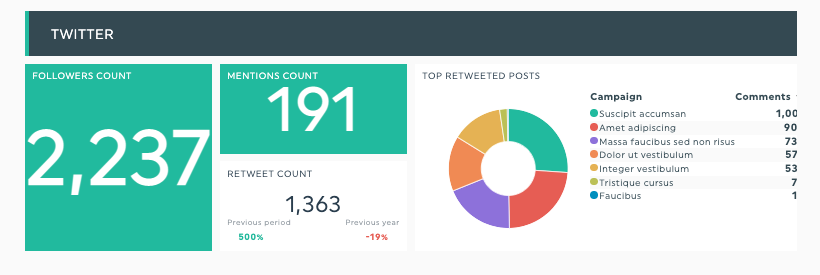
DashThis’s social media marketing report. See this template with your data
Are your social media efforts hitting the mark?
Track your social media performance and get insights to inform your future content strategy. Choosing the right social media metrics to measure is vital here; if you’re tracking social media’s contribution to business revenue, you’ll want to focus on conversion-focused metrics.
Take the hassle out of manual data gathering with automated business KPI reporting
Now that you know which KPIs to track, you can do it in seconds with an automated tool. Focus your time and efforts on analysis instead of manually gathering data across your marketing tools.
Liked what you’ve seen so far?
Sign up for your free 15-day trial to automate your business KPI reporting, present your critical metrics in a beautiful report and make it easier for your stakeholders and clients to make decisions.

Ready to automate your reporting?
Read More

Don’t miss out!
Follow us on social media to stay tuned!
Automate your reports!
Bring all your marketing data into one automated report.
Try dashthis for free