Selecting and reporting on goal metrics: a simple guide for business success

“How do these metrics you’ve proposed help us close more new customers and increase sales? We discussed this months before, and I’m still not seeing a difference”.
Oof. Not words you want to hear.
Especially after you spend hours preparing your report and analysis, only to realize you’ve focused on metrics that don’t relate to business goals.
How do we avoid this? Here’s a step-by-step goal-setting guide and choosing the right metrics. We’ll also cover how to measure and report on them with DashThis.
What are goal metrics?
Think of goal metrics like a compass for a ship or trail guiding you to your desired destination.
They provide a precise measure of success for you to ensure progress toward the desired goal and ensure you’re achieving a goal. It also shows if something is off-course for further investigation, from key metrics going against previous trends or responding to unexpected spikes and dips.
For example, you can evaluate a sales team’s performance by comparing the number of closed/won deals to the number of leads or by calculating the total revenue generated from closed deals.
Here’s what an achievable goal metric may look like:
Get this sales report with your own data!
Goal: Grow our business by increasing annual revenue by $500,000. For this to happen, we aim to improve our close/win rate from 4% to 6% by increasing the number of daily sales calls/emails from 10 to 15 over the next six months.
Goal metrics: Win rate, revenue closed
Note: What is the difference between goals and metrics? Goals are desired outcomes of what you want to accomplish, whereas metrics are vital indicators you use to determine progress toward your goals.
What makes a good goal metric?
Good goal metrics:
- Keep your team focused and aligned around a common business aim
- Track progress over a given period
- Motivate and challenge your team
Let’s look at these characteristics in more detail.
Goal metrics align with a business goal:
Can this metric inform a business decision? If yes, it’s more likely to be a good goal metric.
If your goal is to increase revenue, monitoring close rate and revenue closed helps you understand how efficient your sales team is at closing deals, the size of the accounts you’re closing, and overall customer retention.
Compare this to vanity metrics like the call-to-meeting ratio, which don’t directly relate to closing deals and aren’t as relevant to this business goal.
Goal metrics are actionable.
Can you establish a clear cause-and-effect relationship between your business goals and goal metrics?
These metrics act as feedback mechanisms to optimize sales-related activities like increasing the number of leads or upselling key accounts to bring in more revenue. Motivate and challenge your team with clear links between actions and results.
How to systematically set your goals and metrics
Hundreds of possible metrics and key performance indicators (KPIs) are out there, and goal metrics help your team members drive results in the right direction.
Choosing the wrong metrics can cause unintended consequences. For example, performance measurement specialist Stacey Barr relates a story where a KPI measuring the percentage of trains on time led to the unintended consequence of canceling trains running late to maintain the KPI. This led to more unhappy customers.
By systematically setting goal metrics, you can avoid these situations. Here are 4 steps to help you think through your goals and metrics.
Step 1: Consider your business goals
Think broadly about what you want to achieve and why it matters.
For example, to generate more revenue, you may want to improve customer satisfaction with your product to guarantee long-term clients and reduce acquisition costs.
Higher customer satisfaction could lead to more favorable testimonials, which act as a positive flywheel to attract more potential customers.
Once you’ve got an idea of your goal, refine it using the SMART goal method Here’s what our customer satisfaction goal might look like in the SMART format.
I want to improve my customer satisfaction scores by improving my average net promoter score from 7 to 9 in the next 6 months. We’ve invested in voice-of-customer tools to collect feedback and agent training. We’ve also set aside an hour weekly to review and share feedback across all teams.
Step 2: Define benchmarks for each goal
Defining a benchmark is like drawing a line in the sand. It helps you assess a good starting point for a performance metric and helps give you context for a specific goal. For example, let’s say your latest NPS survey returned an average score of 6, which doesn’t sound good on its own.
But what if your previous NPS survey six months ago was a 4, and you’re in the middle of an action plan to improve customer satisfaction? With a benchmark, that data becomes more meaningful as you can see how much you’ve progressed since setting that measurable, time-bound goal.
2 places to find a suitable benchmark for your goal:
- Industry benchmarks
- Company historical performance over a period of time
Step 3: Establish the metrics to reach these goals
Once you’ve got your benchmarks, it’s time to look at assigning the most important metrics that measure progress. Goal metrics for the customer satisfaction goal might look like this:
- Customer satisfaction (CSAT) scores
- NPS scores
- Customer churn rate
- Response time
Wherever possible, involve the team responsible for ensuring everyone is aligned on KPI measurement (in this case, the customer service team). Review your metrics regularly (at least once a month) to ensure they are helpful to help you meet your goals.
How to track metrics and goals with DashThis in 5 steps
You’ve now got your system to track your long-term goal metrics, so what’s next?
Tracking and setting goal metrics is ultimately a communication tool; you use metrics to show how much you’ve progressed and where the opportunities for further growth are. That’s where reporting tools like DashThis come in to simplify and automate this process.
By the end of this guide, you’ll turn your metrics into visual online dashboards anyone can use to monitor your goal metrics.
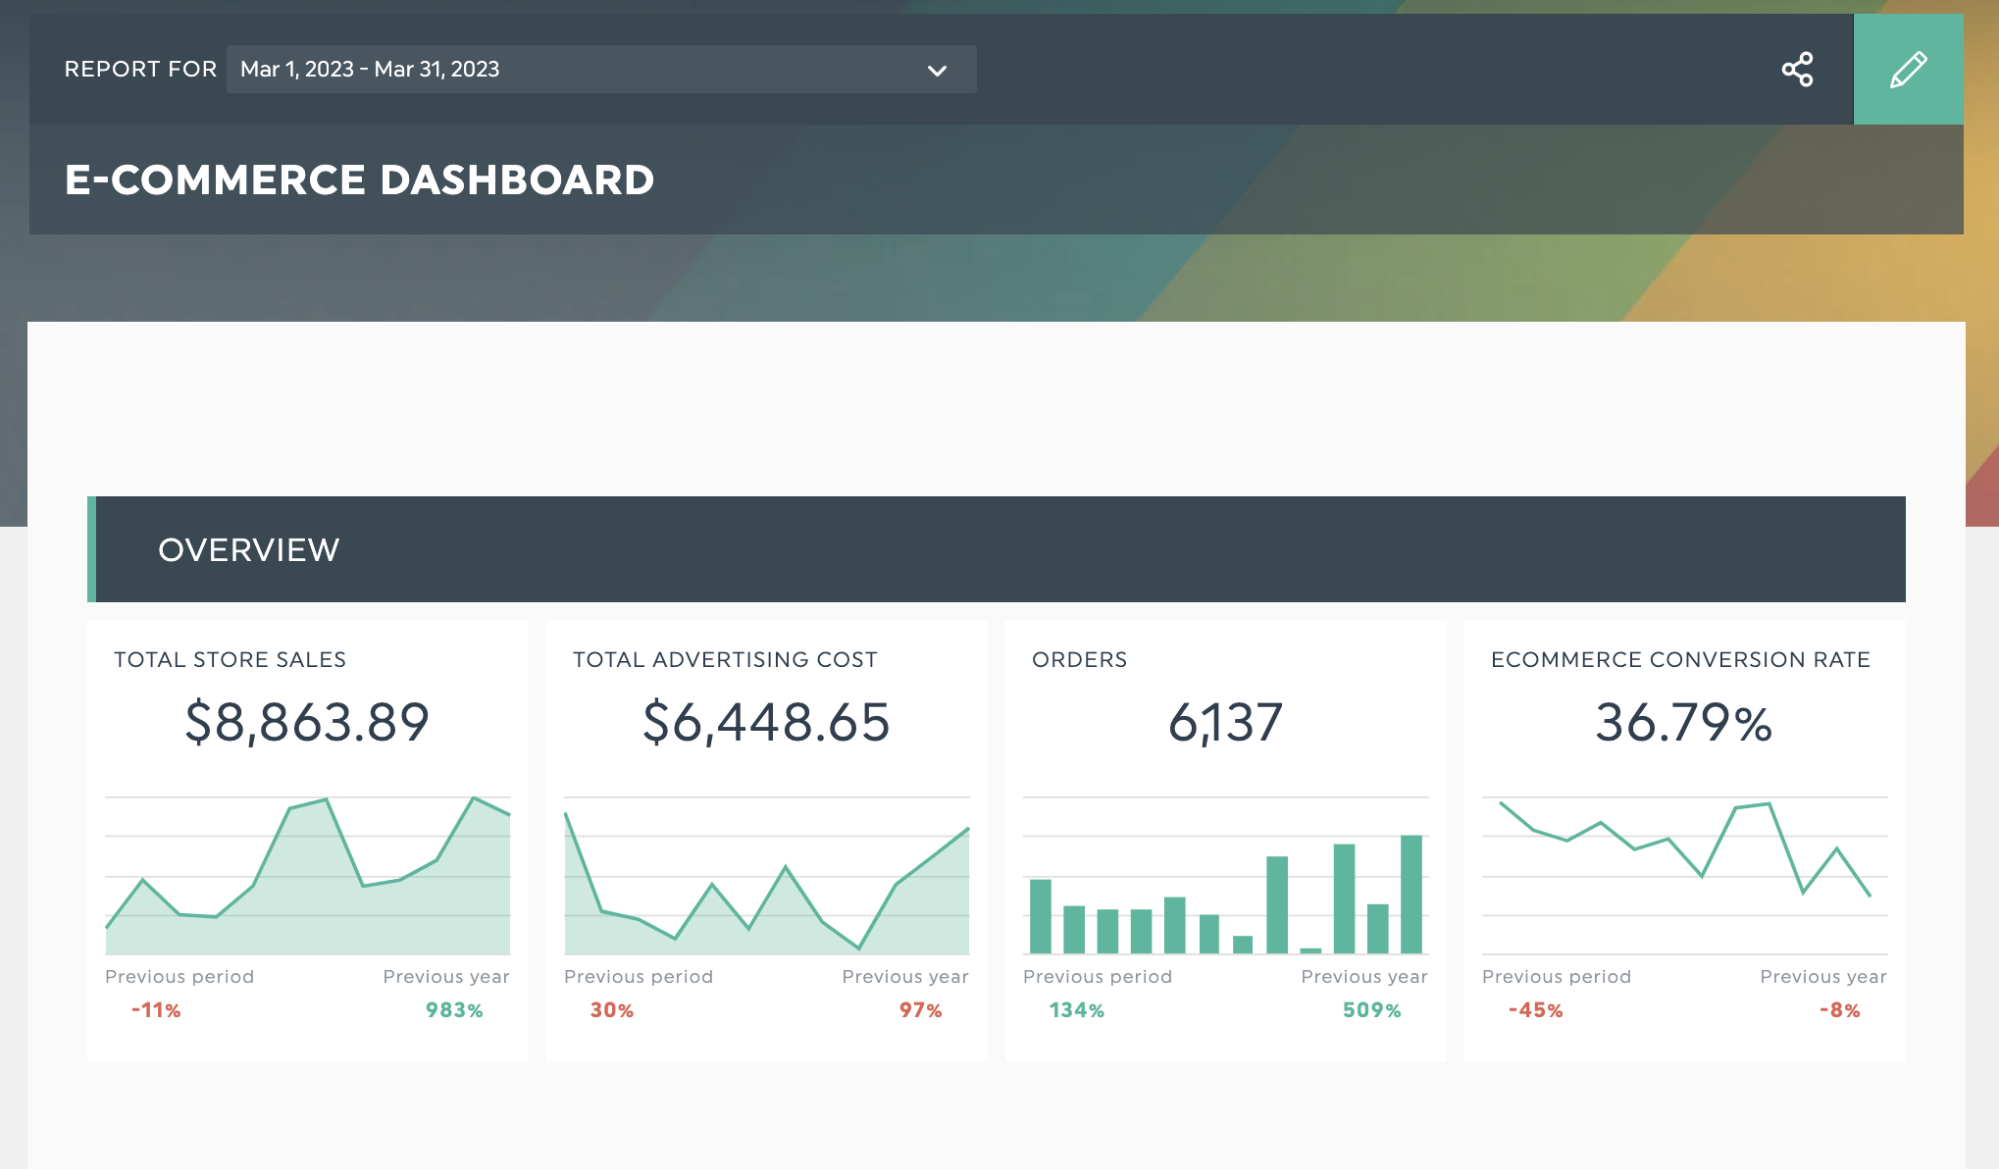
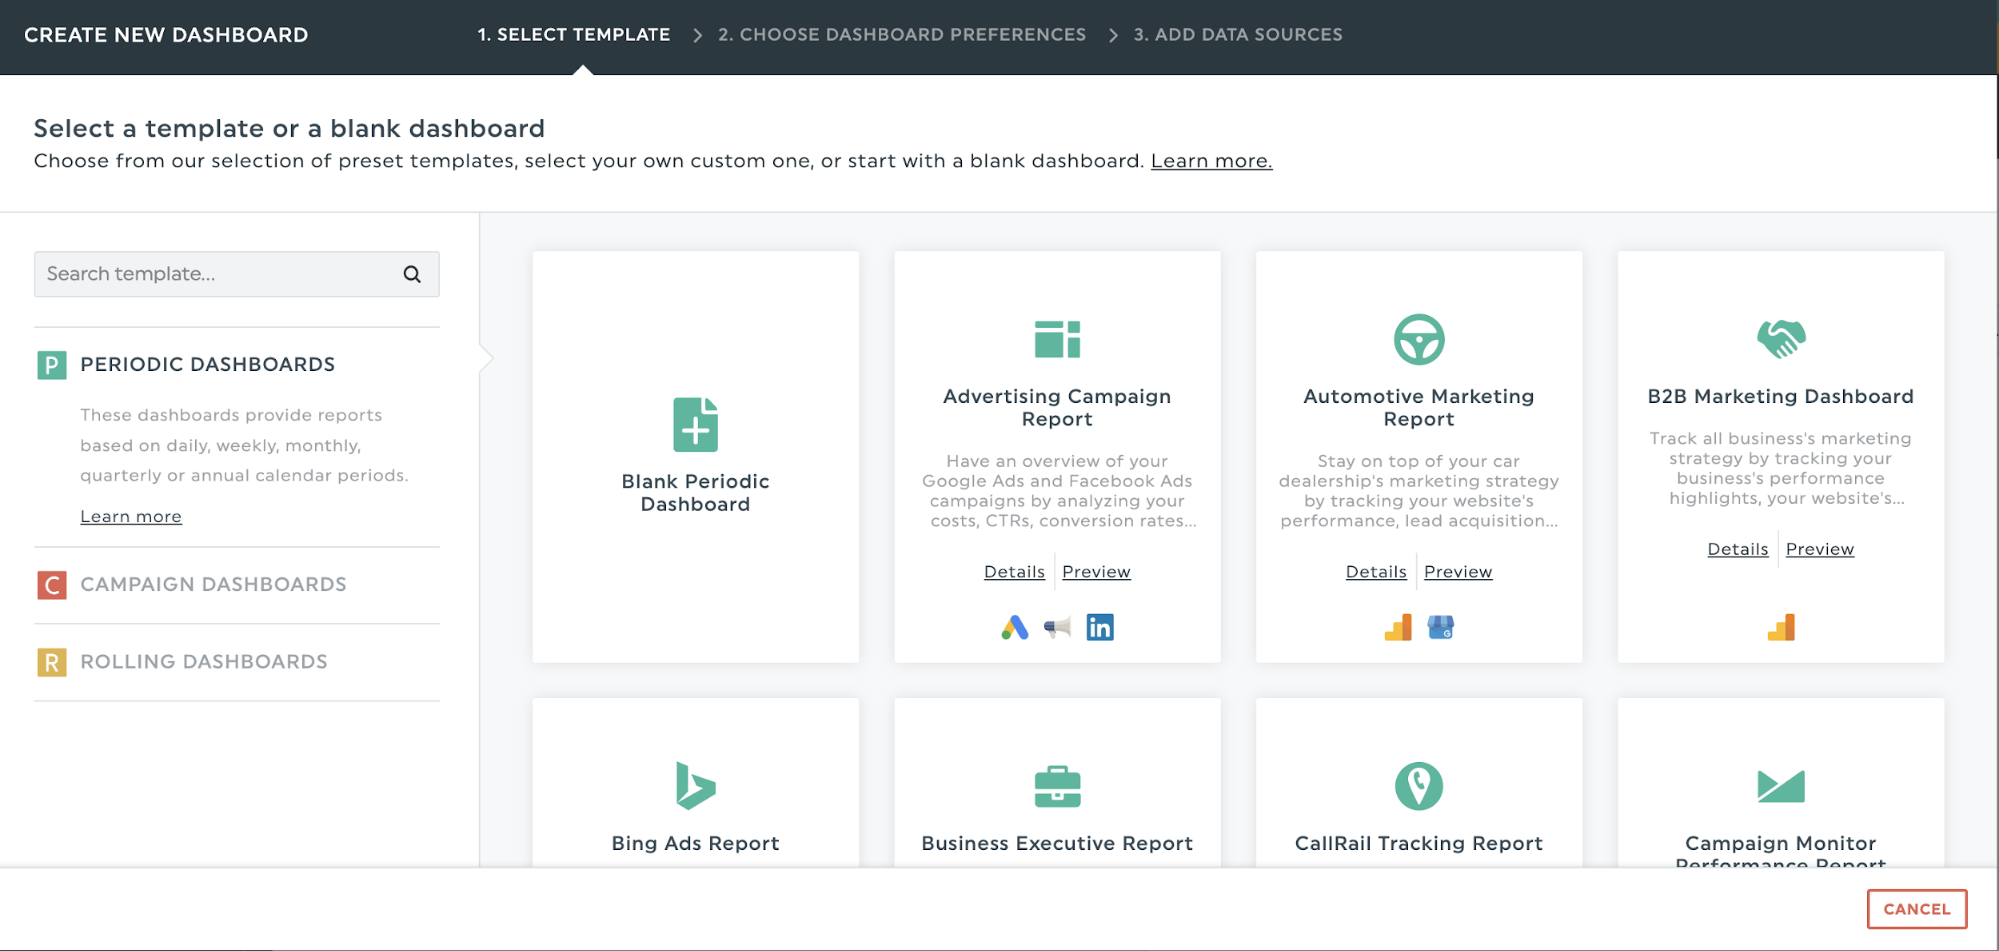
1. Create a new dashboard or use one of our time-saving templates
Start creating your report from a blank dashboard or use one of our templates to help. We’ve got various reporting options - from daily reports, to weekly reports, and more to fit your reporting needs.
Name your new dashboard and select your reporting time period from the drop-down list. DashThis automatically keeps a 13-month history of your data in its archives, so you can browse your data’s history and analyze performance in real-time.
2. Integrate your data sources
Reports are only as good as the data used to populate them.
Thankfully, DashThis integrates with 34+ popular SaaS marketing tools, including social media platforms like LinkedIn, Google Ads, Google Analytics, and more.
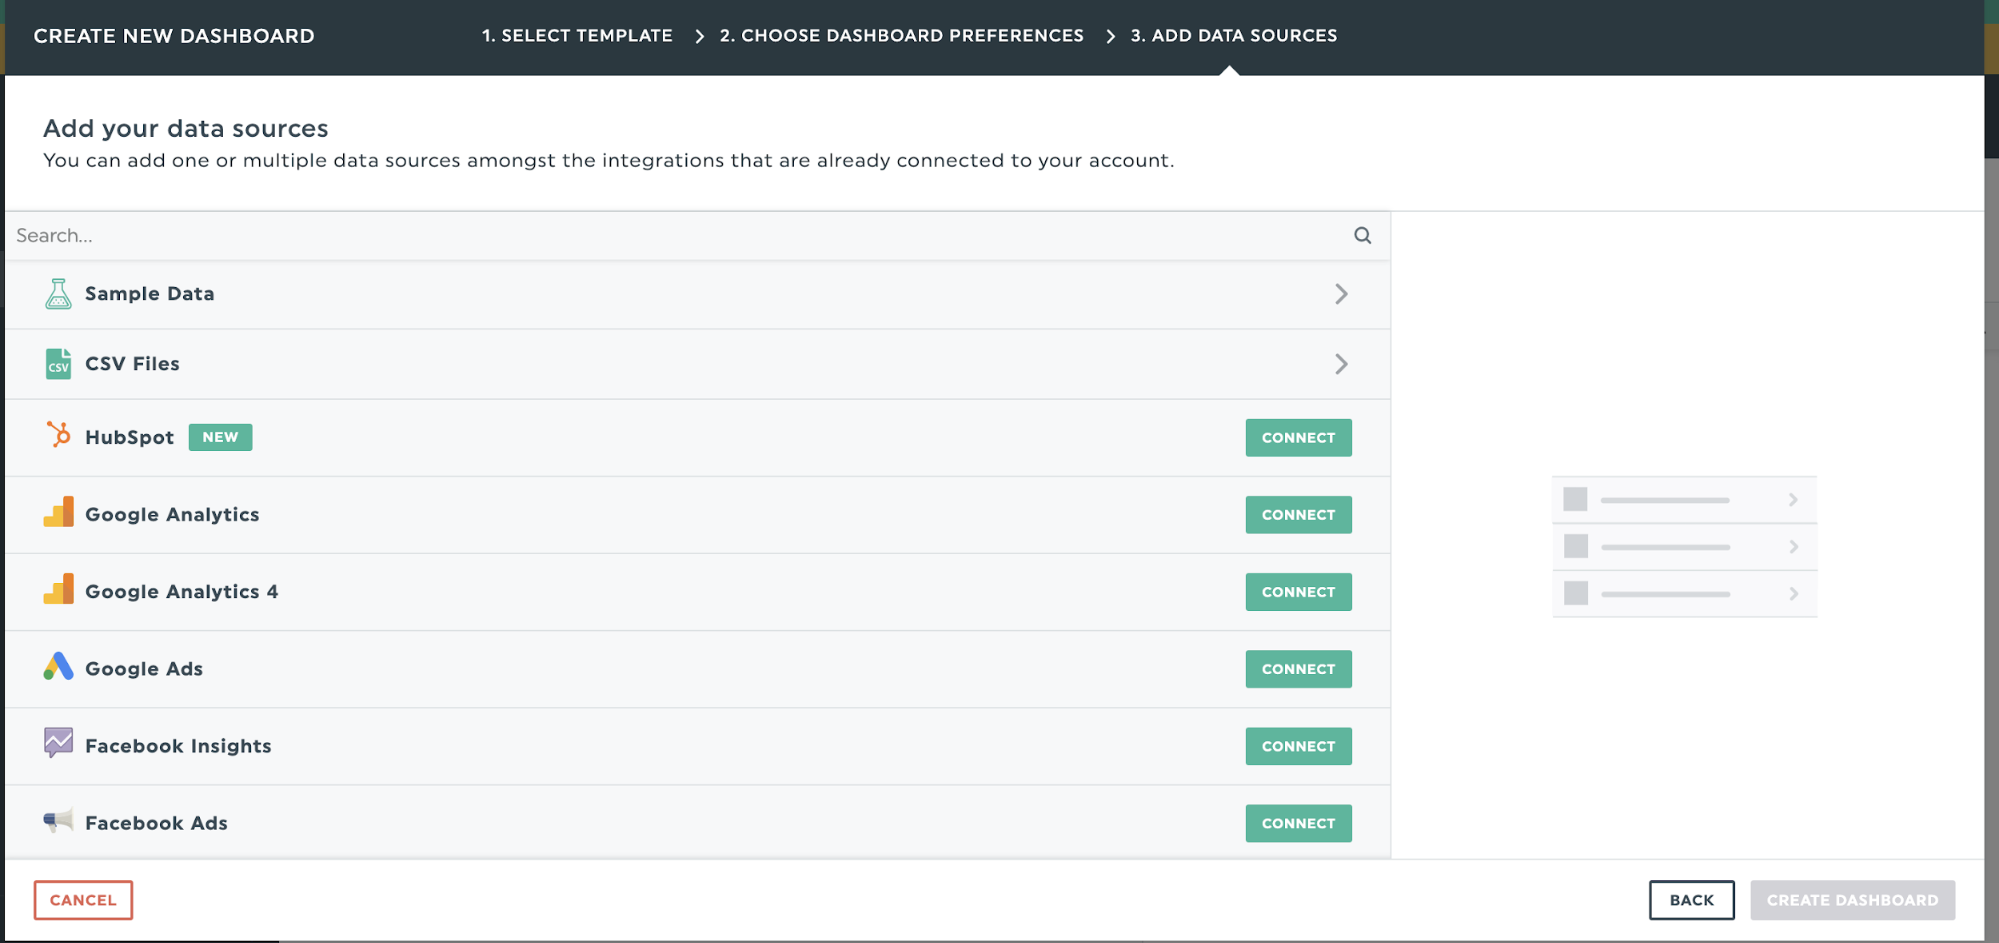
Connecting your data sources to DashThis will display all your data from multiple tools and platforms in one report, saving you the time needed to export and format your data.
Need to add custom data? You can create a dashboard using our CSV file importer.
3. Visualize your data with widgets
How you display your data is as important as the data itself, and using visuals helps you get your message across quickly.
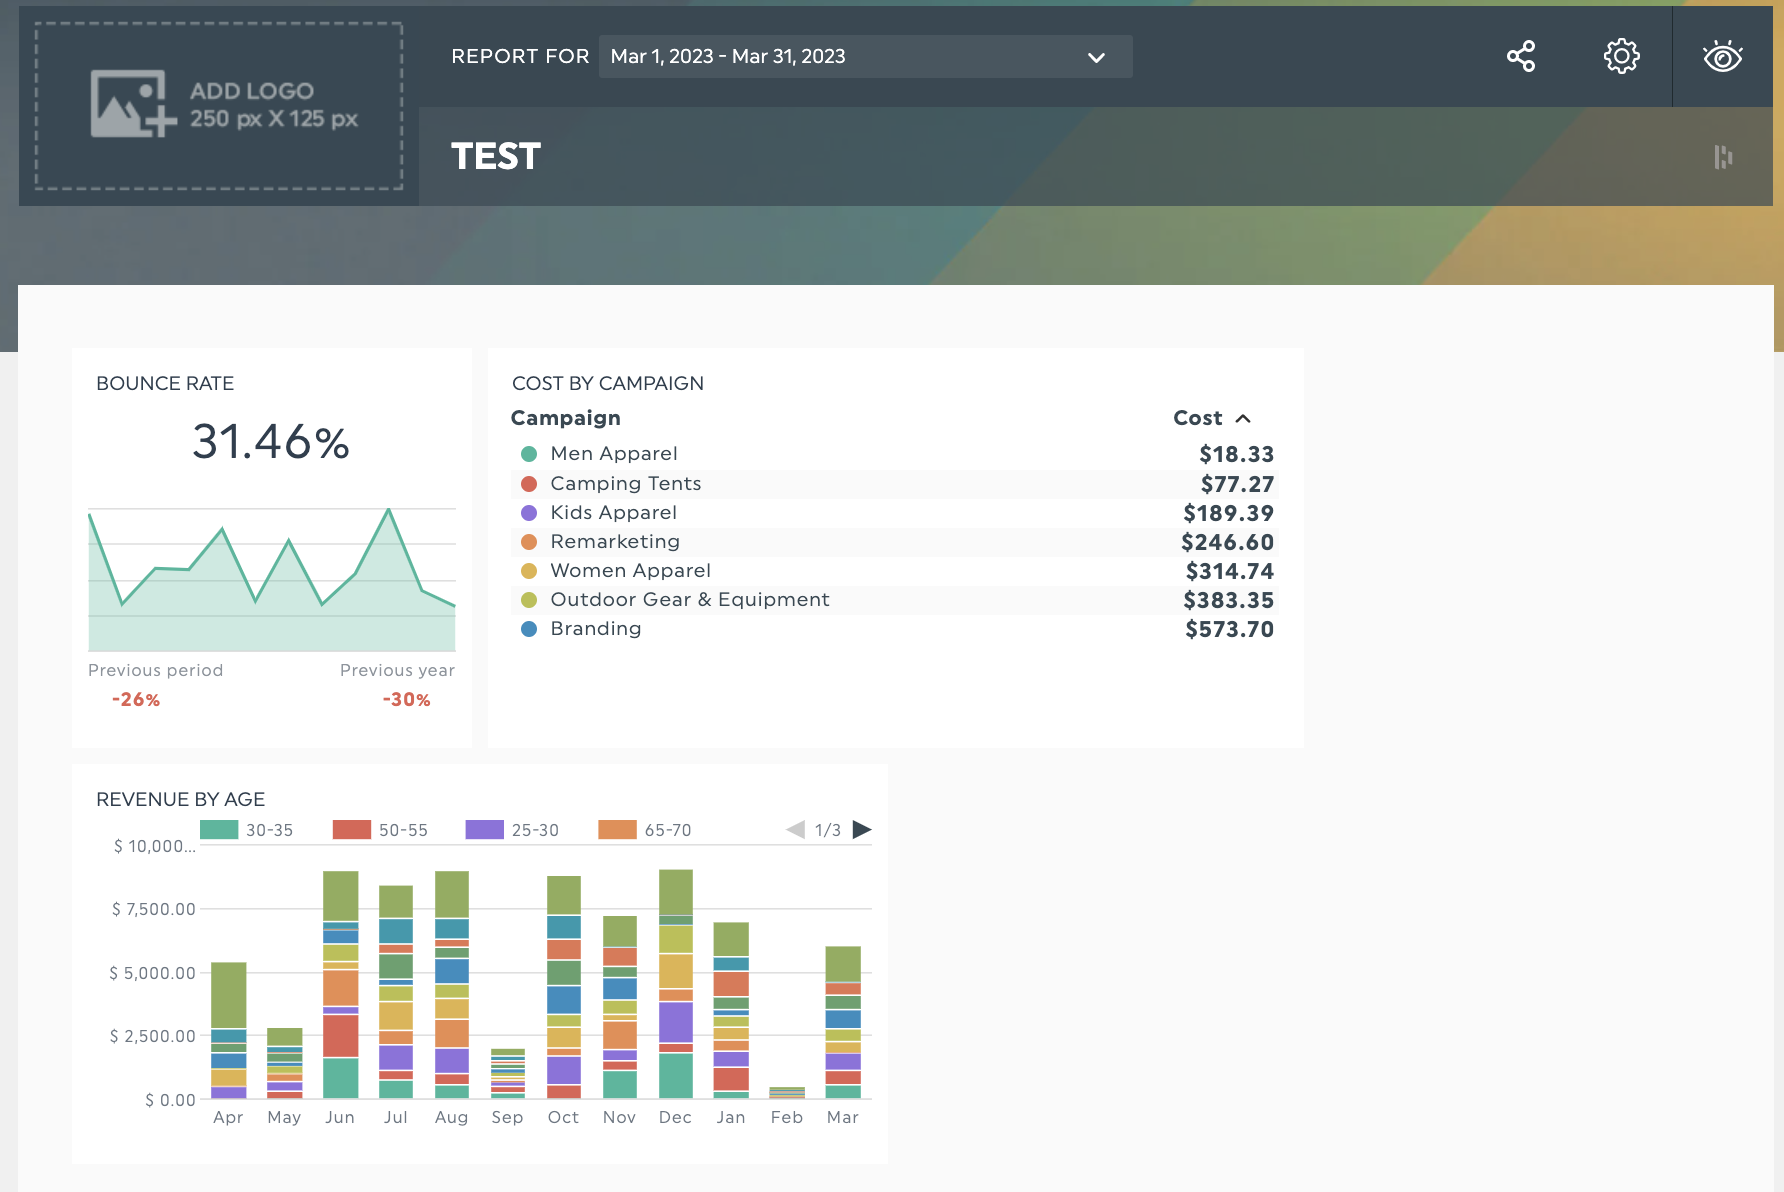
Some example widget visuals in DashThis
DashThis has three widget categories to visualize your data
- Preset widgets to visualize commonly used KPIs. Simply click, drag, and drop to add these to your dashboard.
- Custom widgets: Want to design your own widgets? You can choose which graph type to display your data using custom widgets.
- Static widgets: These act as tools to organize your dashboard or if you want to add an editable number to highlight a specific financial metric.
Read more:
- How to visualize data in DashThis
4. Add commentary to your KPIs and metrics
Sometimes you need more than visuals to describe your data, whether it’s:
- A summary of your key results
- Adding contextual information like KPIs, related metrics, or actions taken on a specific date
- Defining a term for easy understanding
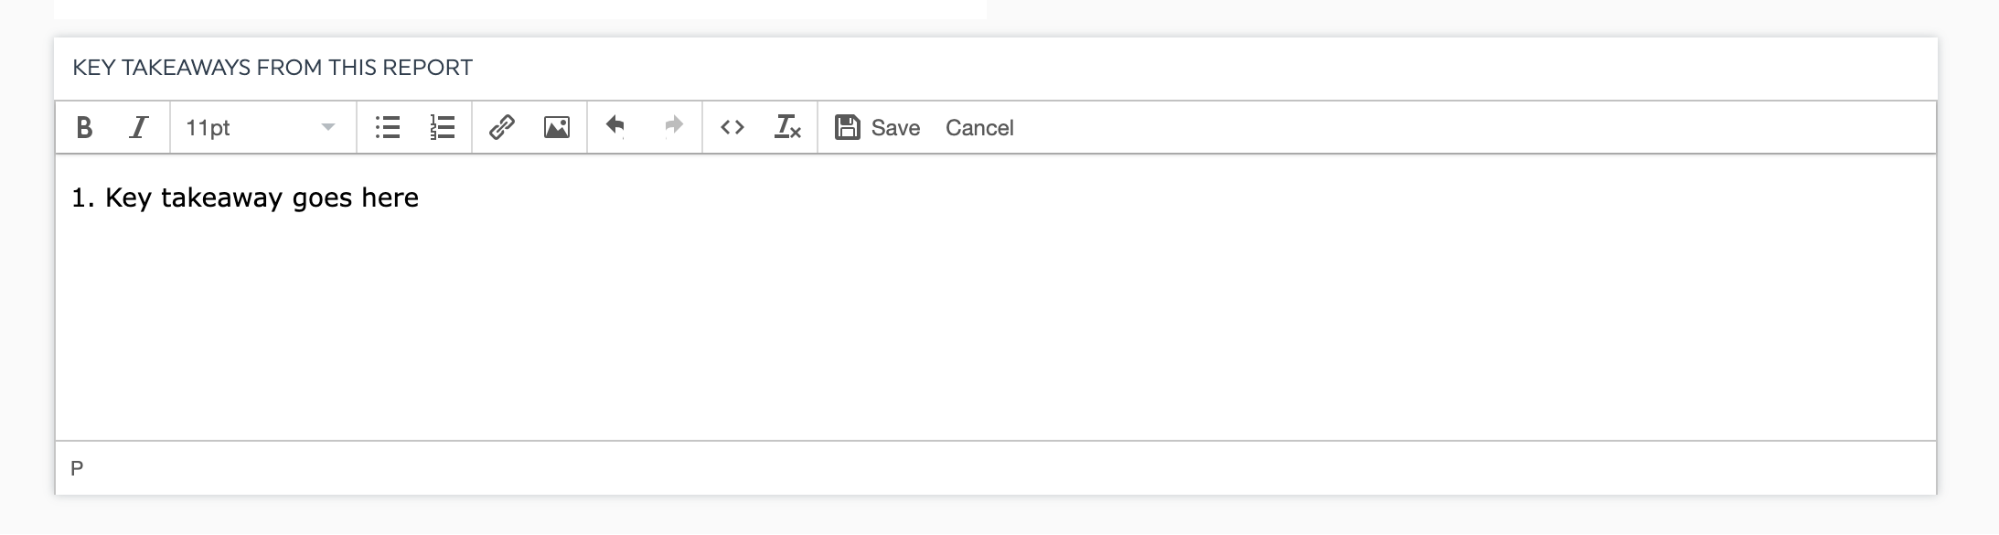
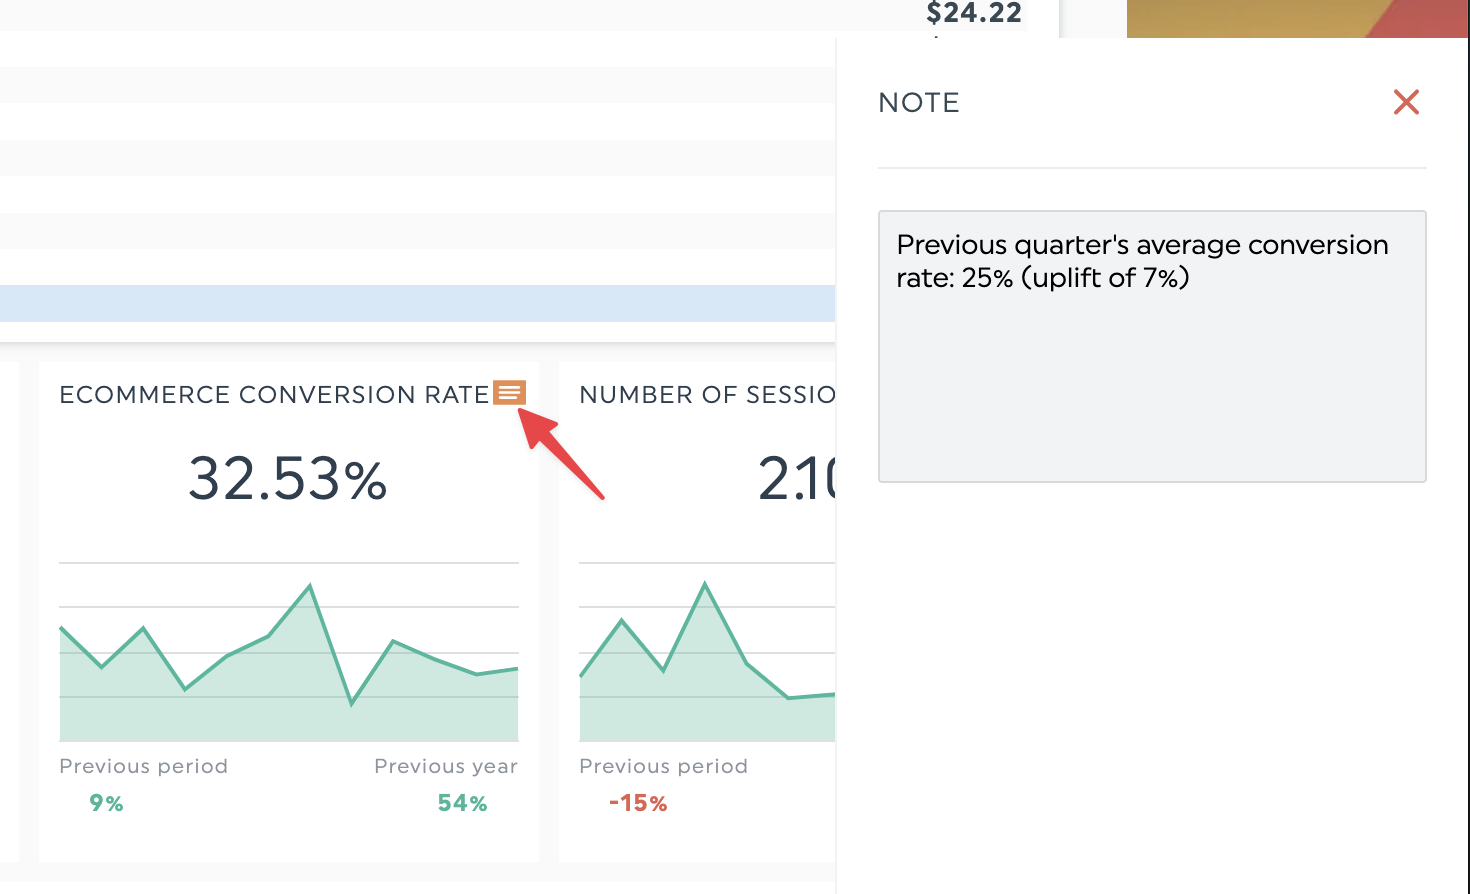
DashThis offers two features to make explanation seamless; a comment box and adding notes to widgets.
To embed a comment box in your DashThis report, go to Static Widget > Comments.
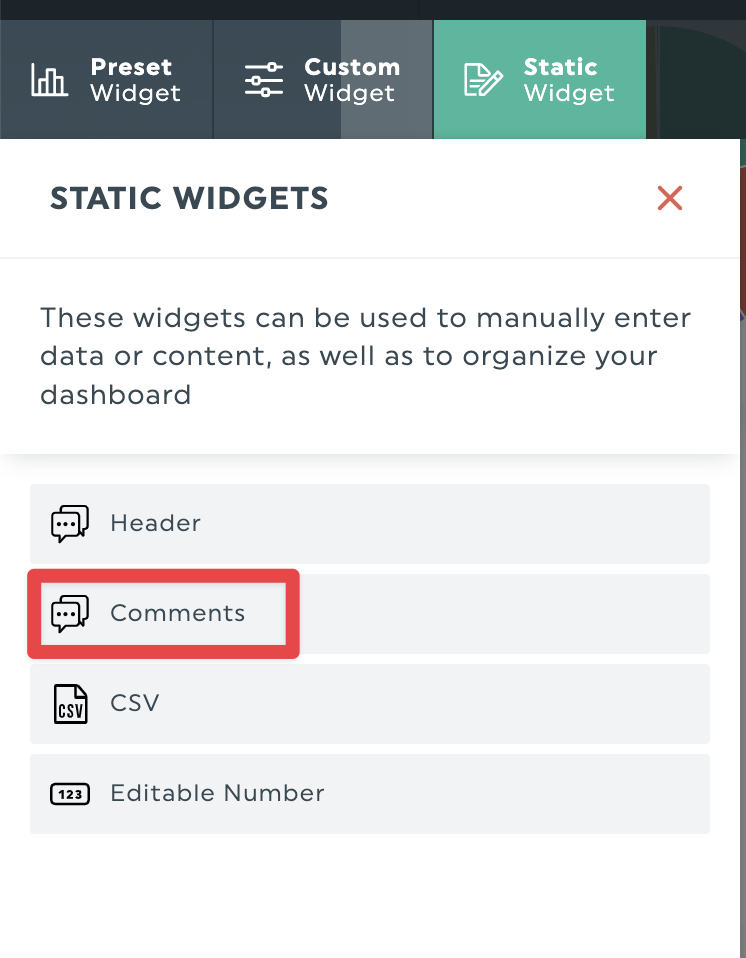
You can add high-level insights, like explaining work done this month and how your goal metrics have progressed.
You can also add a note to a widget to explain each chart or add context. Here’s how.
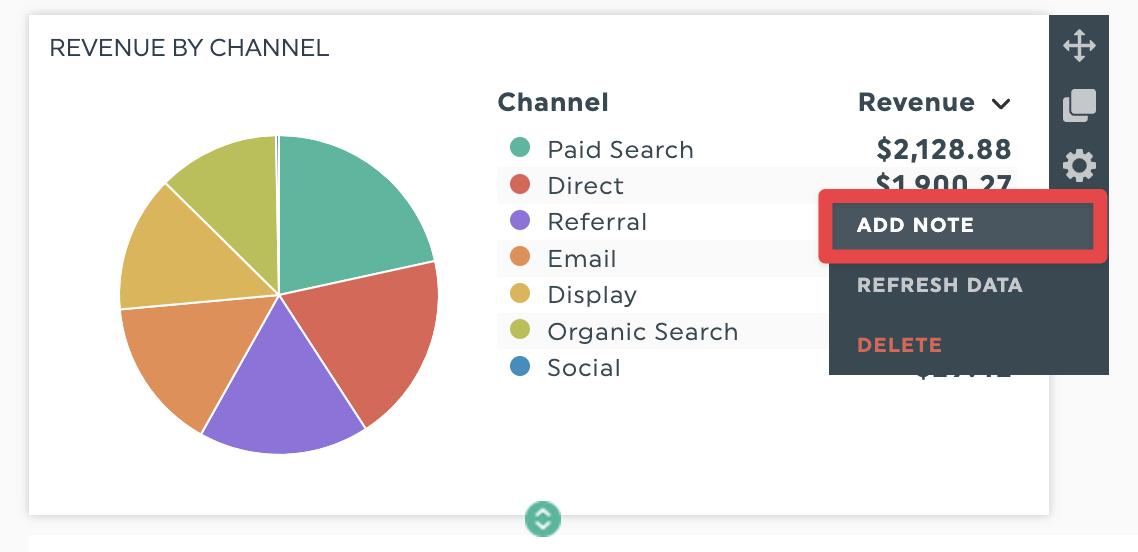
The added note will appear on the right side of your screen in a separate panel, accessible in view mode.
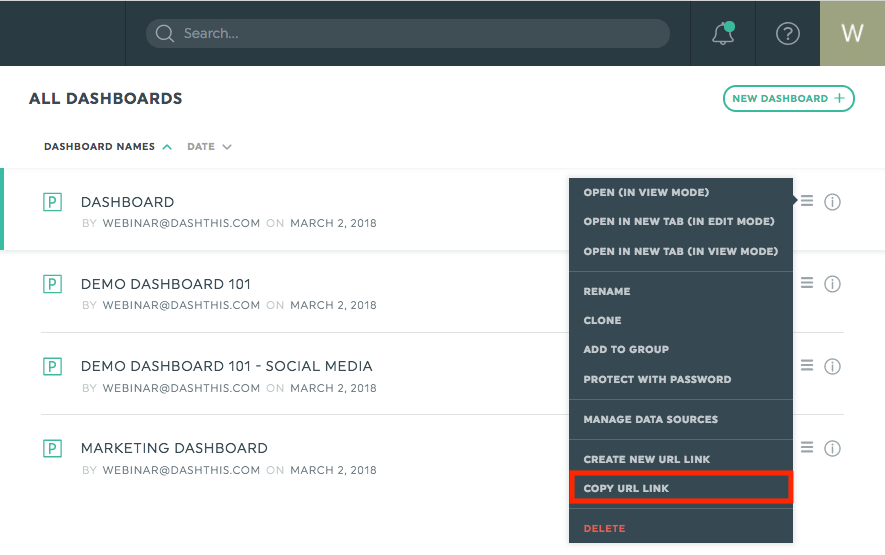
5. Share your report
Now it’s time to share your newly created report with your clients and stakeholders to quickly track progress toward your goals.
With DashThis, sharing reports is simple. We’ve got options to send automated email dispatches at regular intervals. Click on the share icon in your dashboard, and you can share your report by email.
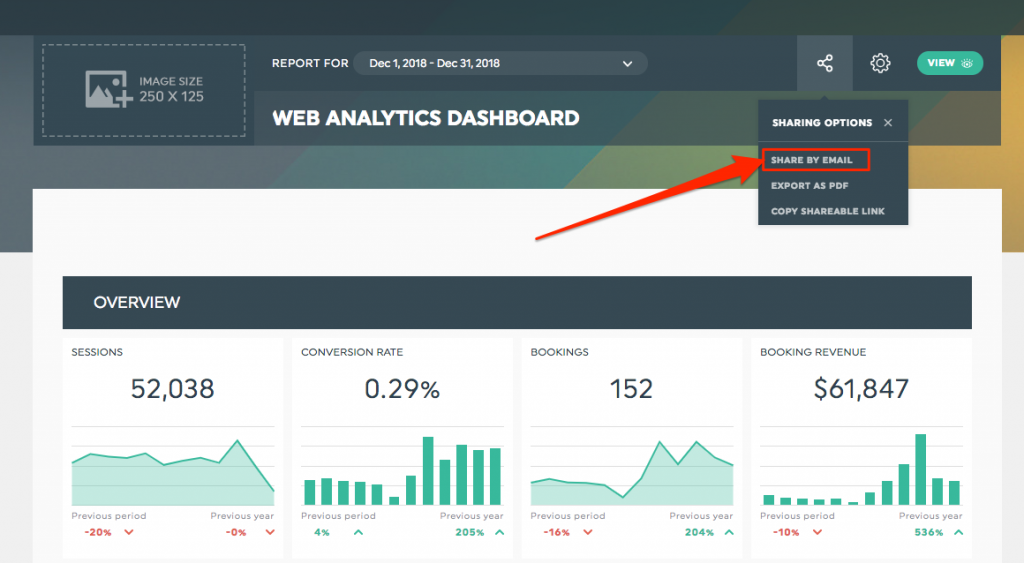
You can also share your report with a unique URL to send to your clients via a message in seconds or PDF format for easy printing.
Sign up for your free 15-day trial of DashThis today
Template spotlight: DashThis’s digital marketing report template
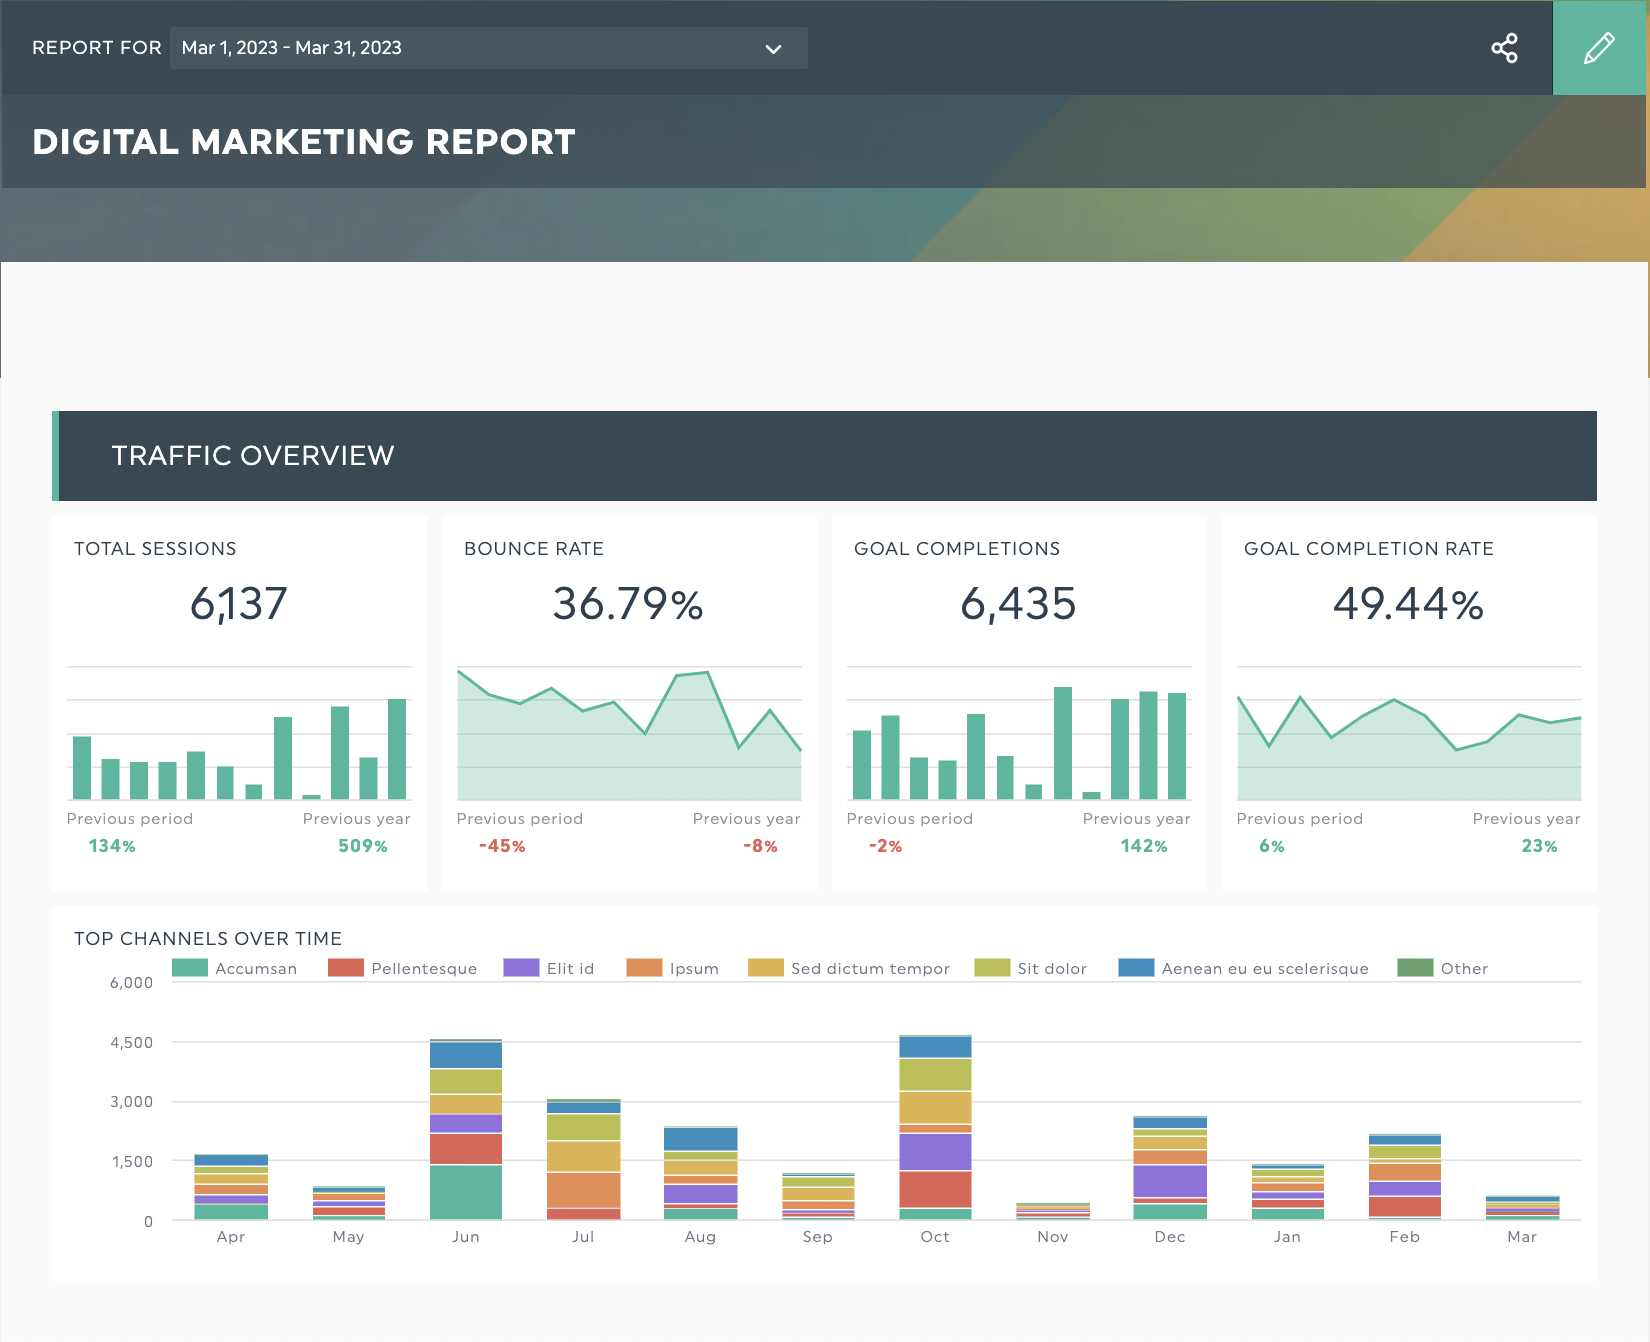
DashThis’s digital marketing KPI tracking report template. Try it with your own data
Help your marketing team track the effectiveness of a marketing strategy with this template or combine customer satisfaction and financial metrics with digital marketing insights. Make this template your own with our custom widgets, or add notes and comments to a chart to give your client the context they need to measure progress towards different goals.
Our digital marketing report template tracks:
- Website traffic performance across marketing channels
- SEO performance
- Paid marketing efforts
- Email marketing performance
Automate goal metric tracking with DashThis
Goals and metrics to measure progress are a North Star to keep your teams and projects focused. They help teams decide what to do next and keep them aligned when obstacles arise.
Make progress tracking easy and automated with DashThis. Sign up for your free 15-day trial of DashThis today

Track all your email marketing data in one automated report.
Read More

Don’t miss out!
Follow us on social media to stay tuned!
Automate your reports!
Bring all your marketing data into one automated report.
Try dashthis for free