The Ultimate Guide to Performance Reporting (2024)

58% of organizations base at least half of their decision-making on “gut feel.” In the report, these same organizations struggled to keep up with the competition.
The moral of the story?
Best-in-class companies base all decisions on data and information—exactly where performance reports come in.
This guide briefly explains why performance reporting matters, walks you through four types of reports in marketing, and (re)introduces how DashThis streamlines your reporting.
- What is Performance Reporting in Marketing?
- Performance Reporting for PPC
- Performance Reporting for Email Marketing
- Performance Reporting for Social Media
- Performance Reporting for SEO
- Automate Performance Reporting with DashThis (3 Step Guide)
- Try DashThis for Your Performance Reporting Needs Today
What is Performance Reporting in Marketing?
Performance reporting is the process of tracking, analyzing, and communicating the impact of marketing campaigns on a business’ objectives.
Common types of performance reports in marketing include:
- Trend reports: Identify patterns and trends before they take off
- Daily / weekly/ monthly / annual reports: Evaluate highlights of marketing channels and how they contribute to business goals before proceeding with strategic planning
(Note: There’s also earned value report, forecasting report, and variance report. These high-level dashboards mainly touch on finances, so we won’t talk much about them in this guide.)
Marketing performance reports are often created using automated reporting tools.
Here’s how it might look when you auto-generate an ecommerce sales report. Note how it gathers data from Shopify and Google Analytics 4 into one place.
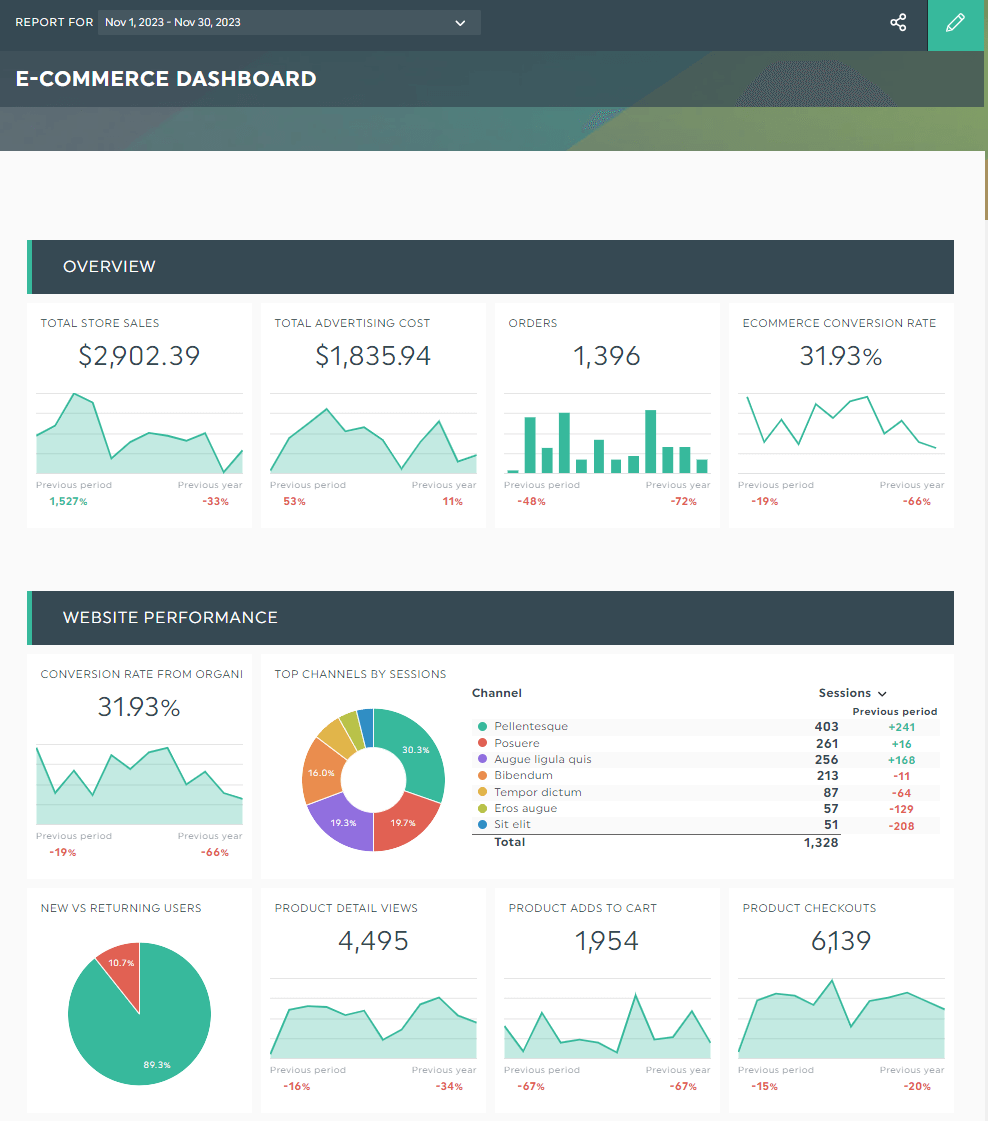
[Data via DashThis, the easiest reporting tool]
Reporting solutions like DashThis automatically gather data across multiple channels and turn them into graphs and charts. Thanks to the easy-to-understand visuals, it takes seconds—minutes, at most—to identify what works and replicate success for future campaigns.
Let’s explore how this looks in the next section.
Performance Reporting for PPC
43% of startups spend $100-$5000 every month on PPC ads. That’s a lot of potential wasted ad spend if you’re not measuring your ads efficiently.
PPC performance reporting metrics
Ads are meaningless if they cannot generate conversions—yes, even when your click-through rates are above the industry’s average.
These metrics ensure you’re making the most of your ad budget.
- Impressions: Number of times an ad is shown
- Conversion rate: Percentage of users who completed a desired action (e.g., book a demo via landing page)
- Quality score: Diagnostic tool that compares your ad against other advertisers on a scale from 1 to 10
- Cost per click: Price paid for each ad click
Other PPC reporting metrics include return on ad spend (ROAS) and ad position.
PPC report template
Run profitable PPC campaigns. Use this dashboard to see how your keyword selection, ad copy, and targeting compare across different time period.
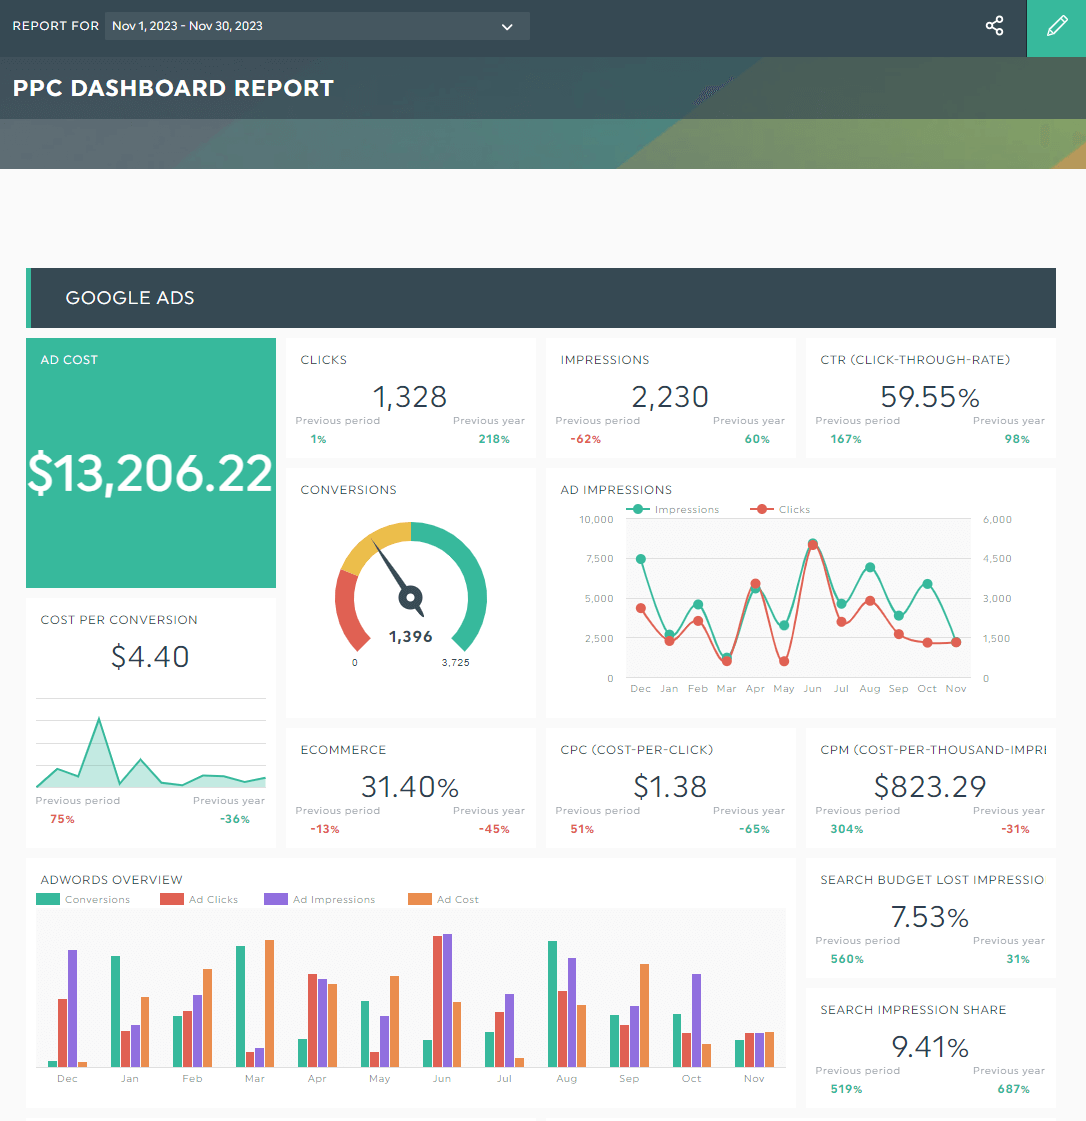
Grab this PPC report template with your own data!
Performance Reporting for Email Marketing
Email marketing shortens the buying process by three times compared to other social outreach.
While it's tempting to favor emails over other channels, 34% of consumers unsubscribe due to receiving too many emails. It’s crucial to be mindful of the frequency in your life cycle email sequence.
Email marketing performance reporting metrics
Segmented email campaigns generate 100.95% higher clicks than non-segmented campaigns.
This goes to show subscribers do want to hear from brands, but only when it’s relevant to their needs.
Track these metrics to figure out the best time to reach out.
- Open rate: Percentage of subscribers who opened your email
- Click-through rate: Percentage of subscribers who clicked through the links in your email
- Conversion rate: Percentage of subscribers who completed a desired action in your email (e.g., bought a product)
- Bounce rate: Percentage of email addresses that didn’t receive your email because of reasons like server issues or invalid email addresses. This metric doesn't dictate the best time to email customers but it does help you gauge your email list health.
Email marketing report template
46% of brands use two or more email service providers (ESPs).
Email status reports like the one below helps you track the performance of your transactional and general promotional emails in one place.
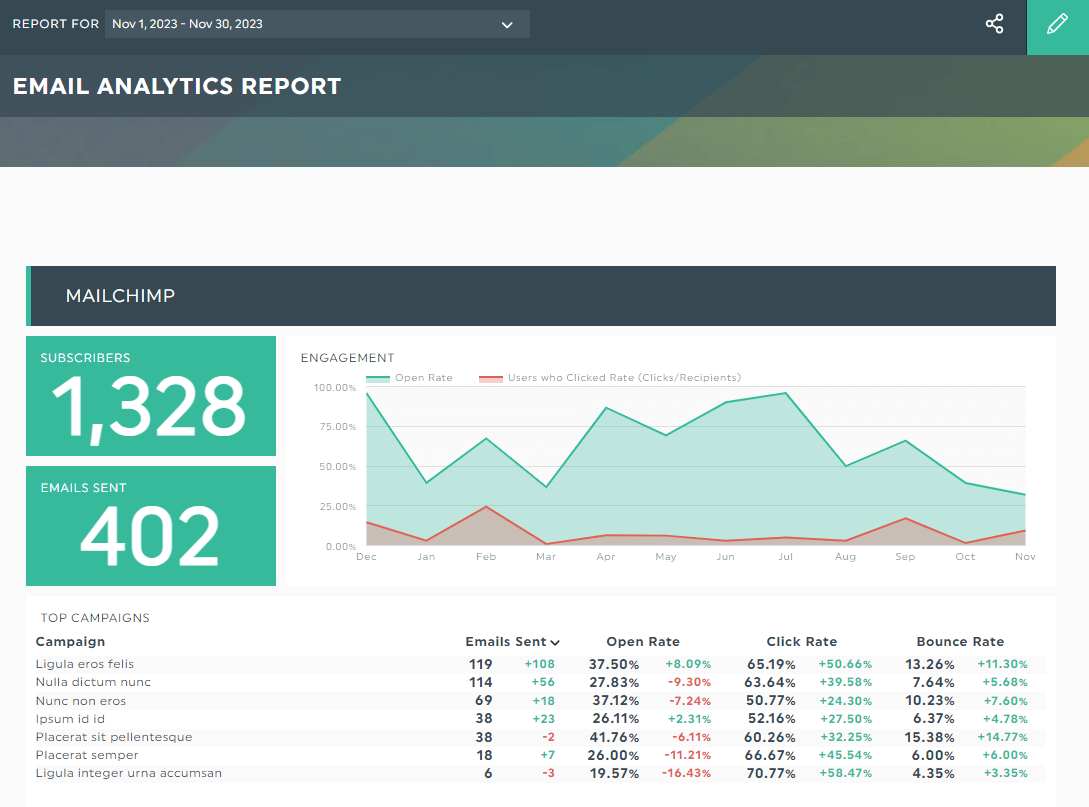
Grab this email report template with your own data!
Performance Reporting for Social Media
With social media now shifting into a full-service channel, customers anticipate rapid, round-the-clock responses to their queries.
However, brands are lagging behind.
Only around 50% of businesses are currently meeting service response time expectations.
Social media performance reporting metrics
Using social media as a dedicated support center boasts unique challenges.
Not only do you need to integrate customer data across different platforms, but you also need to navigate diverse customer expectations on these channels.
Consider using these social media reporting metrics as your base metrics for engagement and customer service experience.
- Impressions: Total number of times your posts are shown
- Clicks: Total number of clicks your posts receive
- Top posts: A list of top-performing posts based on engagement like views, clicks, and shares
- First response time: Time between a customer reaches out and support agent responds to it
- Total received messages: Total number of messages received from customers
- Resolution rate: Percentage of customer concerns that are resolved
Social media report template
Analyze your best-performing social posts from each platform, so you can understand why they did so well and repeat them in future campaigns.
Use this social media dashboard to decide which platform(s) to deprioritize and what content to focus on (e.g., company culture posts vs. popular trends) in the new year.
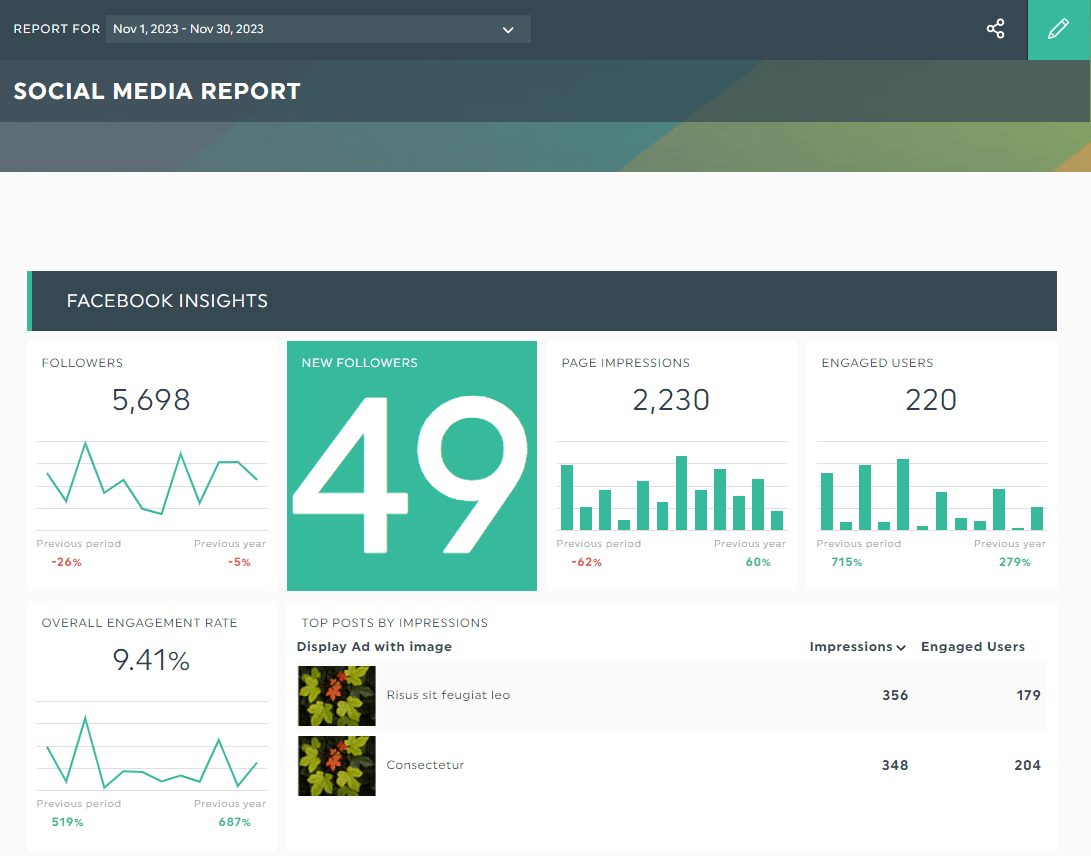
Grab this social media report with your own data!
Performance Reporting for SEO
SEO may drive 2X more revenue than other channels, but with the average post taking at least 61-182 days to rank on the first page, you want to be sure your content ticks the right boxes out of the gate.
SEO performance reporting metrics
Great content resonates with your target audience and climbs up ranks on the SERPs.
Track if your content is on the way to the top with the following SEO performance metrics:
- Organic traffic: “Free traffic”, as in the number of your website visitors who come from search engines.
- Bounce rate: Percentage of sessions that were not engaged. While not a ranking factor, this metric is nonetheless useful when analyzing user engagement.
- Keyword ranking: A website's organic ranking position for a keyword.
- Backlinks: External links that point to your website. It’s one of the most important ranking signals.
Other useful metrics to measure your SEO results include conversions, devices from organic, and referral sources.
SEO report template
Identify common themes among top-performing pages. Use this SEO progress report to decide if you need to tweak your content pillars and weed out poor quality topics.
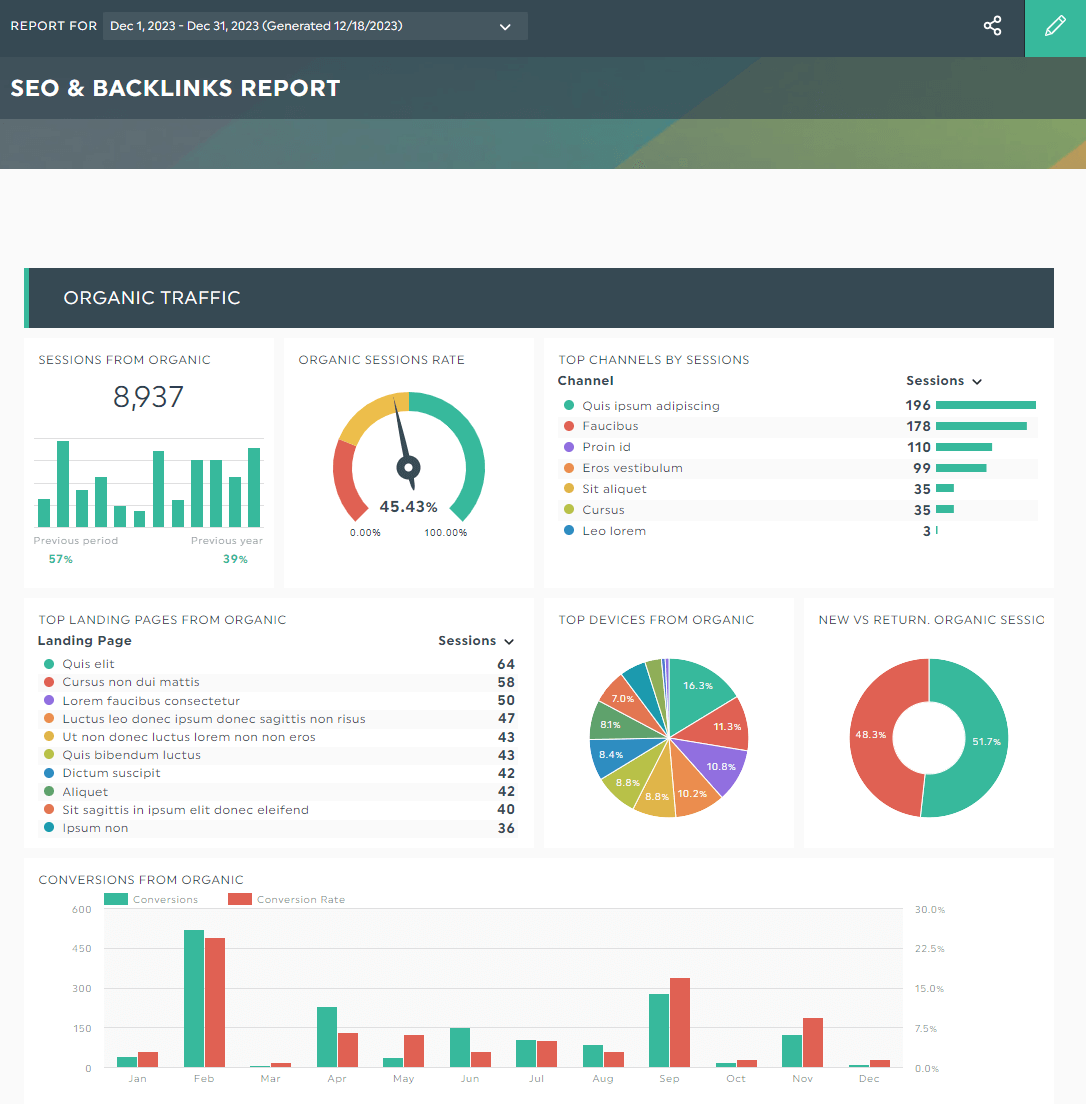
Grab this SEO report template with your own data!
Automate Performance Reporting with DashThis (3 Step Guide)
You can easily spend 30 minutes each week per client on manual reporting. With automation, you take less than 10 minutes total across all clients (proof below).
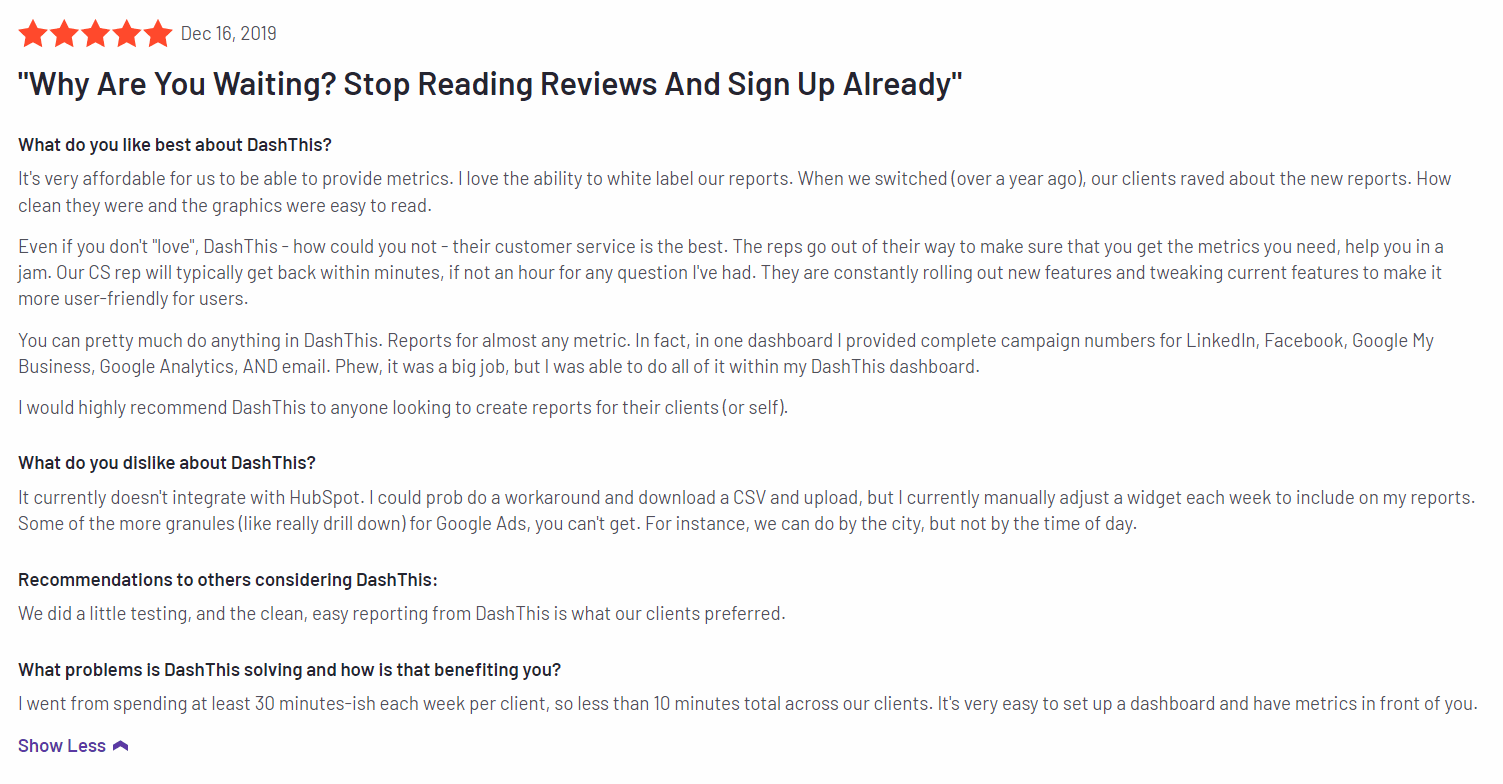
Source: G2
Long gone are the days of copy-pasting data on Excel spreadsheets.
Not only do automated reporting tools gain back hours of your time, but you also get accurate and consistent data. With your entire data automatically pulled in one place, it’s easier to analyze results holistically and extract valuable insights to improve future performance.
Consider using DashThis, the easiest reporting tool.
Whether it’s social media or quarter reports, you can automatically gather data across multiple platforms into one beautiful dashboard. DashThis integrates with your favorite channels, including Google Ads, MailChimp, Facebook Insights, and Ahrefs.
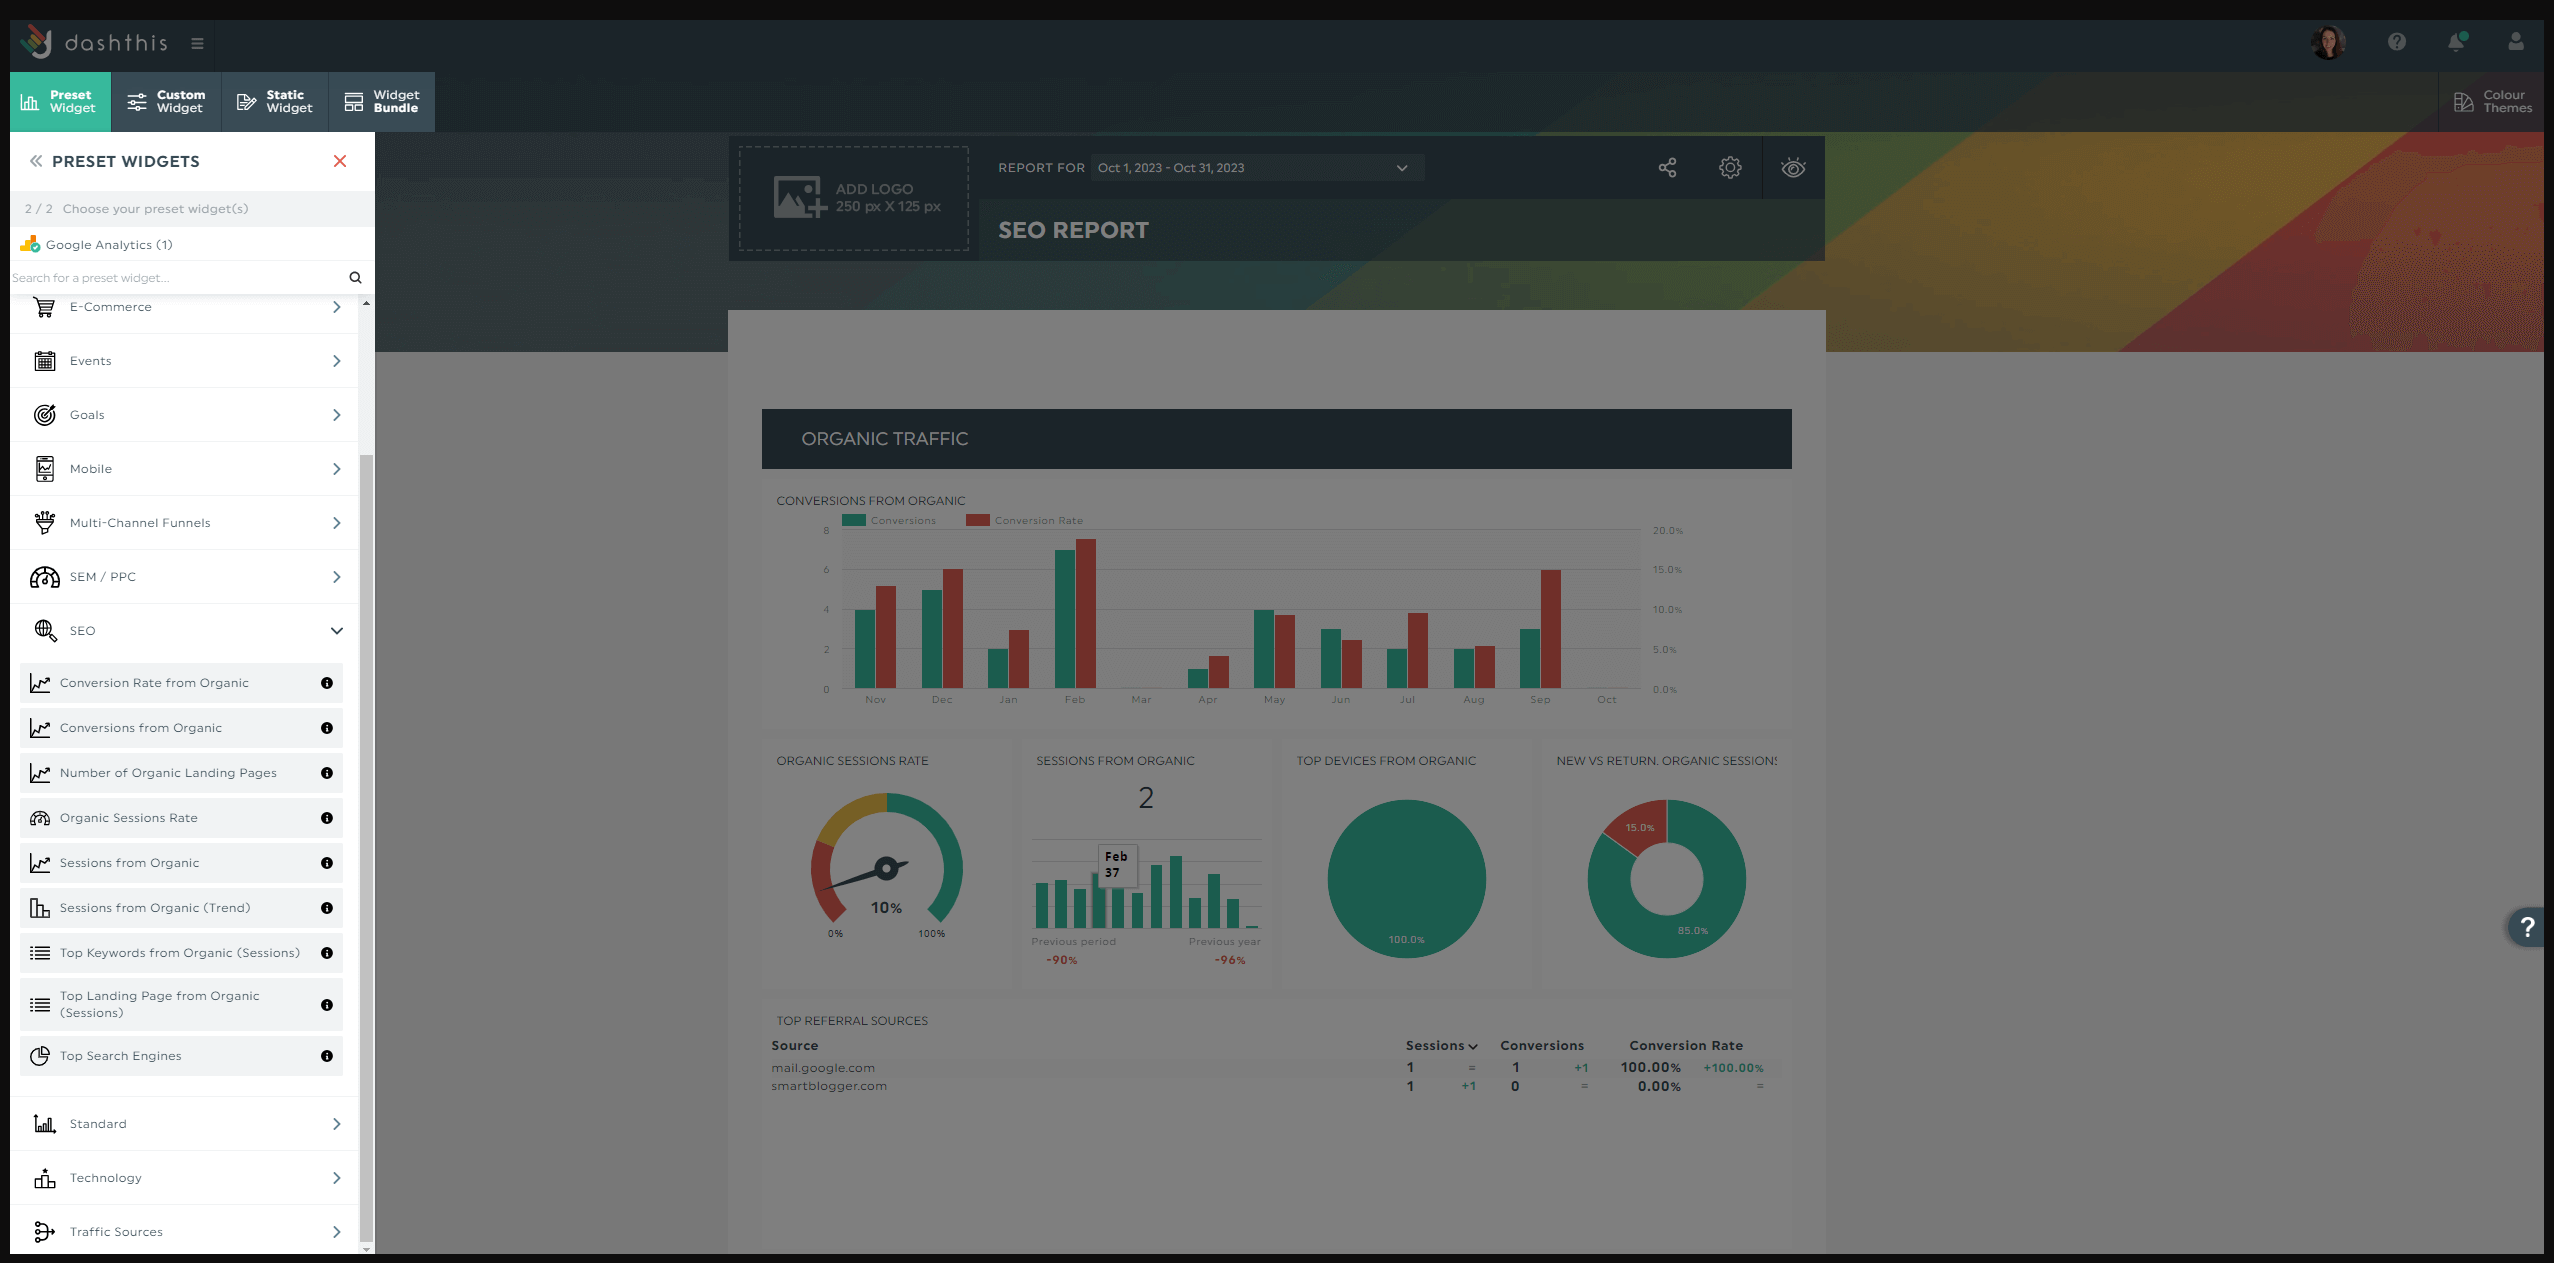
Here’s how it works:
- Select a pre-made report from over 40 templates
- Connect your marketing channels with DashThis
- Pick your metrics in Preset Widget
Sit back and wait for your performance data to appear on the right side of your screen. Drag and drop the metrics to form a cohesive look.
Now let’s talk about our other features that streamline your reporting process.
Comments
Add a comment box within the performance report to share your insights. This saves you the trouble of starting a new email thread.
Click Static Widget > Comments > Save.
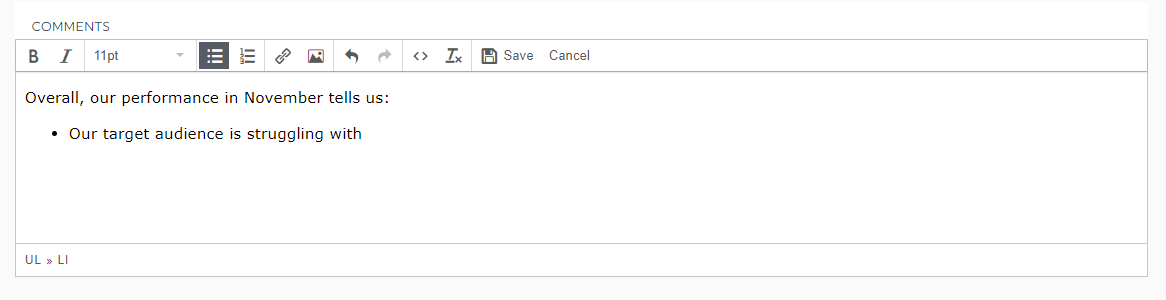
Use this comment box when:
- Answering frequently asked questions (FAQs) from clients with little marketing expertise
- Setting a baseline or project estimation for the next quarter’s budget
- Providing a quick summary of changes for current campaigns (e.g., using different dimensions for performance measurement)
- Detailing a project’s success (e.g., X number of demos booked)
- Comparing past performance initiatives
- Listing potential project risks and how you plan on overcoming them
Notes
Provide contextual information directly in your report.
Hover to a metric and click Add Note > Save.
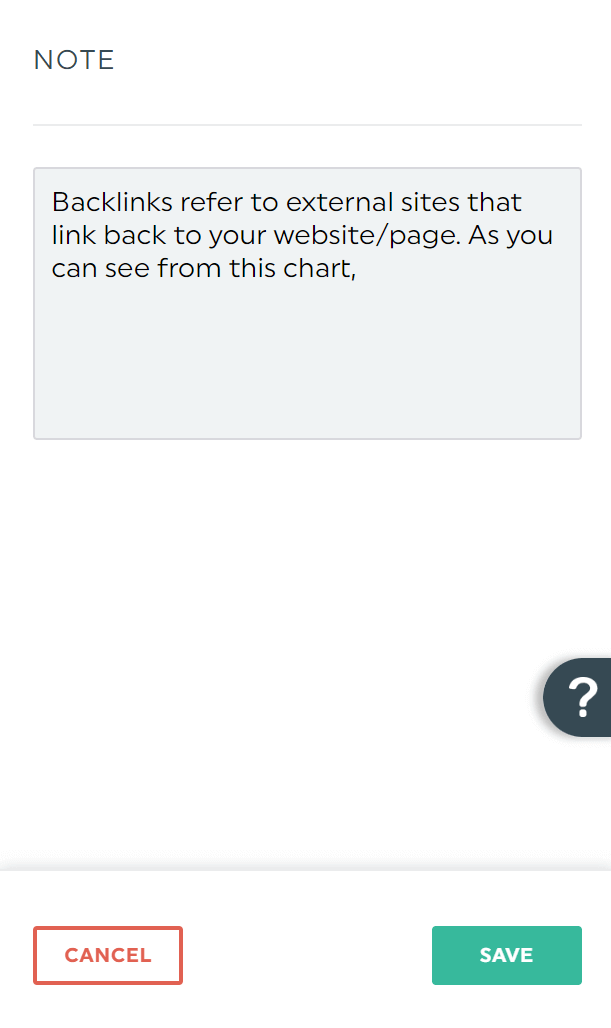
This note will appear as an orange tab in view mode
Our notes tool is helpful when:
- Benchmarking
- Providing context about erratic graphs and Gantt charts
- Explaining acronyms (i.e., key performance indicators [KPIs], metrics)
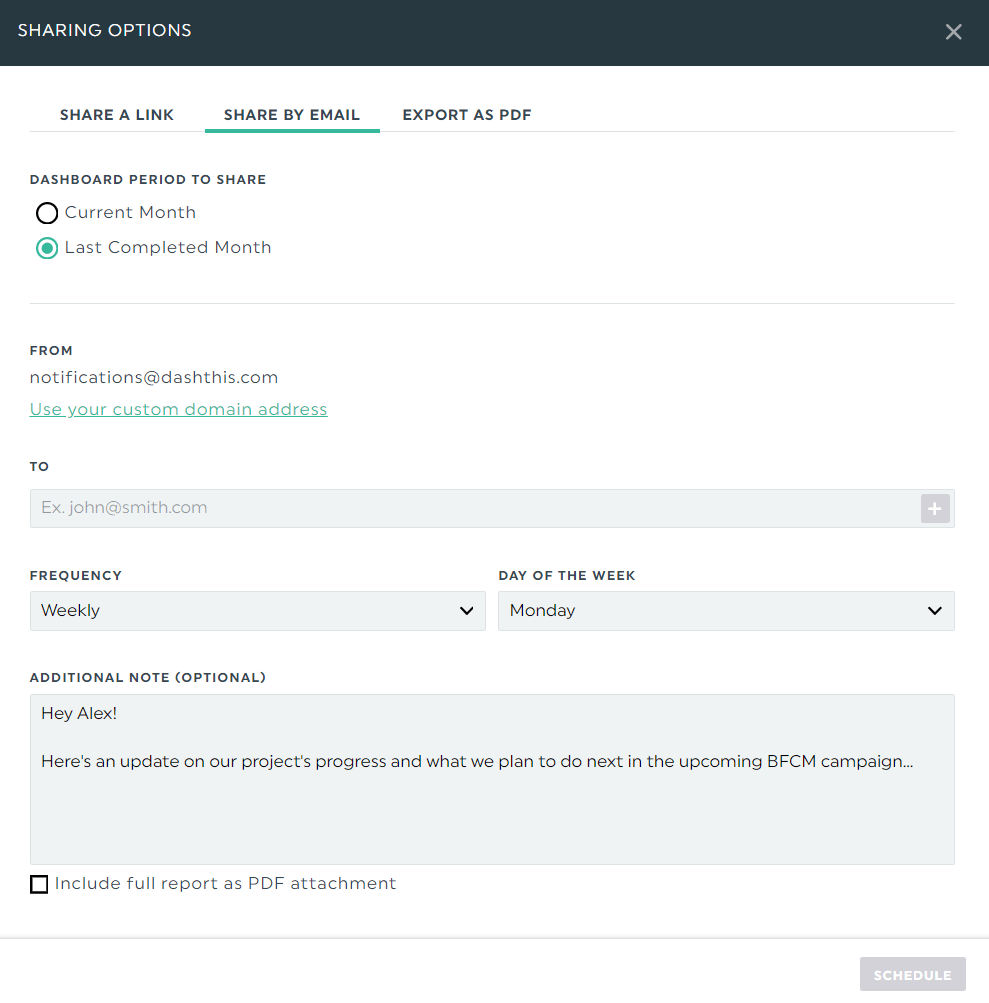
Automatic email dispatch
Schedule an automatic email dispatch to keep stakeholders (e.g., team members, clients) informed about the project plan.
Hover to the Sharing Options icon on the top right and click Share by Email. Set the dashboard period and frequency, along with the relevant email addresses, and click Schedule.
Note how it looks when you share the project’s progress and what’s ahead in the upcoming campaign.
Alternatively, copy the report’s URL link and send it over.
Both sharing options let everyone view their business performance in real-time.
Try DashThis for Your Performance Reporting Needs Today
Best-in-class organizations based all decisions on data and information.
This is where automated performance reports come in handy. Packed with digestible visuals, you only need seconds—minutes, at most—to understand the impact of your marketing efforts.
Consider using DashThis, the easiest reporting tool. Automatically gather your entire data across your favorite channels into one beautiful performance report. Start your free 15-day trial today.

Ready to track your campaign performance?
Read More

Don’t miss out!
Follow us on social media to stay tuned!
Automate your reports!
Bring all your marketing data into one automated report.
Try dashthis for free