Digital Marketing KPIs and Metrics: The Ultimate Guide

If you're not tracking your marketing efforts, how will you know if they're working? That’s when Key Performance Indicators, or KPIs, come into play! KPIs help you measure the key metrics that matter the most to your business so that you can keep scaling.
Let's take a closer look at what you need to know about tracking your digital marketing KPI.
- What is a Digital Marketing KPI?
- Why You Need to Track Your KPIs
- How to Track Your KPIs for Digital Marketing
- The Most Important Digital Marketing KPIs
- - General Marketing KPIs
- - Search Engine Optimization (SEO) KPIs
- - Social media KPIs
- - Paid advertising (PPC) KPIs
- - Email marketing KPIs
- How to Choose the Right KPIs to Track
- What NOT to Track
What is a Digital Marketing KPI?
A key performance indicator (KPI) is a quantifiable measure, or metric, that you can use to gauge some aspect of your business' performance and marketing activities. KPIs can be related to any part of your business, from employee performance to sales funnel. Here's an example of digital marketing metrics:
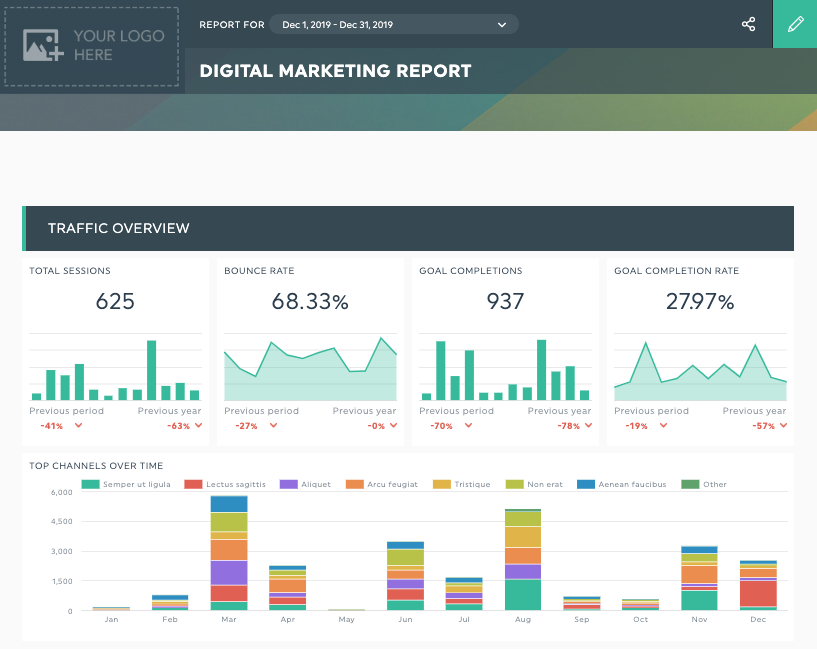
Grab this report template for yourself
Digital marketing KPIs are metrics that are directly tied to your digital marketing strategy, such as:
- Lead generation KPIs,
- Brand awareness KPIs,
- Sales growth KPIs,
- Search engine optimization (SEO) KPIs.
These KPIs can come from multiple types of tools and platforms:
- Your social media channels: Linkedin, Facebook, Instagram, Twitter
- Your PPC tools: AdWords, now Google ads, or bing ads
- Your web analytics tools: Google Analytics
- Lead conversion tools, or your sales team's tools.
Why You Need to Track Your KPIs
To have a better idea of your marketing performance and therefore attain your marketing goals.
You need to track your digital marketing metrics to understand what's working and what isn't clearly. If your marketing spend generates a profit but you have no idea where it's coming from, you’ll never know where to invest your marketing budget.
For example, your SEO might be driving almost all of your qualified leads and sales while you're throwing money away on other marketing channels, like PPC ads, that aren't driving any.
In today's digital landscape, with the capacity to closely monitor the customer journey and benchmarks, it's easy to see precisely where your paying customers are coming from, your cost per lead (CPL), cost per acquisition, what digital marketing efforts worked best, etc.
With this knowledge, you can drop the unprofitable parts of your strategy and focus on making the profitable ones work even better.
How to Choose the Right KPIs to Track
Choosing the right KPIs for digital marketing isn't a "one-size-fits-all" decision. The best KPIs for one company to track aren't necessarily the same for another.
You need to look at your goals and work backward to choose the best KPIs for your business. For example, if your lead follow-up is done over the phone or face-to-face, there's no need to track content marketing KPIs.
Regardless of what KPIs are most valuable for you to track, they must meet the SMART criteria. The KPIs you track need to be:
- Specific
- Measurable
- Achievable
- Relevant
- Timely
In other words, the KPI needs to provide a specific result that digital marketers can measure, that can be identified when you achieve it, that is relevant to your goals, and that can have a deadline or timeframe applied.
How to Track Your KPIs for Digital Marketing
Tracking various digital marketing metrics will give your marketing team all the information they need to make data-driven decisions about your business. However, updating this information can be challenging, especially if marketing across several channels.
That's where a digital marketing reporting dashboard software can help.
1- Connect your marketing integrations;
2- Choose between a range of report templates to track KPIs for SEO, your PPC metrics, email marketing report template KPIs, social media metrics, and more;
3- The tool will gather all your most important KPIs into an automated KPI dashboard so you can see up-to-the-minute metrics whenever you want. You can also take advantage of AI insights to automatically surface trends and anomalies in your data, saving you hours of manual analysis
Grab this template for yourself
Sign up today for a 15-day trial and get 10 free dashboards just like this one.
The Most Important Digital Marketing KPIs
While the specific combination of KPIs you track will depend on your business and precisely what channels you're targeting with your digital marketing campaigns, several categories apply to most companies doing business online. These include:
- Search engine optimization (SEO)
- Social media
- Paid search engine marketing (SEM)
- Email marketing
There are also some general marketing metrics and KPIs that most companies will benefit from having.
General Marketing KPIs
Dive into the core of your marketing effectiveness with these essential marketing KPIs, highlighting where your strategies shine and pinpointing opportunities for refinement.
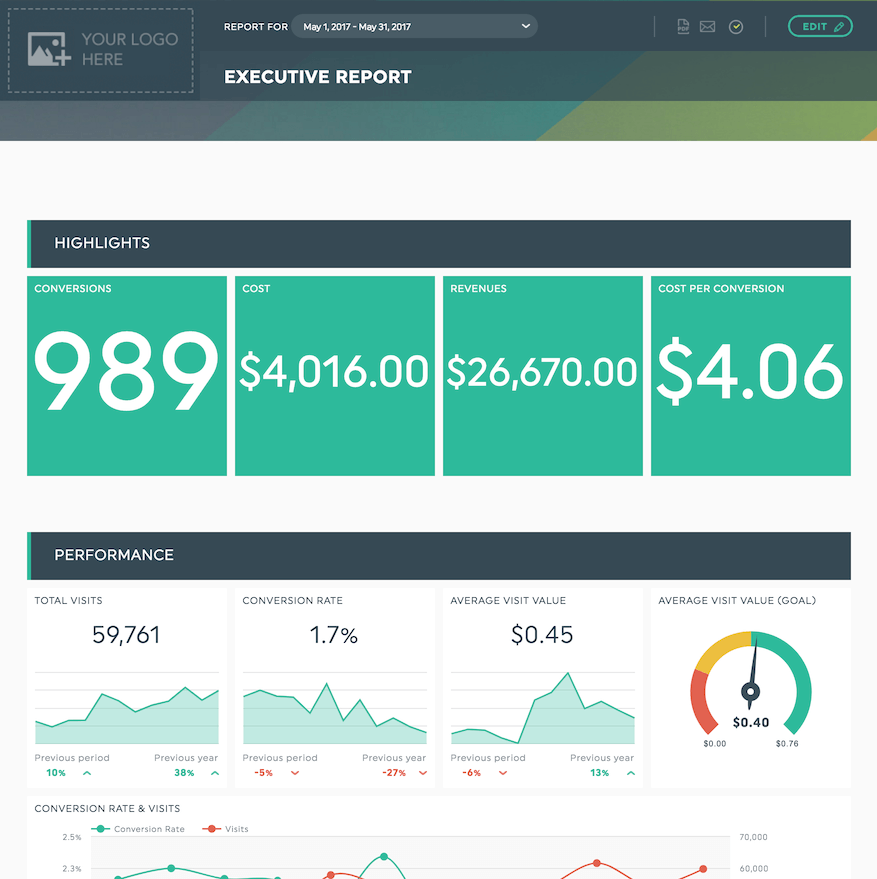
See this executive report template live
Customer Lifetime Value (CLV)
The lifetime value of a customer is how much revenue a typical customer generates over time. Depending on your typical retention rate and back-end product or service offerings, this could be a matter of days, weeks, months, or years.
Customer Acquisition Cost
The acquisition cost is the amount you must spend to acquire a new customer. This could include advertising, sales calls or visits, and anything else that goes into your prospecting and conversion process.
Return on Investment (ROI)
The ROI is a function of the previous two KPIs. It tells you how much profit you generate when you compare your customer acquisition cost to the revenue generated.
Conversion Rate
The conversion rate is the percentage of visitors who turn into leads and leads into customers. This is generic marketing metric but can also apply to any other category if you want to track each channel separately like organic, paid or referral traffic. You could also track the total number of leads or conversions.
Search Engine Optimization (SEO) KPIs
Navigating the world of search engine optimization (SEO) can be complex, but monitoring the right KPIs can demystify the process and drive your strategy forward.
Search Traffic
Search traffic metrics include total visits, unique visitors, organic traffic, website visitors, traffic sources, page views per session, top web pages, and other KPIs related to the traffic coming to your site from Google and other search engines.
Keyword Rankings
Keyword ranking will tell you where your site ranks for your most valuable keywords and phrases. You can track changes in ranking over time to see what is working and what isn't with your SEO efforts.
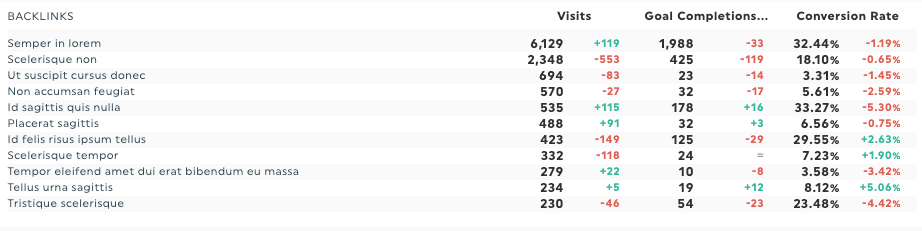
Backlinks
Backlinks are an essential factor in search engine optimization. This KPI lets you track how many other sites are linking to yours. You can see how those links affect your rankings and traffic when combined with the search traffic KPIs.
Domain and Page Authority
Domain authority measures the authority the search engines attribute to your website—in other words, how important they think your content is. Page authority is the same type of measurement on a page-by-page basis.
Bounce Rate
When a visitor lands on a page on your website and immediately clicks away, it's called a bounce. Tracking this KPI will help you improve your landing pages to get visitors to stay on your site longer.
Social Media KPIs
Social media KPIs are essential for understanding how your posts resonate with your audience and measuring the effectiveness of your call-to-action. These metrics provide valuable insights into your social media performance, highlighting what’s working and identifying areas for improvement to optimize engagement and drive results.
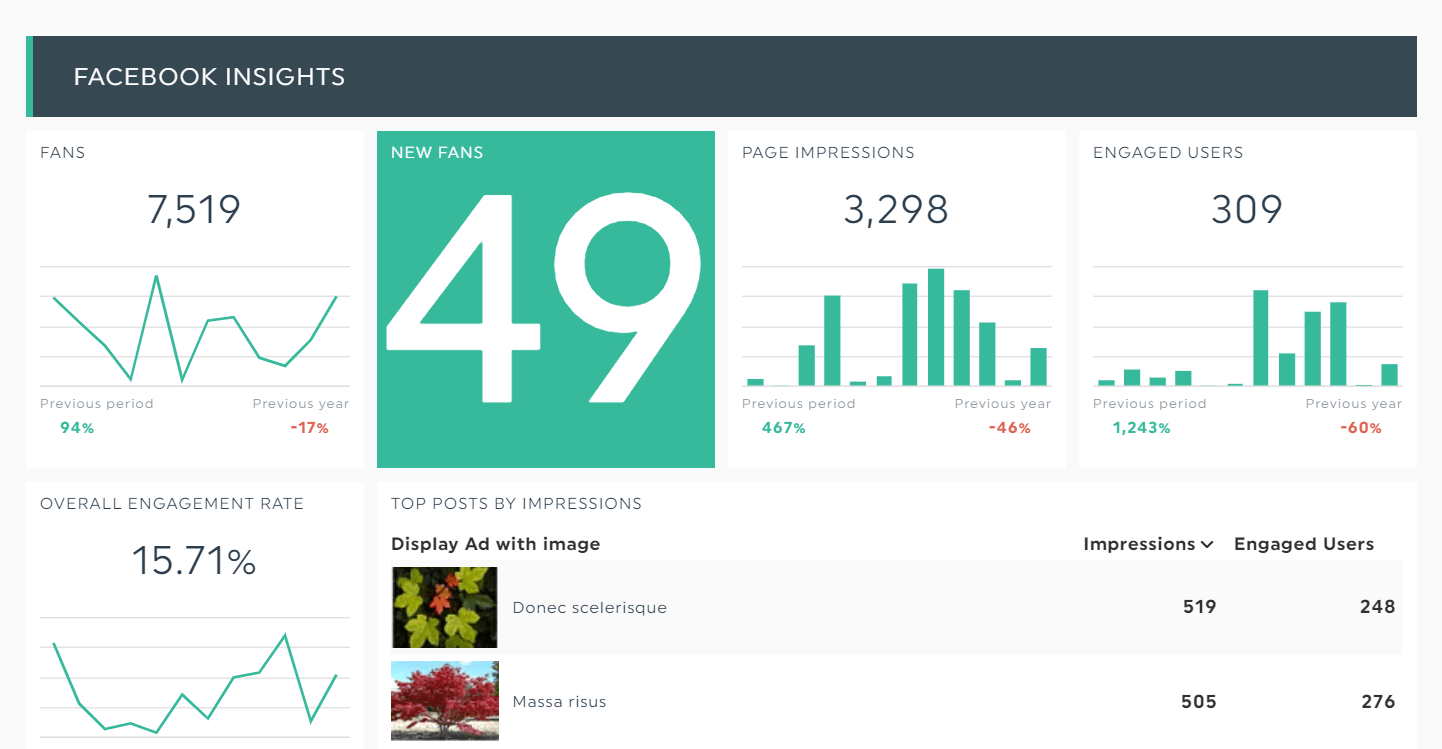
See this social media template live
Likes, Comments, and Shares
Likes, comments, and shares are the lifeblood of social media sites. If social media is one of your target channels, these KPIs will tell you how much exposure you get on those sites.
Follower Growth Rate
You need a steady stream of new followers to generate new leads and potential customers. This KPI will measure the growth rate over some time.
Social Media Traffic
Social media traffic metrics cover all the same things as SEO traffic (visits, unique visitors, traffic sources, etc.) but from social media sites in particular. You may want to track your KPIs and specific numbers for each channel.
Social Media Conversions
Like social media traffic, you may want to track the number of conversions overall and the results of each channel.
Paid Search Marketing KPIs
Check out the key paid search KPIs to track your ads' performance, spot trends, and make your budget work harder for you. Time to dial in on what's paying off!
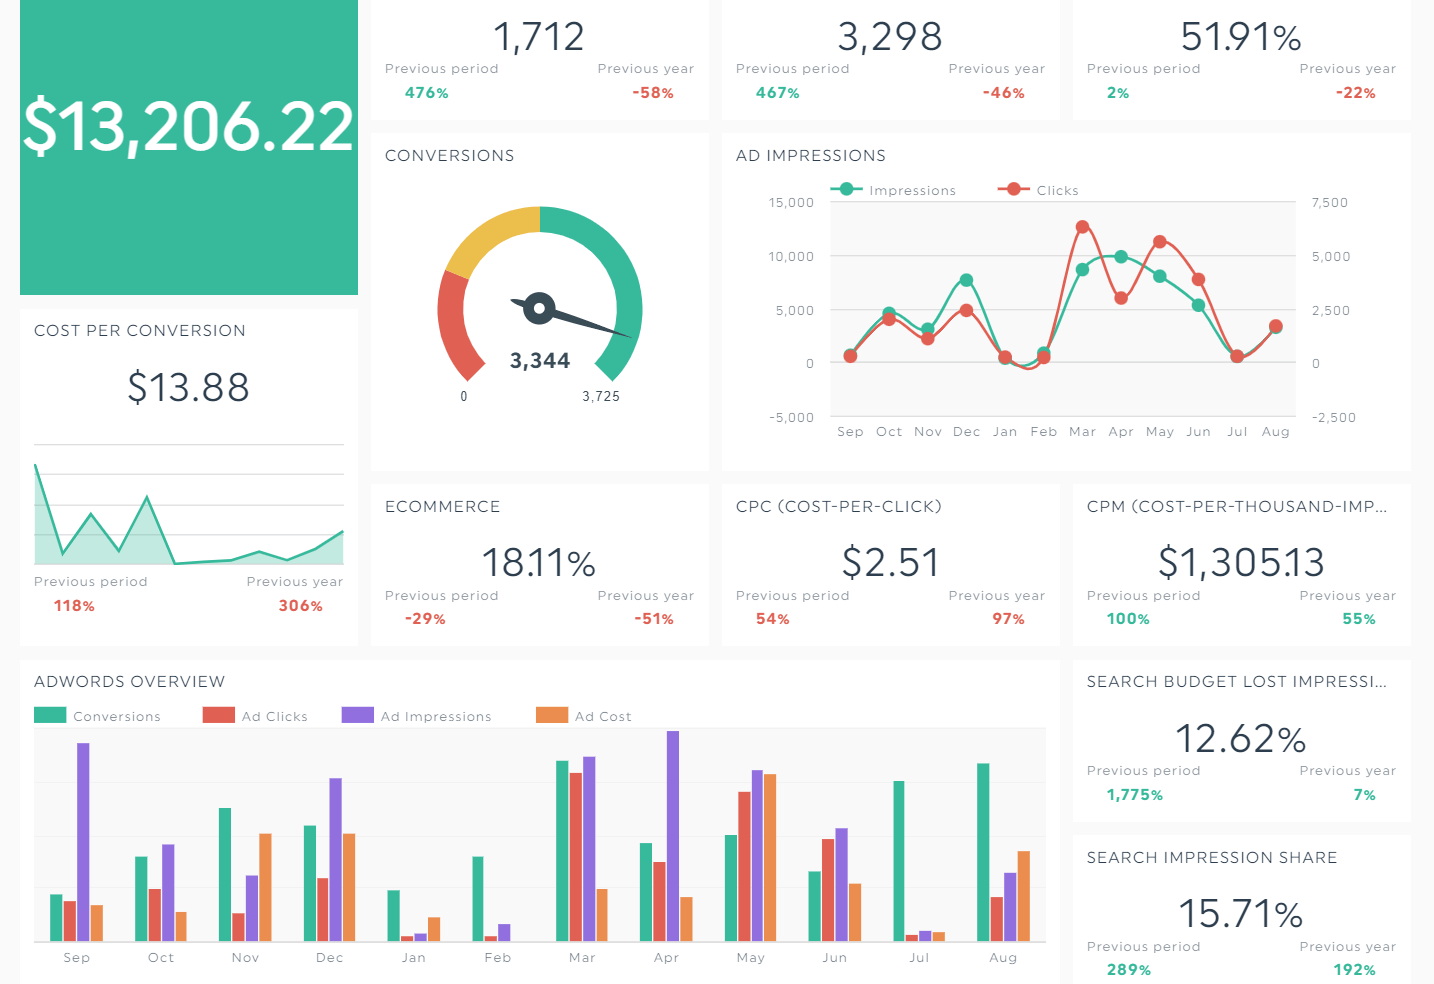
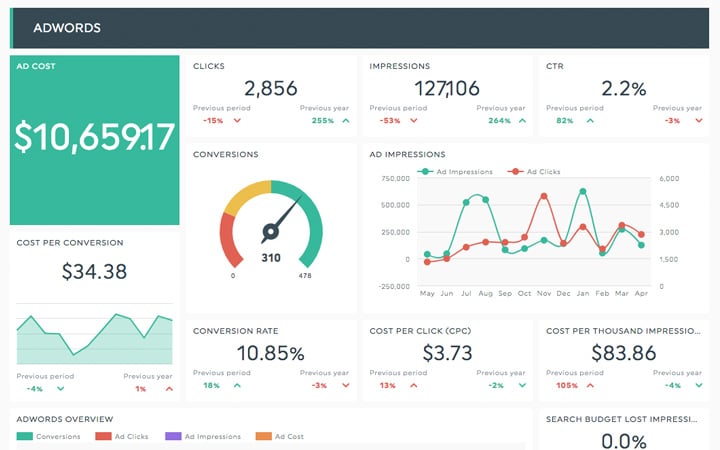
See this PPC report template live
Cost-Per-Click (CPC)
CPC (Cost Per Click) is a key performance indicator that measures the price paid for each click in a pay-per-click advertising campaign. It is essential for evaluating the cost-effectiveness and profitability of online ads.
Ad spend
"Ad spend" refers to the total amount of money allocated to advertising campaigns across various media channels over a specific period.
Click-Through Rate (CTR)
Click-through rate is another fundamental KPI to track when paying for traffic. A better CTR brings you more traffic and could help lower your CPC in some ad networks.
Quality Score
Ad networks use your ad campaign's quality score to determine your CPC. A more relevant ad with a better CTR will generally have a higher quality score, which results in lower CPCs.
Email Marketing KPIs
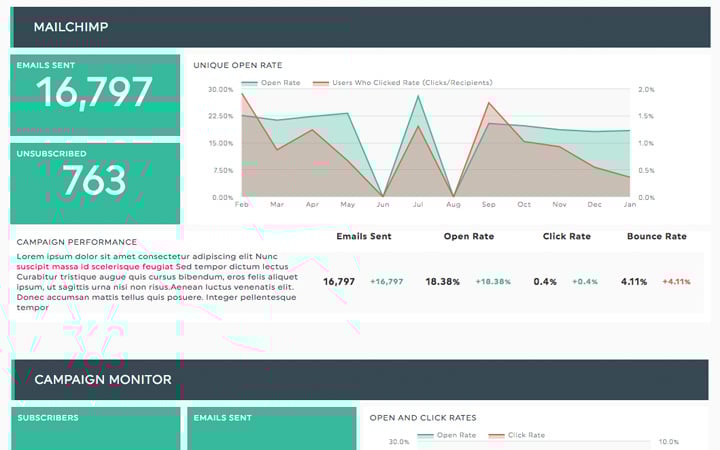
See this email marketing template live
Signup Rate
The signup rate for email marketing is the percentage of visitors to your site who sign up for your email list, whether you offer a newsletter, white paper, case study, or any other incentive.
Open Rate
The open rate is the number of people on your email list who open your messages. This KPI is an excellent indicator of the effectiveness of your subject lines.
Click-Through Rate (CTR)
If you include links to pages on your website, products or services, or anything else in your emails, you can track how many people click on those links to measure the engagement.
Bounce Rate
The email bounce rate is different from that of website traffic. An email bounce is an undeliverable email - it "bounces" back to the sender.
Unsubscribes
Every email you send your customers likely has an unsubscribe link so they can remove themselves from your list. This KPI lets you track the number of unsubscribes to see what messages are most effective and which lead to more unsubscribes.
What NOT to Track
The ease of tracking any marketing metrics, from website traffic to e-commerce metrics, churn, CPA, or organic search, can be a double-edged sword. It makes it easy to track essential metrics, but it also makes it easy to track things that have no value, wasting valuable time and focus.
When deciding on what KPIs you will measure, consider whether the information will give you valuable insights into improving your bottom line.
If the metric isn't something you can act on or affect, it's likely a vanity metric, so it's not worth tracking.
For example, you might be tempted to track vanity metrics like Facebook likes or Twitter followers. While these numbers might look impressive, they don’t provide actionable insights unless they are tied to a desired action or specific campaign goal. If you’re not actively running a social media campaign focused on increasing likes or followers, tracking these metrics is simply a waste of time. Focus instead on KPIs that drive meaningful results for your business.
Automate Your Marketing Reporting Today!
The challenge now lies in integrating all your marketing channels into one place.
Gather your entire marketing data into one beautiful report with DashThis. By having all data at a single glance, you can quickly analyze your overall marketing performance and draw unique insights to give your company a competitive edge.
DashThis is the easiest reporting tool. Pricing starts at $44 per month when billed annually. Start your free 15-day trial to make sense of your data today.
Try DashThis with your own data for free!

Track all your KPIs in one easy-to-use dashboard
Read More

Don’t miss out!
Follow us on social media to stay tuned!
Automate your reports!
Bring all your marketing data into one automated report.
Try dashthis for free