How to design a helpful client communication dashboard in minutes

Does your client communication strategy involve hours of calls, lengthy email chains, or spreadsheet file names like “ppc-campaign-comms-report final.xlsx?”
If you’re spending hours on client communication or formatting and wondering if there’s a better way, we have good news, there is!
With a communication dashboard, you can condense your client communication plan into a sleek dashboard that automatically updates in real-time.
Investing in reporting may set you up to keep that critical account for much longer. Here’s how.
- What is a communication dashboard
- 6 steps to building a client communications dashboard your clients will love
- - Step 1. What do you plan to do with your dashboard?
- - Step 2. Select KPIs and data aligned with your goals
- - Step 3. Tailor your language (and content) to your audience
- - Step 4. Use the comment box to add high-level insights or notes to specific widgets
- - Step 5. Automate the sending of your report
- - Step 6. Tweak your communication dashboard over time based on client feedback
- Build your communication dashboard with these helpful templates
- Go above and beyond and wow your clients with a communications dashboard
What is a communication dashboard?
Communication dashboards help clients and agencies facilitate conversation and monitor progress.
Instead of sending static PDF files or spreadsheets through email, dashboards use data visualization to monitor campaign key performance indicators (KPIs) and track essential information.
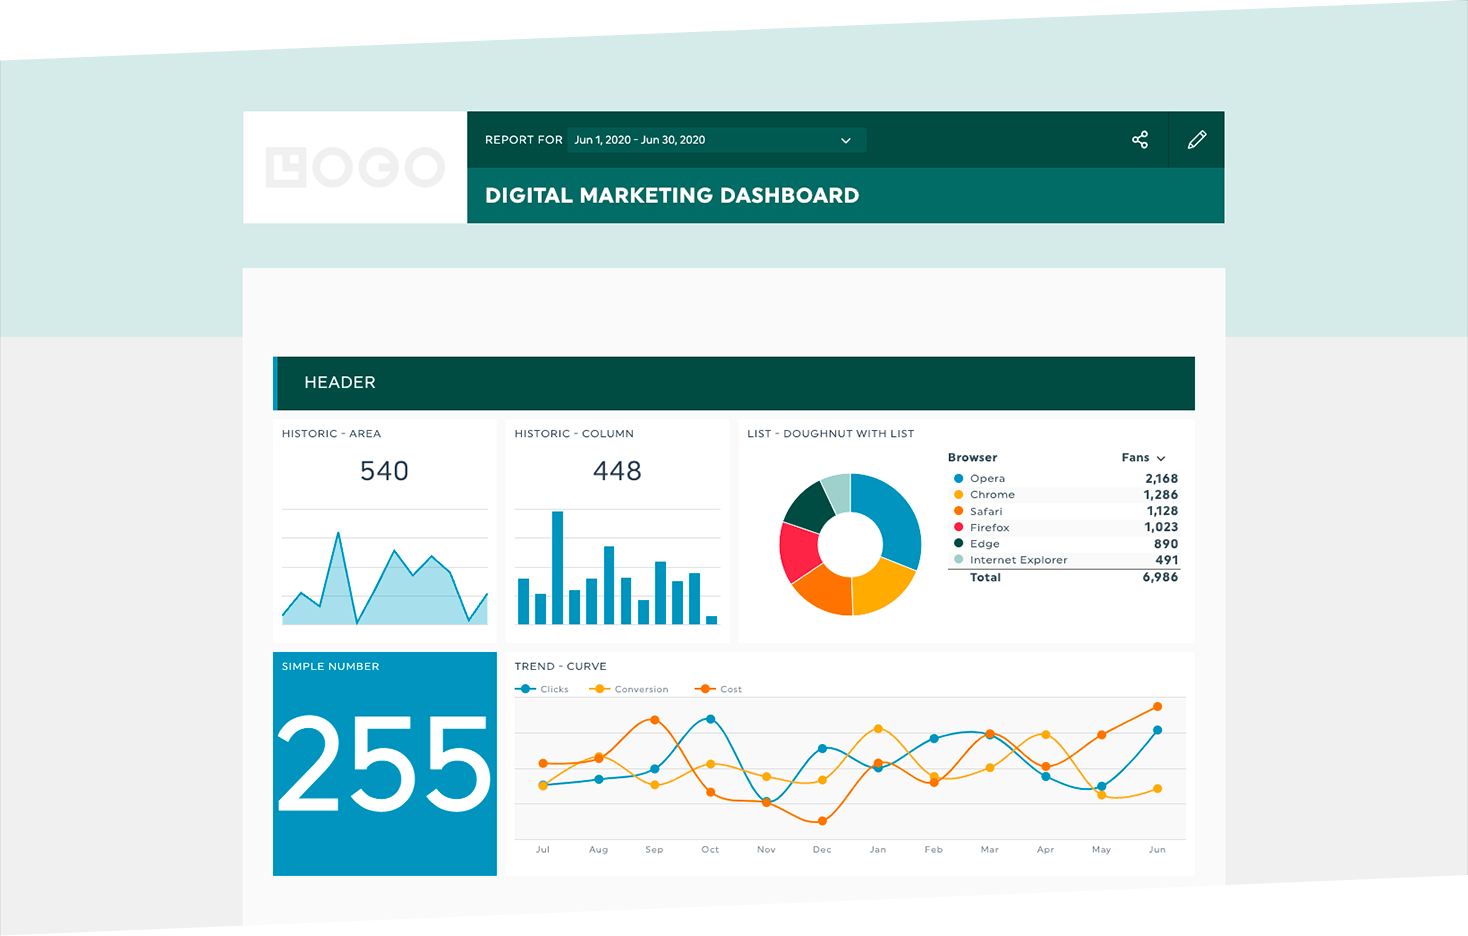
Caption: DashThis’s white-labeled dashboard helps agencies create good-looking dashboards representing their brand.
How dashboards come in handy for client communication
- Get complete visibility on campaign performance: If your clients have questions about their marketing campaign, they can check the dashboard without your involvement. Discussions and campaign optimization also go smoother when you have your metrics in front of you.
- No more wondering if you sent the right file: Marketing campaigns change quickly, and the report you sent 15 minutes ago might be outdated. Dashboards update in real time, ensuring you always have the latest data at your fingertips to make decisions.
- Aids client retention by quantifying your value and impact: Reporting is a great way to show off your agency's work. How much are your campaigns contributing to the business's bottom line? Your client will see how you're a valuable partner if you link your campaign to concrete results and present them in a report.
Read more: Here’s how full-service marketing agency Jelly Marketing uses DashThis to save over 20 hours of work per month.
6 steps to building a client communications dashboard your clients will love
Whether you're building your first communications dashboard or reviewing what's on yours, we've got a step-by-step guide to getting it right.
Step 1. What do you plan to do with your dashboard?
Start with the end in mind before deciding what to include.
Maybe it’s monitoring the return on investment (ROI) and engagement of an ongoing email marketing campaign. It could also be more strategic, like drilling down into your web traffic sources for insights on which marketing channels to focus on or planning a social media campaign.
Some questions to consider:
- What questions does your client (or their stakeholders) ask you regularly?
- What frustrations have you and your client expressed as they review your reports?
- What answers do you need to have at your fingertips?
- What are your client’s business goals and success criteria?
Action steps:
- Review previous client communications and identify recurring questions or frustrations in previous reports.
- Get your client involved! Review your client onboarding documents or conduct survey research with your client’s permission.
Step 2. Select KPIs and data aligned with your goals
Once clear on your dashboard goals, it’s time to define the metrics that indicate success and what to put in your dashboard.
Tip: Too many KPIs in one dashboard dilutes your dashboard’s effectiveness. As a rule of thumb, keep it between 5-8 KPIs, with 10 KPIs maximum in a dashboard.
How do you know if you’ve chosen the right metrics?
- Your metrics relate to the question you’re answering or monitoring. For example, if you’re assessing how effective paid advertising is for your marketing strategy, add cost/revenue-related metric benchmarks like cost per lead, compare conversion rates across channels, and overall customer lifetime value.
- An action directly affects the KPI. Example: Achieve a 5% uplift in e-commerce conversion rates within the next quarter.
Action steps:
Review our library of dashboard examples if you’re stuck trying to select the right KPIs for a specific client goal. (We’ve also got 100+ KPI examples if you need a refresher on what each metric means.)
Step 3. Tailor your language (and content) to your audience
Just like your KPIs and metrics, you also want to be intentional with how you present your data and the language you use in your communication dashboard to make them pack a punch.
Follow our step-by-step thinking guide. (with examples)
- Who will review the dashboard data besides your client and their team? For example, sales or revenue teams might review marketing campaign data.
- What metrics or outcomes do these people care about? Revenue and growth teams might care about revenue growth and appreciate metrics about sales opportunities or customer acquisition.
- What do their stakeholders want from them? The growth team makes sure revenues continue on an upward trend.
- How can your dashboard help them meet these responsibilities? The revenue team might want to see the impact of your campaign on net new sales opportunities and the number of qualified leads from your campaign to fill the sales pipeline.
These points will help you tailor your report (and language) accordingly and think through how your report will be perceived from multiple angles, creating a more helpful dashboard for everyone.
Step 4. Use the comment box to add high-level insights or notes to specific widgets
Data visualizations and excellent graphics do wonders in making data more accessible. But sometimes, you need to add more explanation or context to your metrics to educate your clients.
That’s where comment boxes come in handy to add context without introducing clutter or sacrificing visual clarity.
To embed a comment box in your DashThis report, go to Static Widget > Comments
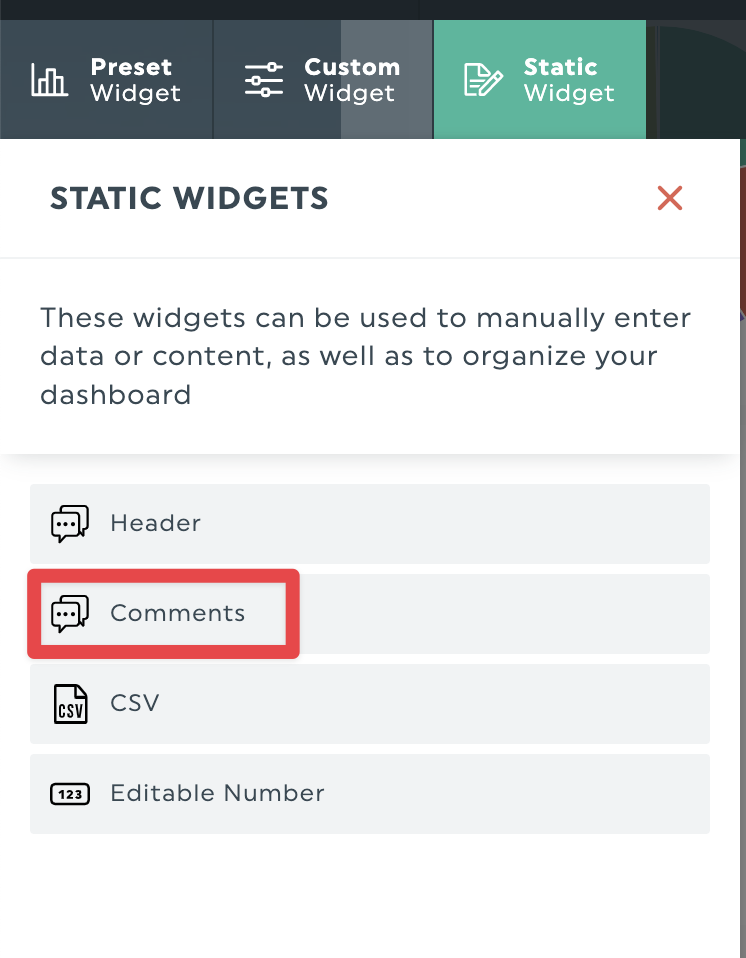
You’ll get an editable box to add high-level insights to your dashboard.
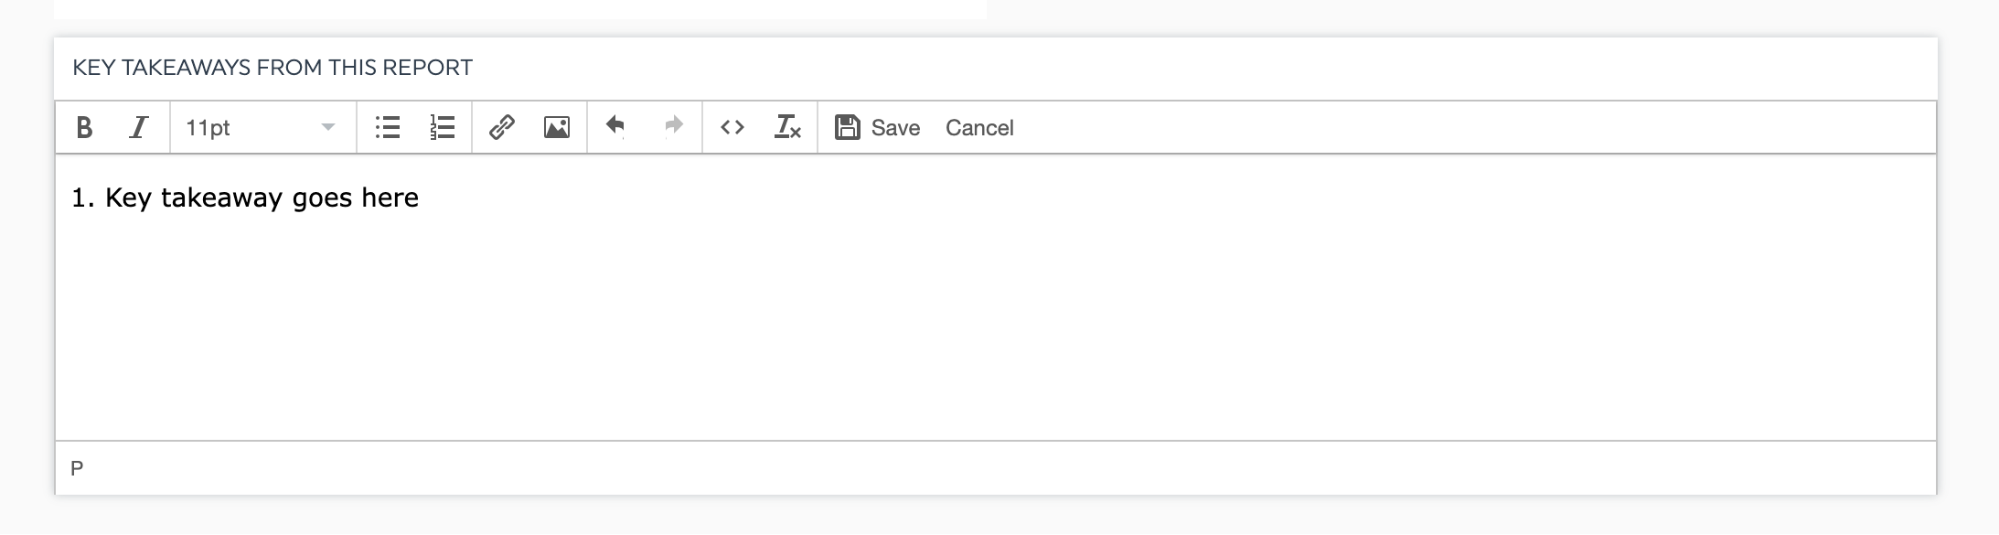
How to use comment boxes to spice up your communications dashboard:
- Summarize your key results or takeaways of the entire report.
- Add an image or screenshots from other tools as supporting information
- Define unfamiliar terms or jargon for people unfamiliar with digital marketing
- Propose next steps or recommendations to improve a KPI
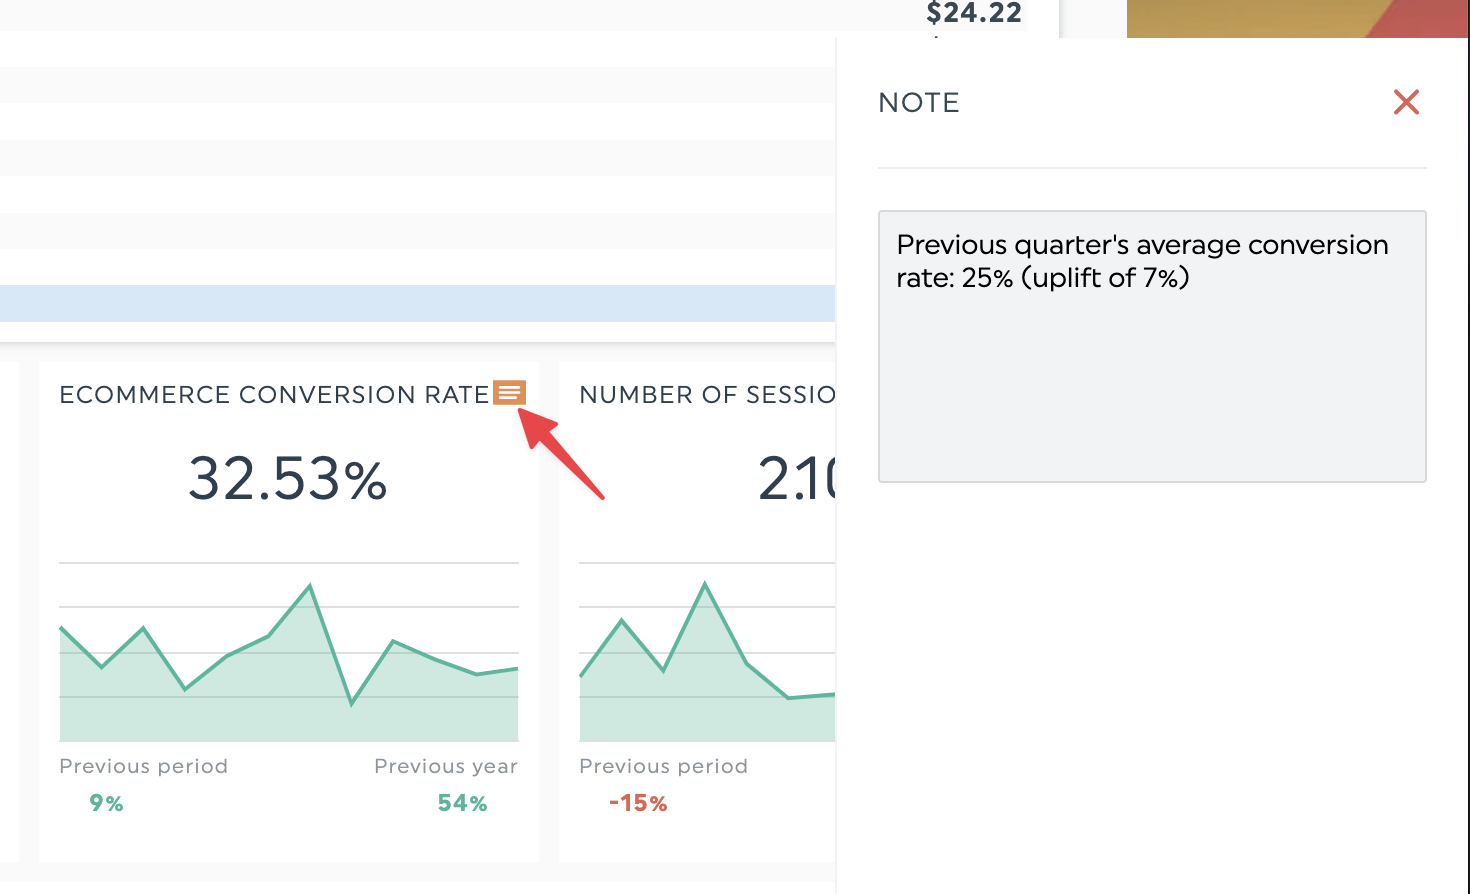
Alternatively, you can add a note to a specific widget to explain each chart or add valuable context. Select the metric and click Add Note.
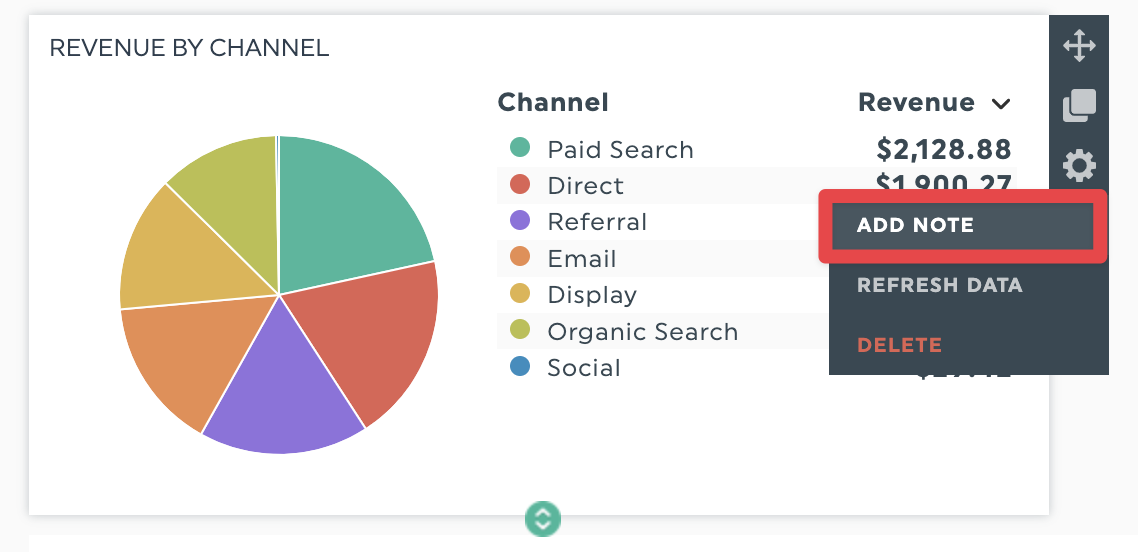
The added note will appear on the right side of your screen in a separate panel, accessible in view mode.
Step 5. Automate the sending of your report
Having finished your shiny new client dashboard, it's time to deliver it.
The most common method is to export your report to a PDF document or send a link to an Excel spreadsheet through email.
But agency life gets busy, and even the best of us have missed a report deadline.
A client communication dashboard tool automates this essential yet tedious task to ensure you never miss a deadline again. Not only does this make your life easier, clients appreciate it if you communicate proactively and often.
Sounds good all around. Here’s how to set up the automated reporting functionality that works for you around the clock.
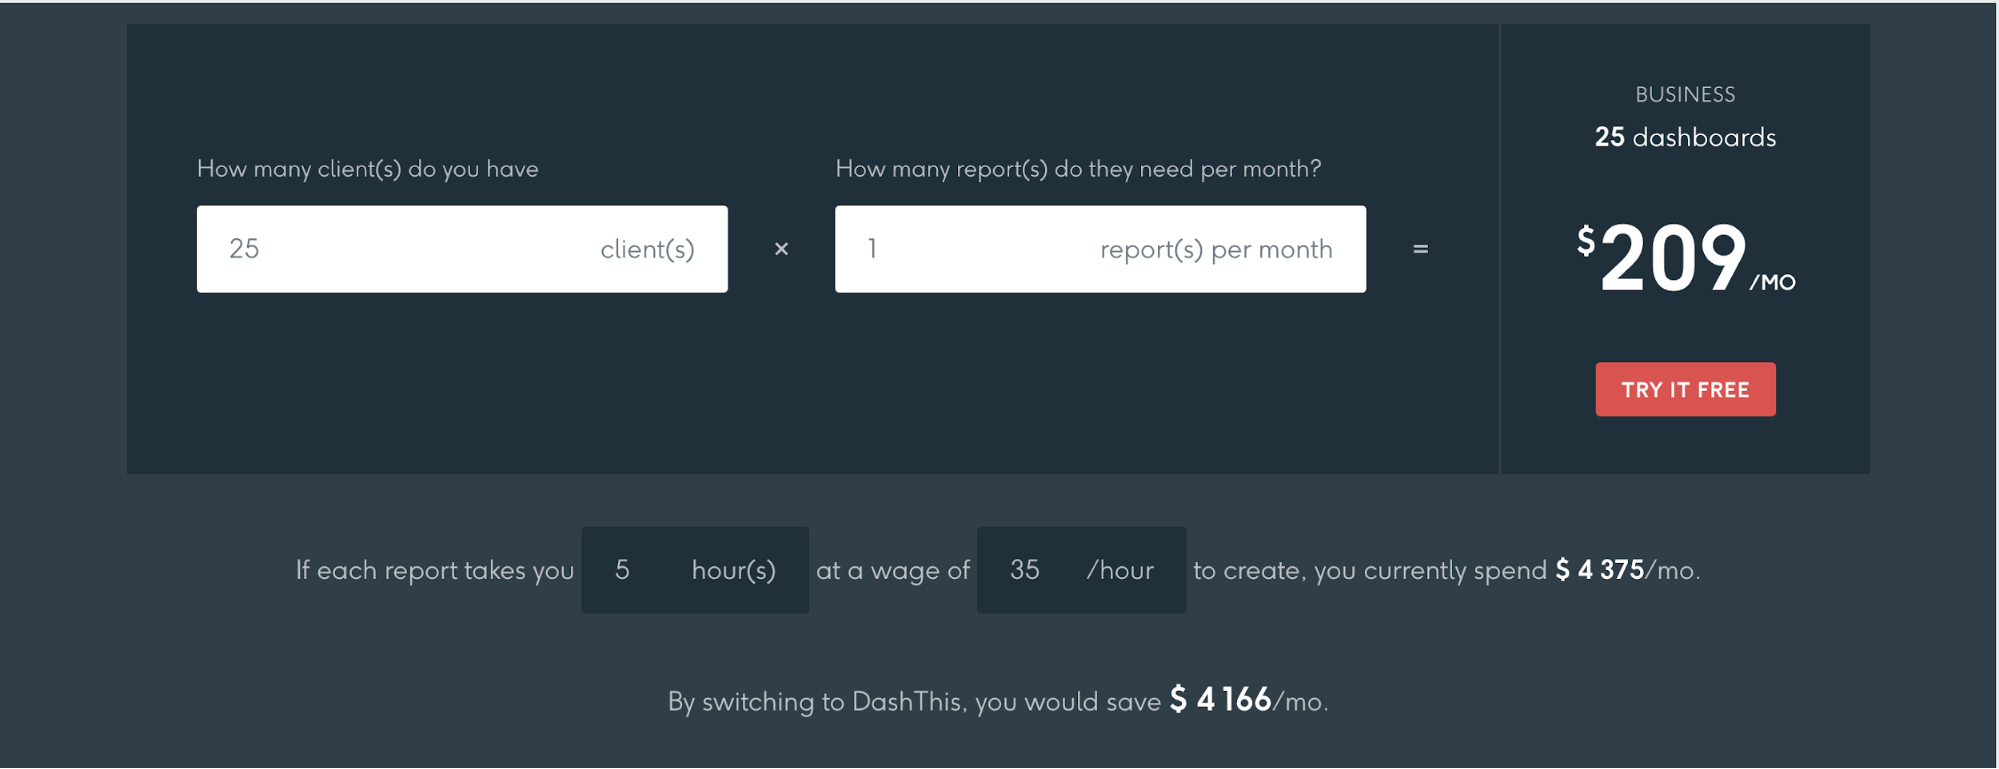
Check it out: How much time and money will you save with report automation? Use our pricing calculator to find out. You could save almost $60,000 yearly if your agency is anything like our example below!
Step 6. Tweak your communication dashboard over time based on client feedback
Once you’re done, send it out to your client (bonus points if you automate the reporting process).
Expect your communications dashboard to evolve as clients’ needs change or as you introduce different campaigns into the mix. Check in with your client as you review your reports monthly to see if your communication dashboard meets their needs.
Build your communication dashboard with these helpful templates
Executive report template
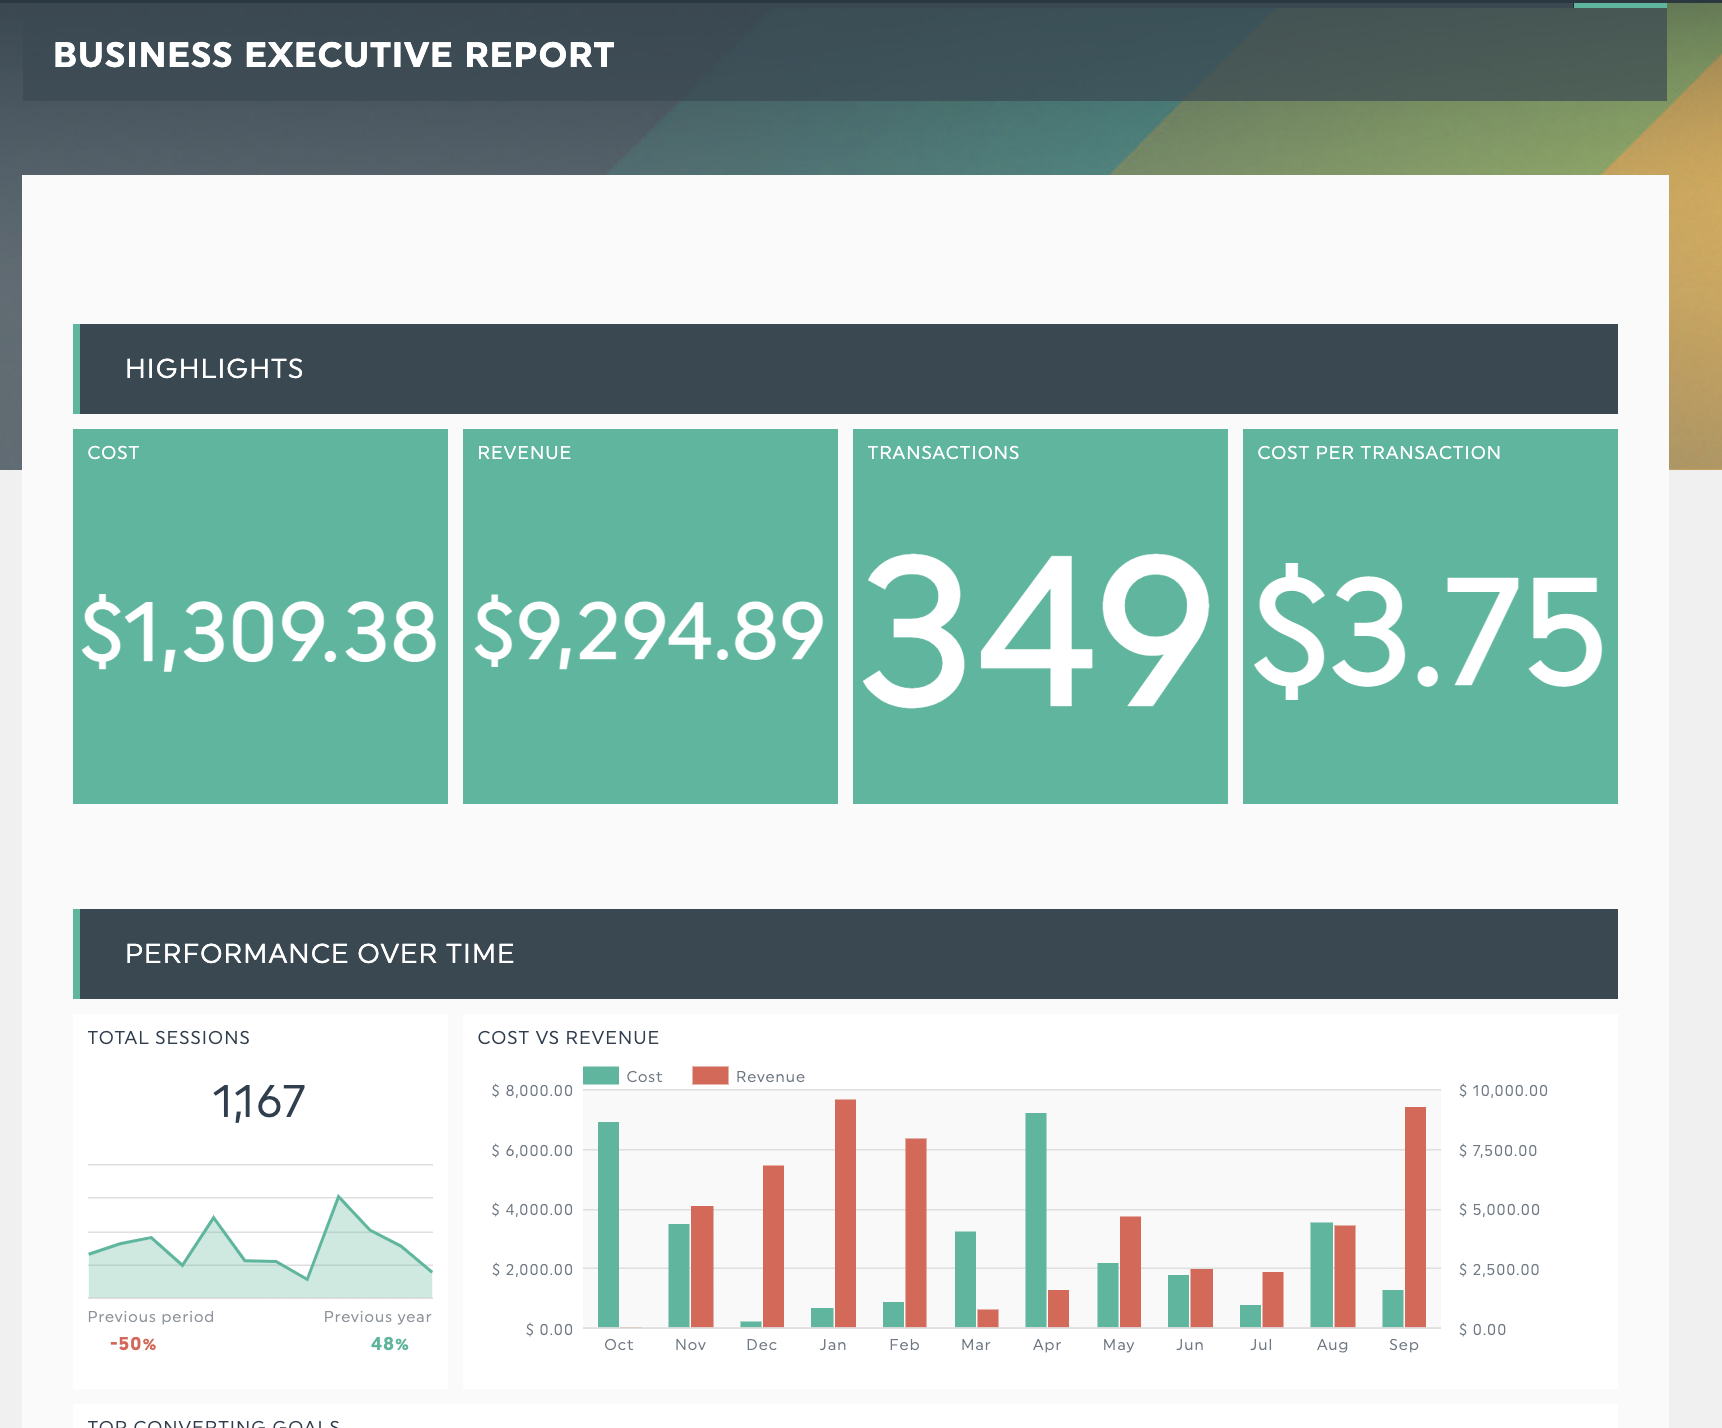
Get this executive report with your own data
Our executive report keeps to business-critical metrics like revenue and budget spent, helping senior management teams who aren’t familiar with marketing quickly understand business performance and make decisions.
This scannable report keeps highlights at the top, ensuring your executive can glance at the report while keeping details available in different sections for further analysis.
Digital marketing report template
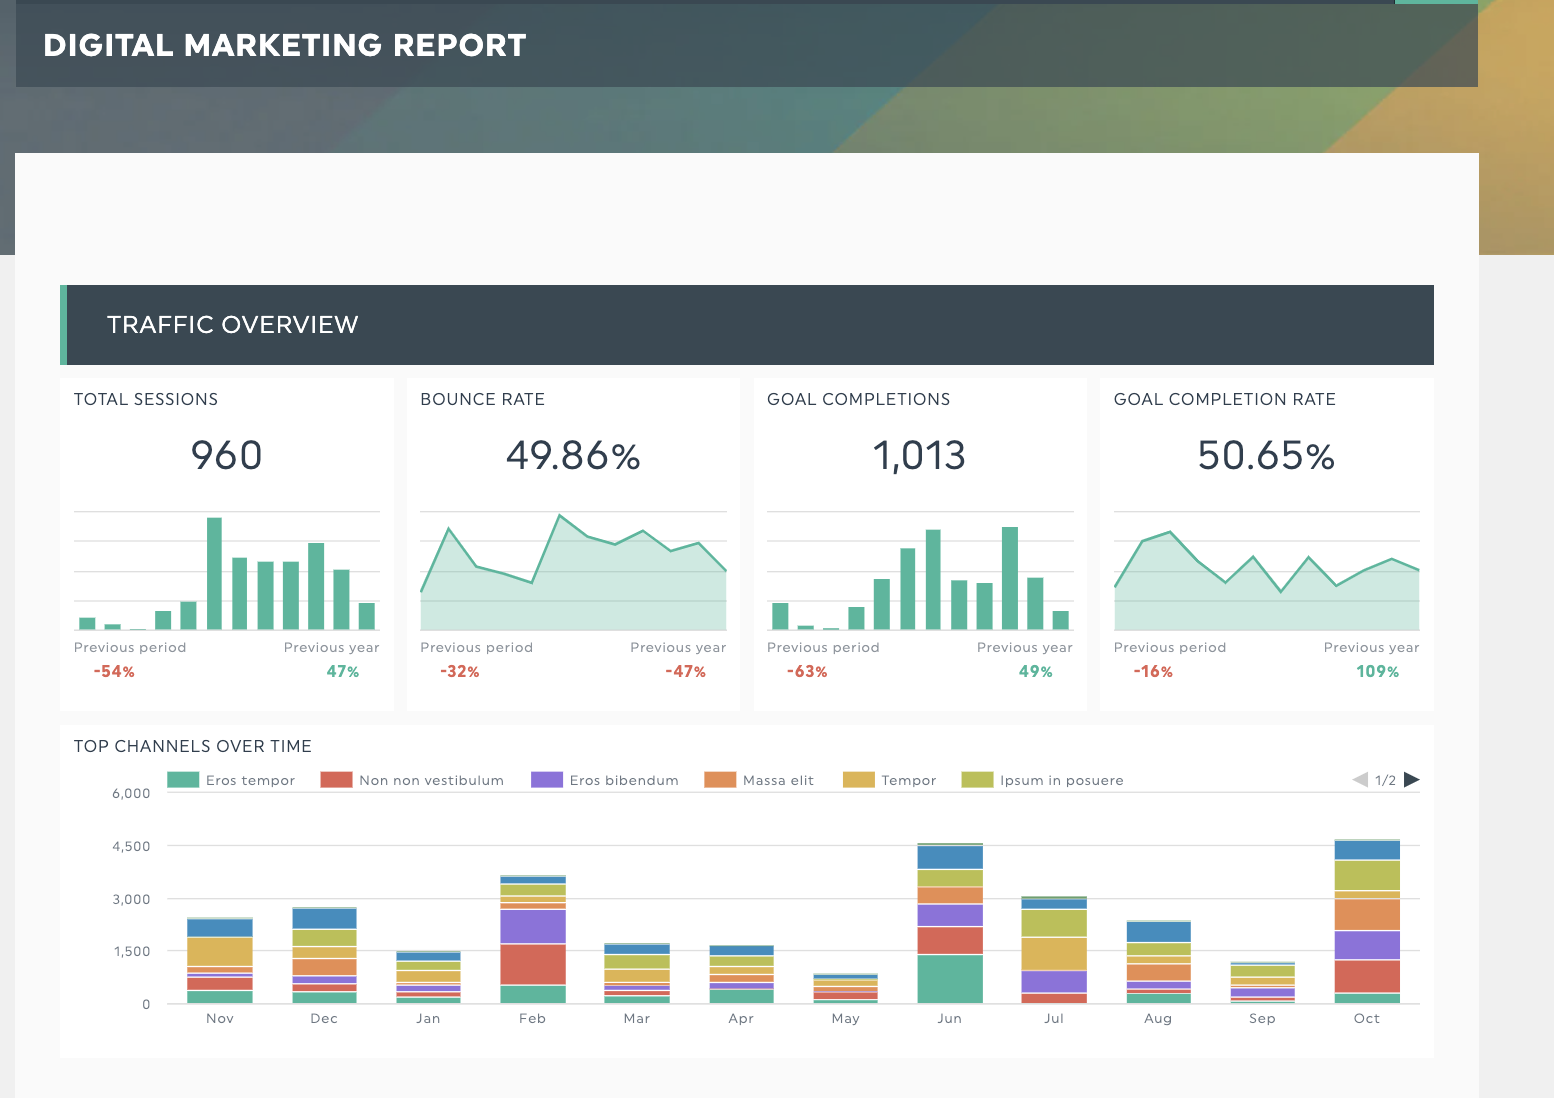
DashThis’s digital marketing report template. Get your digital marketing report with your own data
Communicating to marketing specialists or need to dive into the nuts and bolts of a marketing campaign? Get all your data points from your digital marketing and social media results organized and neatly presented in one report. Combine this template with our integrations to help you bring all your marketing data across multiple data sources in one place.
Advertising campaign report template
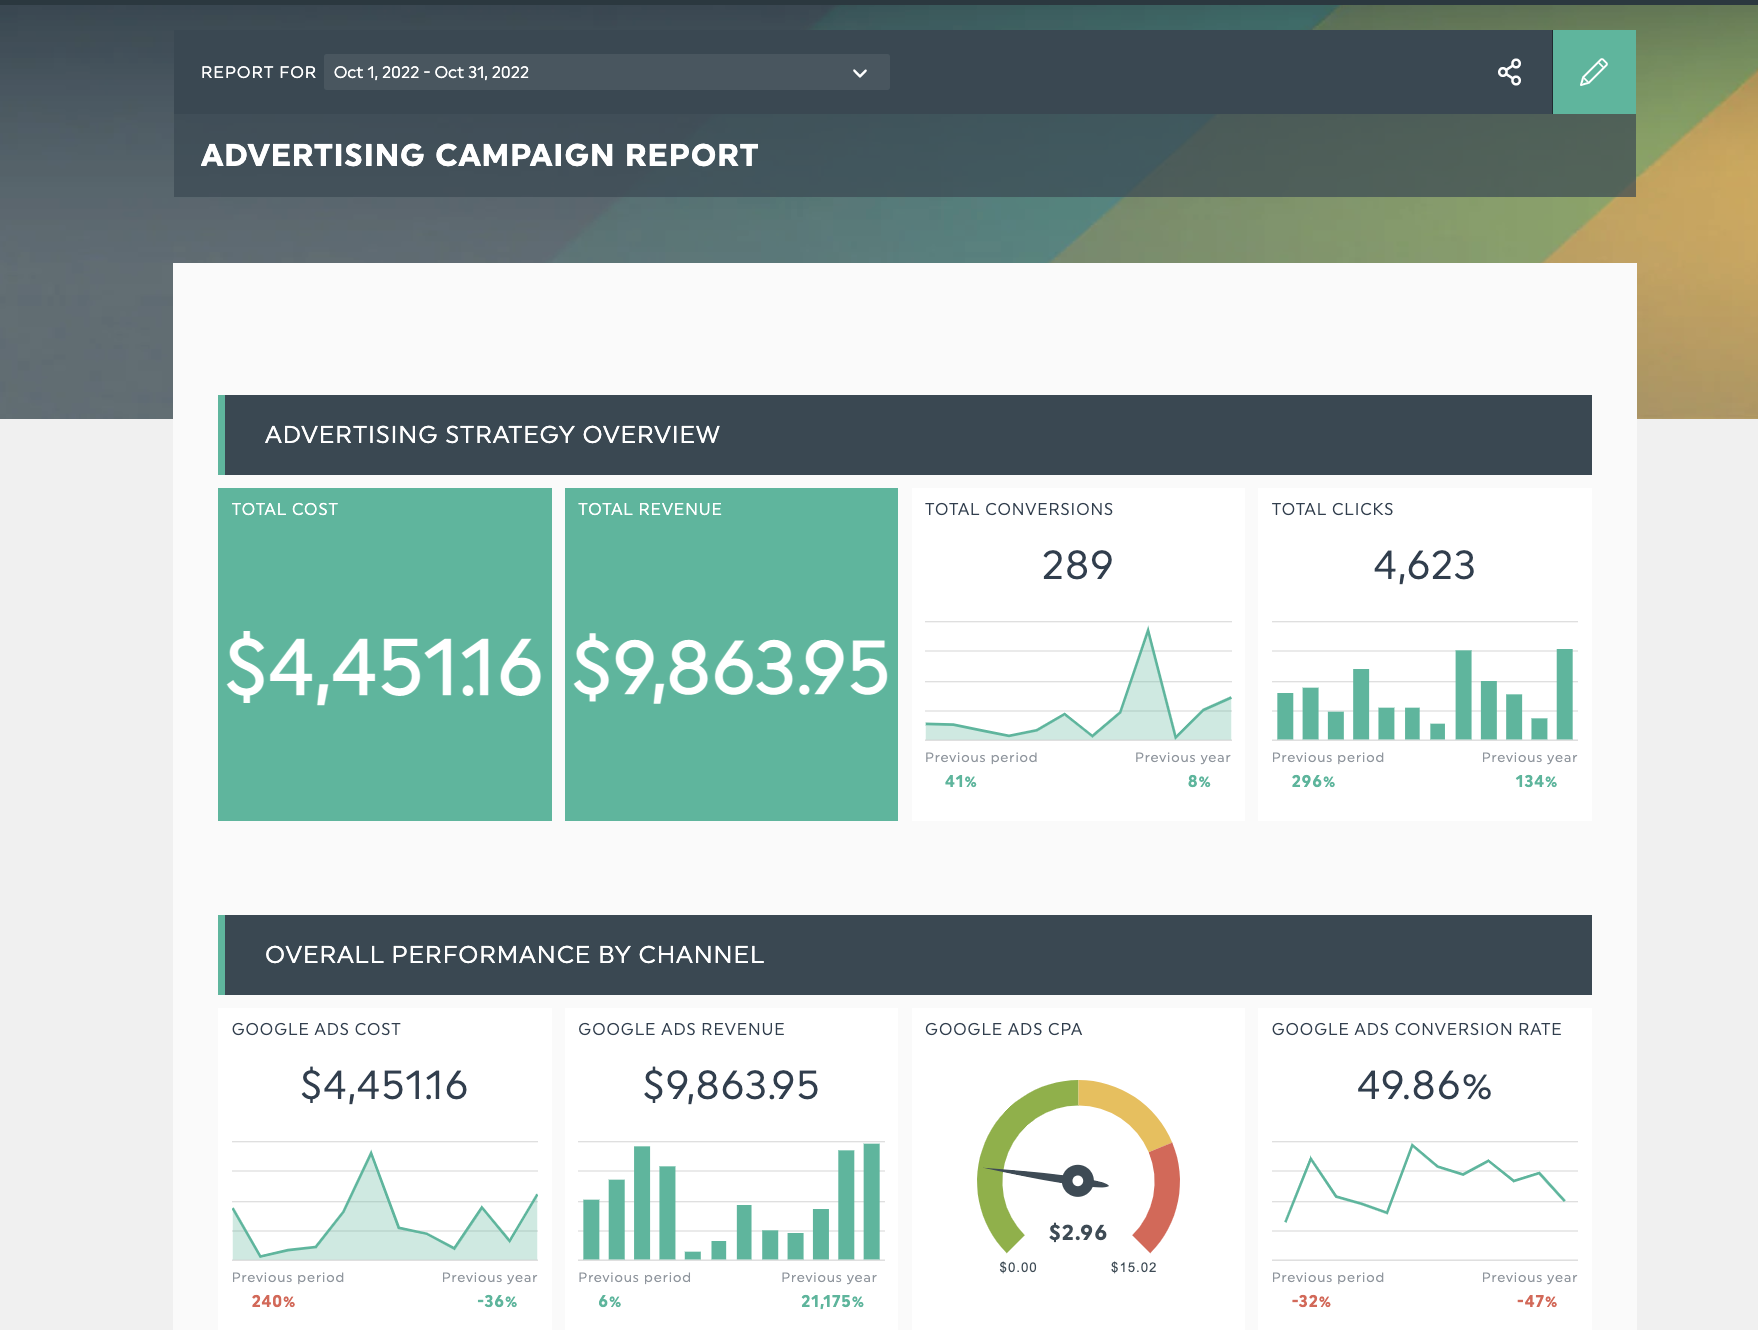
Get your advertising campaign report with your own data
Running a multi-channel advertising campaign? Take advantage of our marketing integrations to keep your clients up to date with how your campaigns are doing. It’s much easier to make decisions and get your clients sign off on to initiatives when they have something to refer to.
Go above and beyond and wow your clients with a communications dashboard
Clear communication and responsiveness go a long way in making clients feel valued.
When you invest in reporting and streamlining a daily (yet tedious) process, you invest in a win-win situation - freeing up time for both you and your clients to tackle other tasks, like developing new strategies or optimizing campaigns to deliver even better results for your clients.
If you can do that, you open up more opportunities to deliver value, grow your accounts and keep your clients - music to any agency owner’s ears.
Start by investing in effective reporting. Sign up for your free 15-day trial of DashThis today.

Ready to create a killer dashboard?
Read More

Don’t miss out!
Follow us on social media to stay tuned!
Automate your reports!
Bring all your marketing data into one automated report.
Try dashthis for free