Top 15+ Instagram KPIs & metrics to track in 2024

Nearly a quarter (2 billion) of the world's population engages with content on Instagram every month.
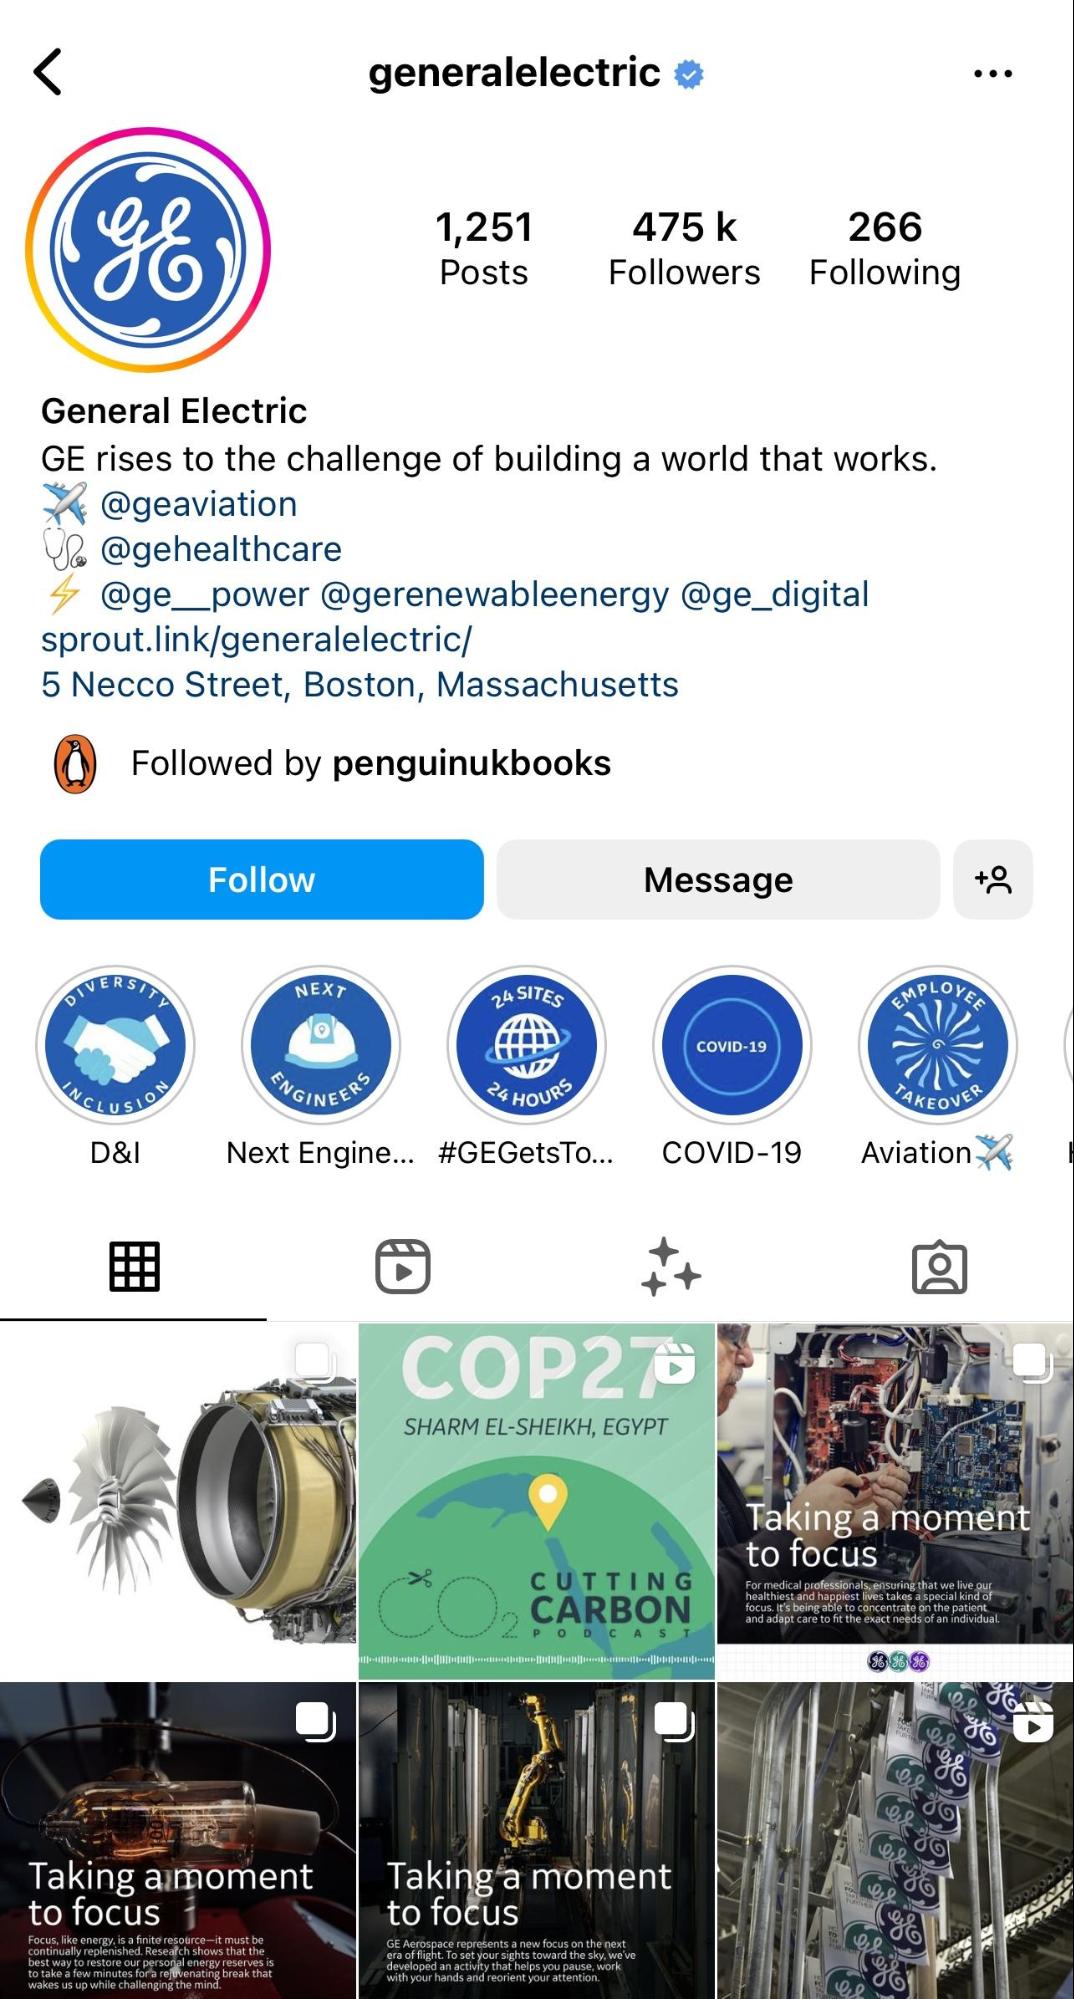
It’s no slouch for engaging B2B social media users too. 49% of B2B marketing teams said that their most used and trusted social media channel is Instagram. B2B companies like HubSpot and General Electric use Instagram as a significant part of their social media marketing strategy.
With regular Instagram reporting, you can ensure your Instagram marketing strategy takes advantage of this massive user base for your digital marketing strategy. In this step-by-step guide, learn how to define your Instagram key performance indicators (KPIs).
- What is an Instagram insights report
- How to measure your success on Instagram
- Top 15+ Instagram KPIs
- How to create an Instagram report with Dashthis
What is an Instagram insights report?
An Instagram insights report covers the following:
- Page level performance: Analyze overall trends for your page, including key metrics like the number of followers, audience growth, accounts reached, and page engagement to measure the success of your efforts
- Post performance: Amplifying a specific content piece? Discover which posts (or ads) resonated to adjust your Instagram strategy or re-plan your content strategy.
- Audience and demographic analysis: Who interacts with your Instagram content? Looking at your audience profile can help improve ad targeting or content scheduling efforts or track if your Instagram audience is reaching your target audience.
Besides providing you and your team with strategic and operational insights, Instagram insights reports are also a communication tool - demonstrating the value of your work to get approval for more resources or to build confidence with clients and stakeholders.
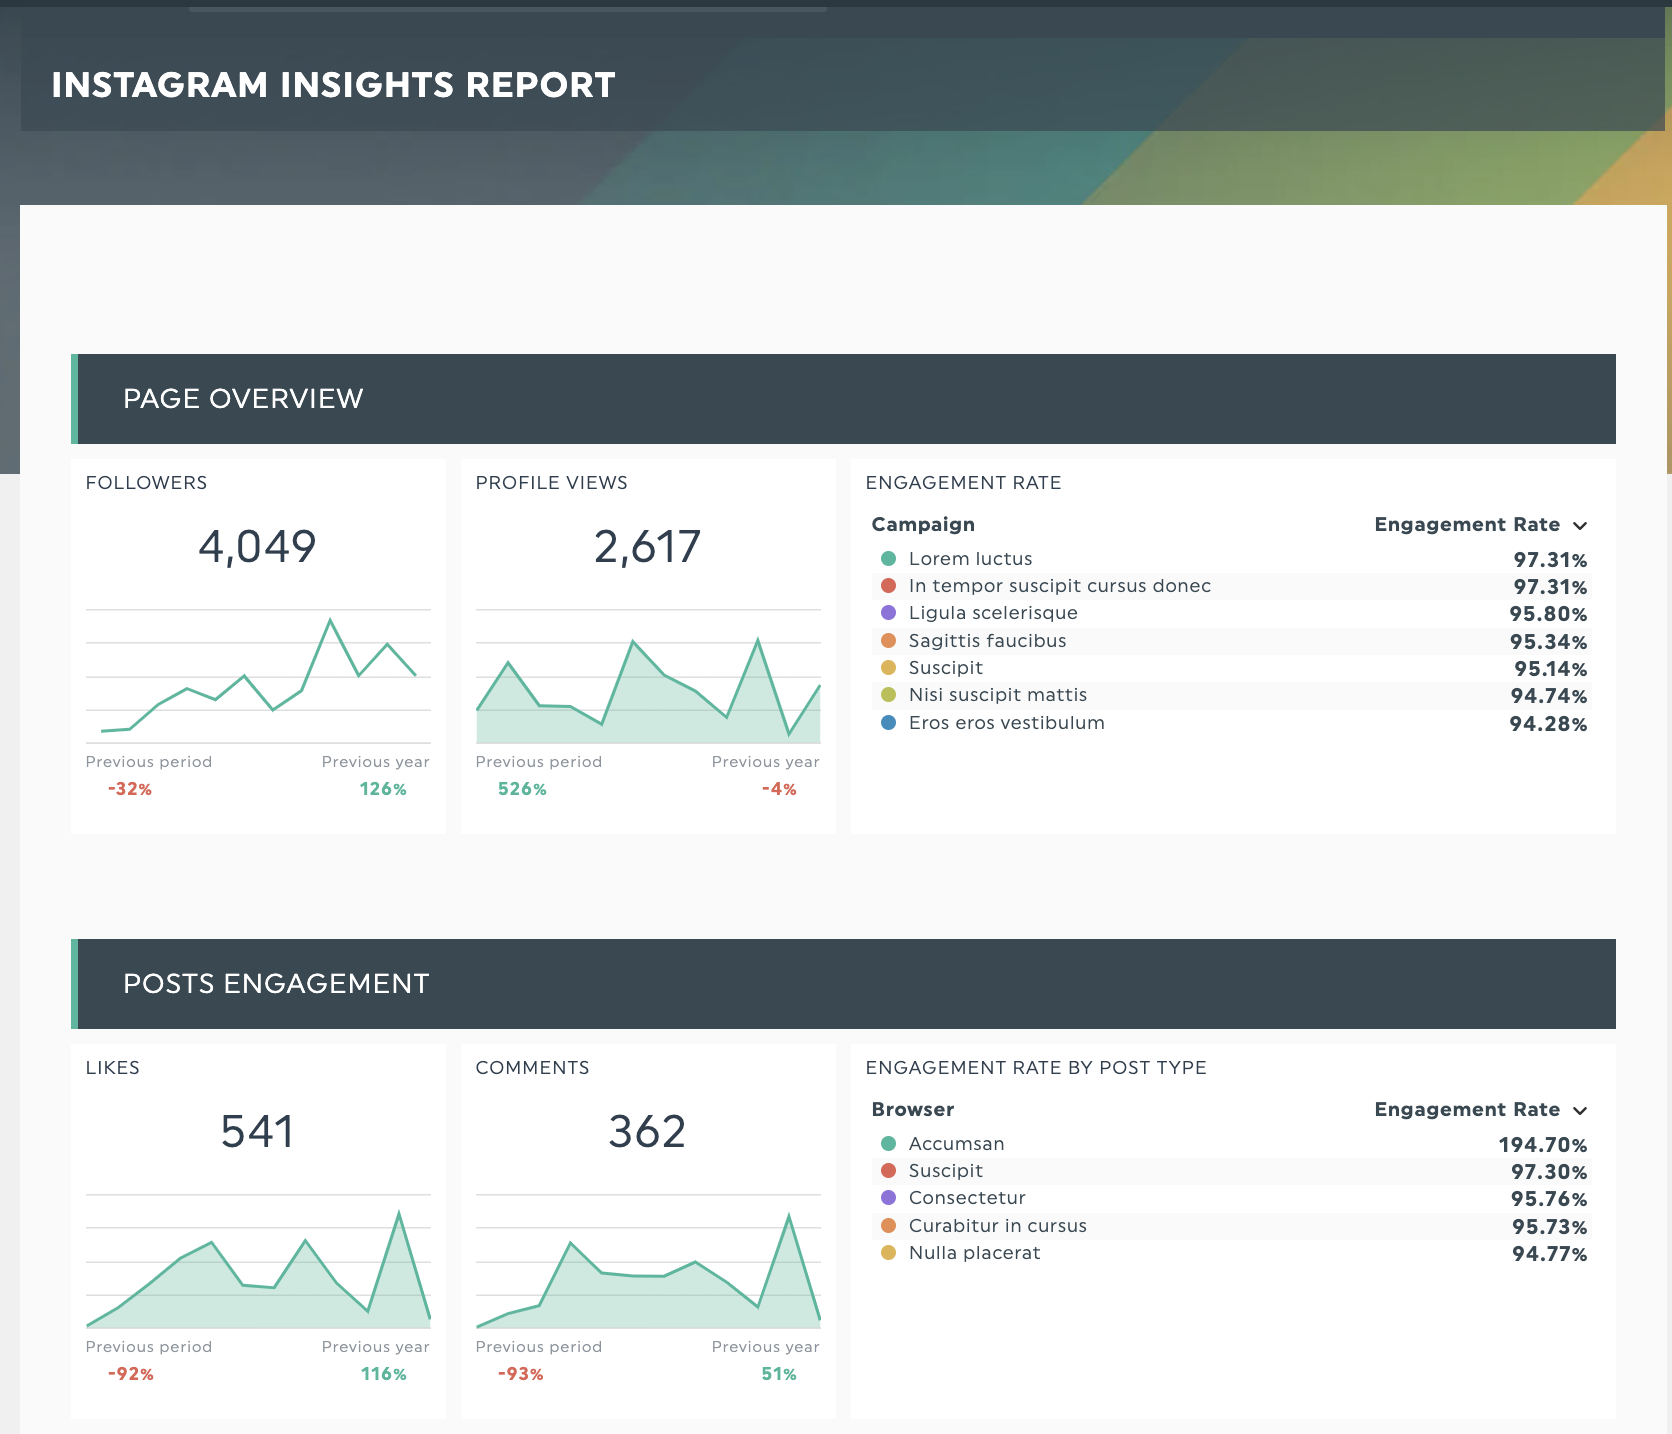
Grab our Instagram report template with your data, or see it live here.
Use Instagram's Insights page if you're starting or want to merge Instagram data with an existing report.
Creating reports for multiple clients monthly? You can use reporting tools like DashThis to bring your Instagram analytics into a well-formatted report to save time, like our social media report template here. Handy if you’re working across different social media platforms.
Grab this social media template with your own data!
Read more: How to write a social media report for your clients
How to measure your success on Instagram with the right Instagram KPIs
1: Define your goals and objectives on Instagram
Why do you want to invest time and effort in Instagram?
Is it because your competitors are on it? Or is it because you’ve a knack for visual (or video) communication and want to show Instagram users how your company works behind the scenes?
Some example goals for Instagram for B2B businesses
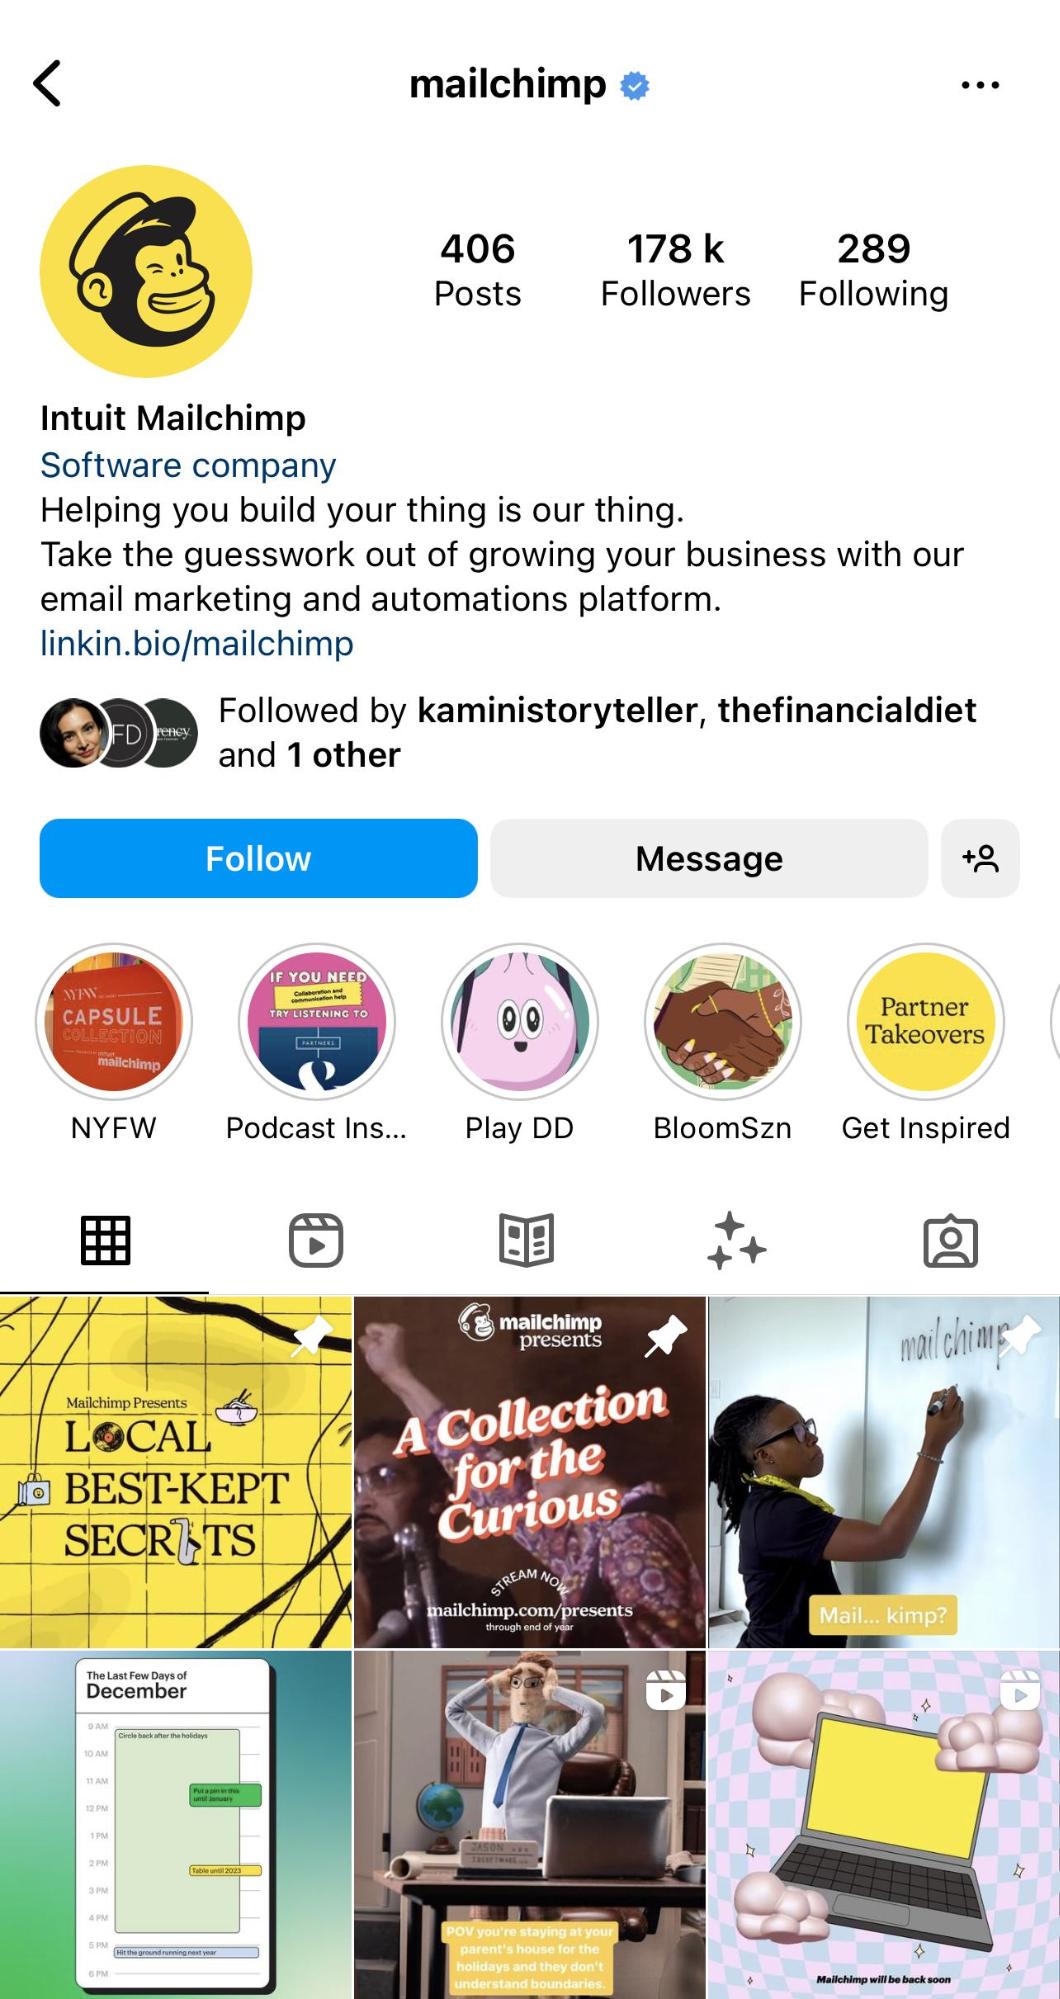
Drive engaged traffic to your company website or a specific page. Mailchimp highlights a linkin.bio page to showcase a more casual side to their business for their Instagram followers. They show their support for local non-profits during the holiday season, partnerships with creators, and link people to educational content.
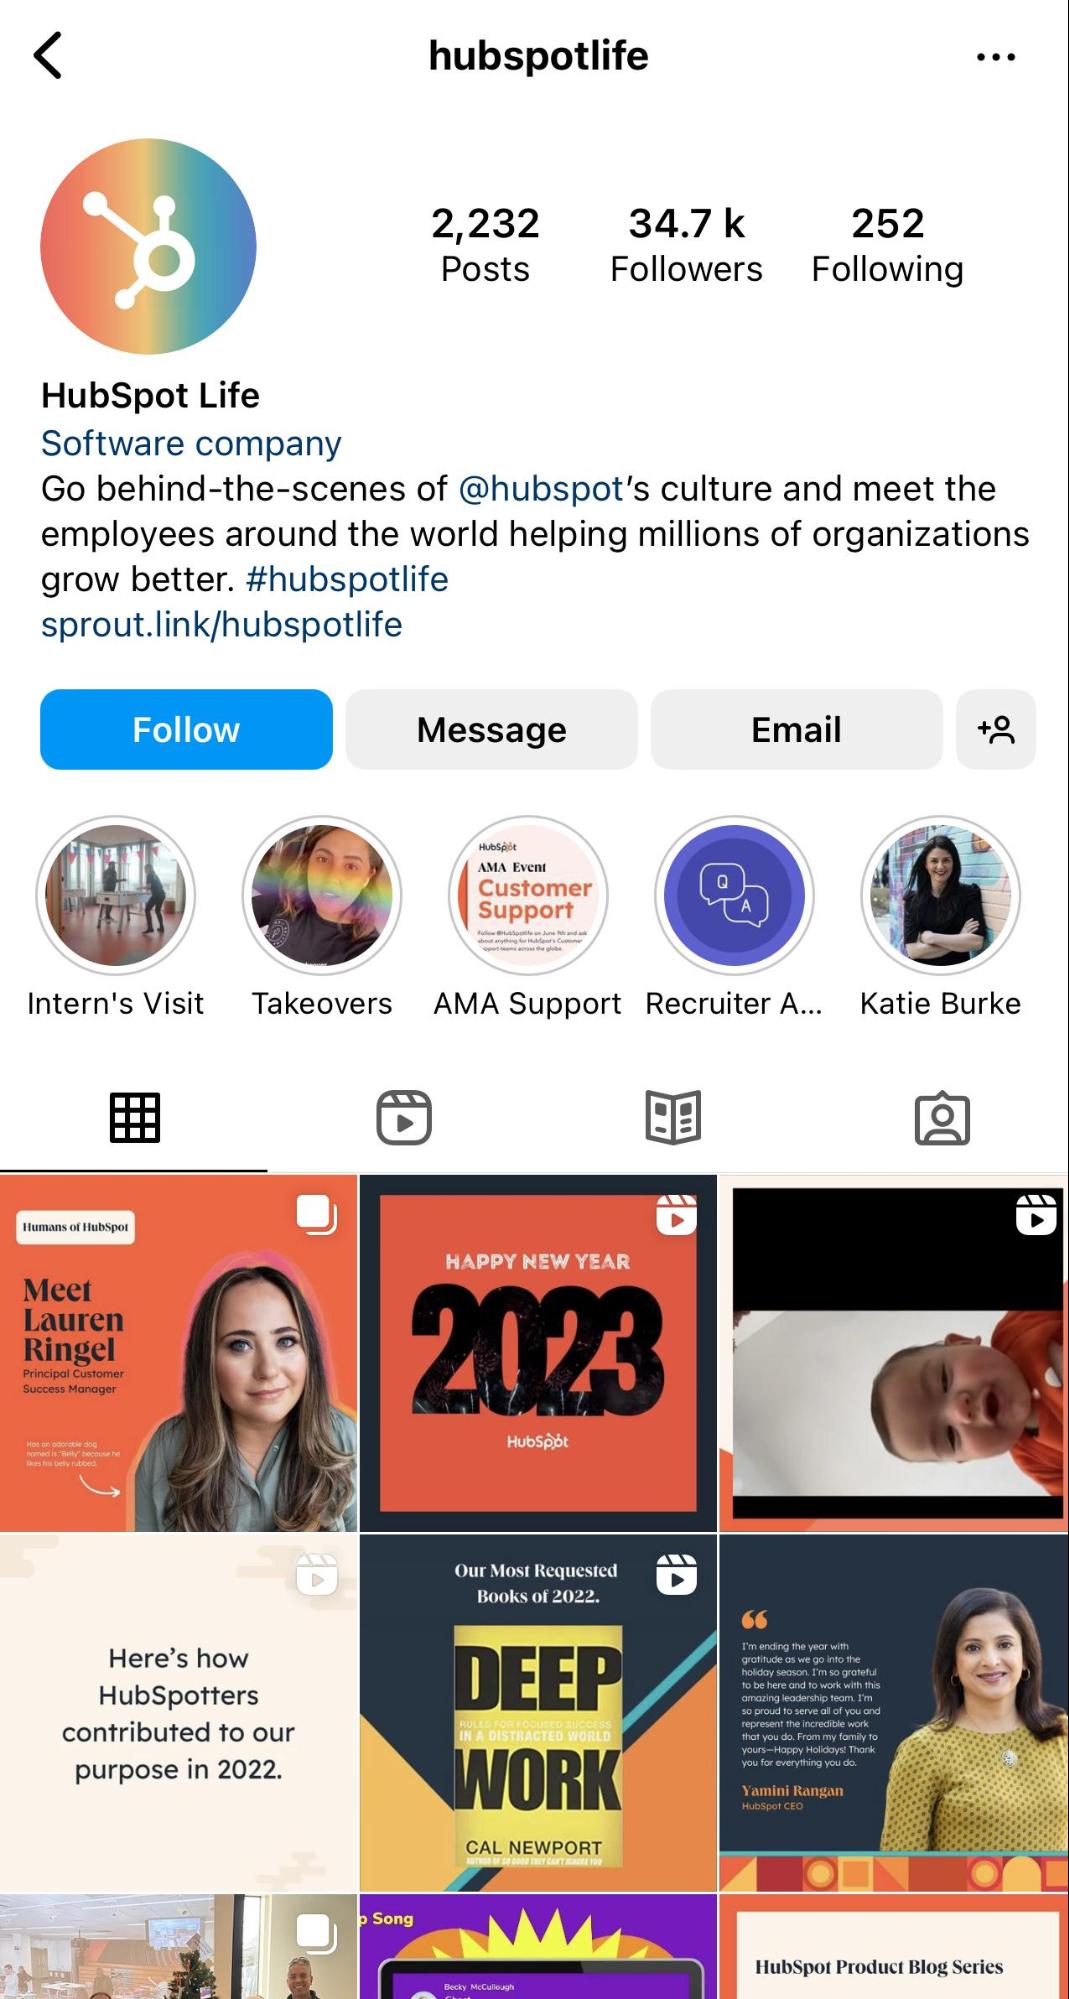
Employer branding and show off company culture. HubSpot’s culture account takes people behind the scenes to show what it’s like to work at HubSpot. You’ve got interviews with HubSpot employees, events, and Instagram account takeovers by HubSpot staff (even interns are included here).
Thought leadership and behind-the-scenes: General Electric cleverly uses Instagram to make its massive brand more relatable with behind-the-scenes content by showing how products used by people worldwide get made. They’re also one of the early adopters of crowdsourced content campaigns to connect with their audience.
2: Find the right KPIs to measure your success
Once you’ve figured out how Instagram fits in your marketing mix, the next step is to define how to measure success, which you can do using SMART goals or the Objective and Key Results (OKR) method.
Example SMART goal: Let’s say you want to revive your company’s Instagram account to focus on improving employer branding efforts. Here’s how you might write it.
Enhance our employer branding and talent acquisition efforts by improving our brand awareness by 20% month-on-month through Instagram content in Q1 and Q2 2023.
Measured KPIs:
- Clicks on our Instagram call-to-action
- Profile visits,
- Engagement rate
- Accounts reached.
Unsure where to begin with Instagram metrics? Choose from our curated list below.
Get started with these 15+ Instagram KPIs for your next insights report
Instagram page KPIs and engagement metrics
- Total followers and overall follower growth rate
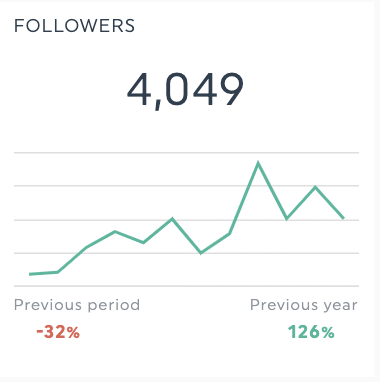
What: People who want to see your posts, stories, and Reels on their feed.
Why: Monitoring your follower metrics (mainly how much your follower count changes over time) helps you understand whether your page is growing and whether your content resonates with your audience. Note fake followers and bots to ensure your new follower counts are accurate.
- Profile visits
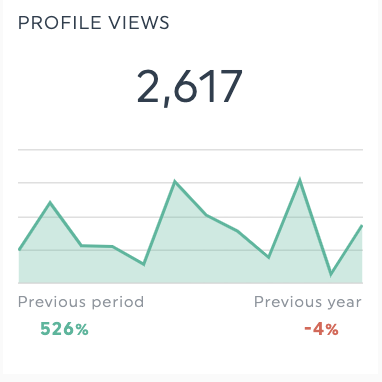
What: How many people have viewed your business profile over time.
Why: Tracks the number of people who find you on Instagram for your related keywords and overall interest in your profile page.
- Website clicks
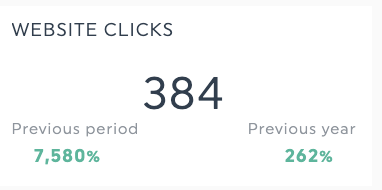
What: Tracks the number of clicks from your Instagram profile to your website or landing page.
Why: If you sell services on your website or track landing page performance, this is an important metric to monitor. Bonus: Use your analytics tool like Google Analytics, to track referral link traffic from Instagram to your website with a UTM code.
- Audience demographics
What: A breakdown of the people who consume your Instagram content, from the age range, gender, location, and their most active times.
Why: Refine your messaging and plan your posting schedule for maximum effectiveness by studying your page’s audience demographics.
Instagram posts/stories KPIs and metrics
- Post reach
What: Tracks how many unique accounts have seen your post or story and is a valuable metric for brand awareness and measuring Instagram traction. As a benchmark, the average organic reach rate for Instagram in 2022 stands at 13.51%
- Post shares
What: The number of times people shared your post with other people or to Instagram stories
Why: Post shares act as a stamp of approval that a post is engaging enough that they share it with their audience. Use this to identify engaging post topics or formats (reels and carousel posts do better in organic performance) to focus on.
- Post comments
What: How many comments has a post received
Why: Comments show discussions, emotional responses, and reactions to your content
- Post saves
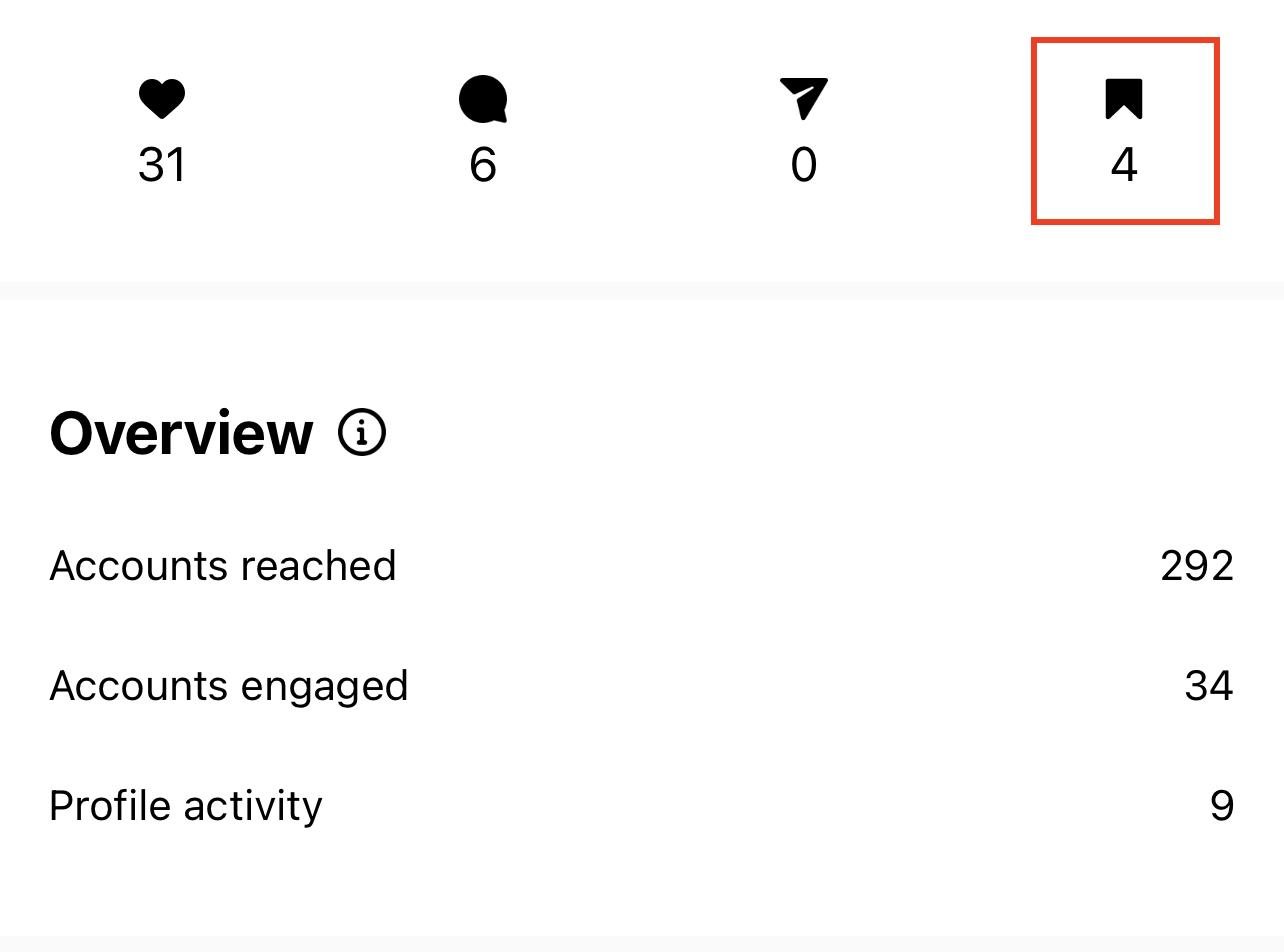
What: How many people bookmark and save your post. Saved posts appear in their collection for them to revisit anytime.
Why: Saves act as a super-like - that the person found your post worth keeping for future reference. Evergreen types of content, practical tips or personal stories get saved more often.
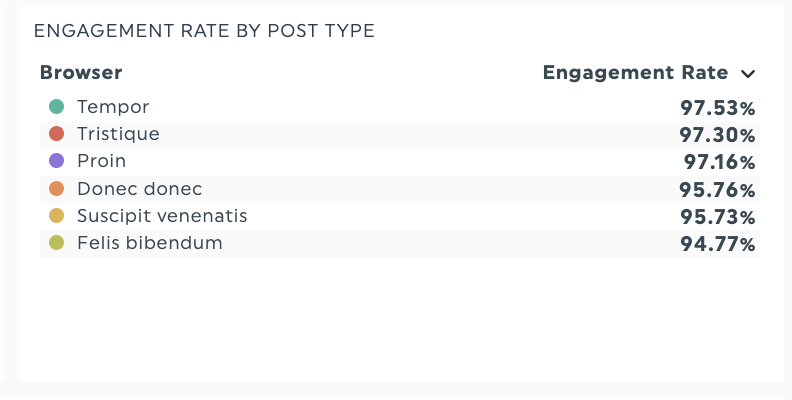
- Instagram engagement rate: Applies to Instagram Reels, Stories, and posts
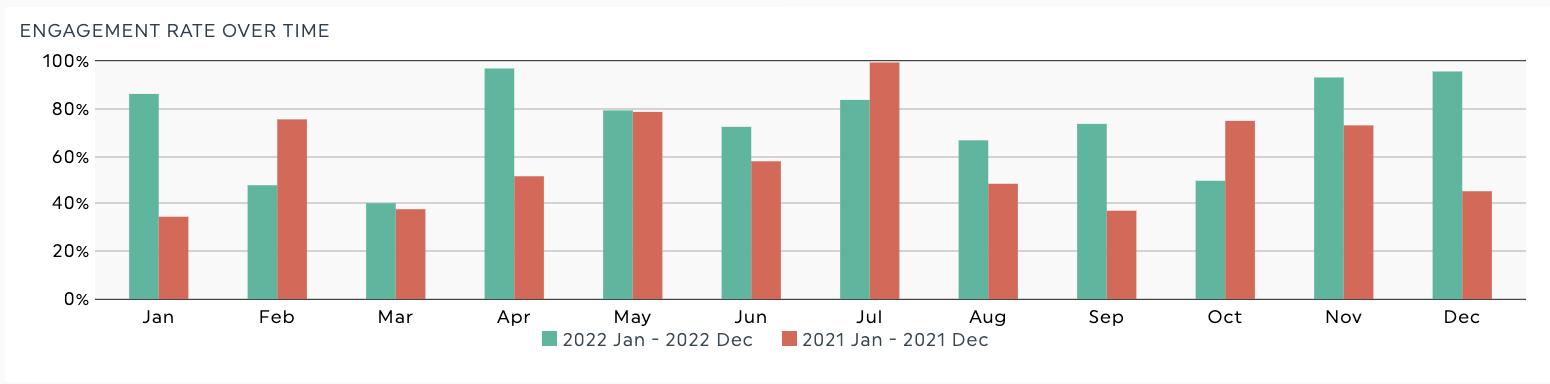
What: Shows how users interact with your Instagram profile content. Instagram calculates the average engagement rate with this formula: (Number of likes + Comments) / Impressions*100.
Why: Does your audience find your content relevant and exciting? Use this metric and other metrics in this section to answer this question.
Top posts
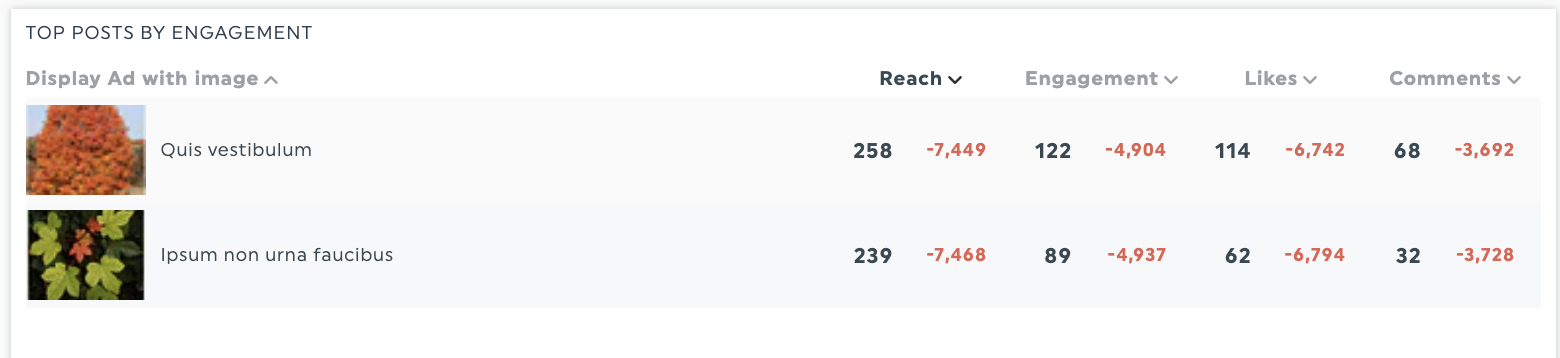
What: Shows your top-performing posts regarding engagement and reach for the month.
Why: Which content resonated the most this month? Analyze your top-performing content for lessons to inform future campaigns or posts. For example, did a top-performing post feature a specific influencer? Was its caption written in a certain way?
Instagram ad campaigns KPIs and metrics
- Ad clicks
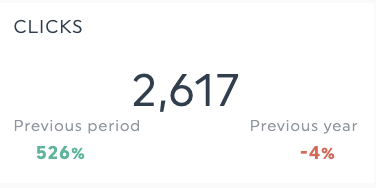
What: Clicks suggest your ad was compelling enough to get someone to take action.
Why: Comparing ads by clicks can also provide valuable insights into why audiences click. Think of clicks as opportunities to send visitors down the funnel to get them to take a desired action, like signing up for a free consultation.
- Amount spent (Cost per click or cost per conversion)
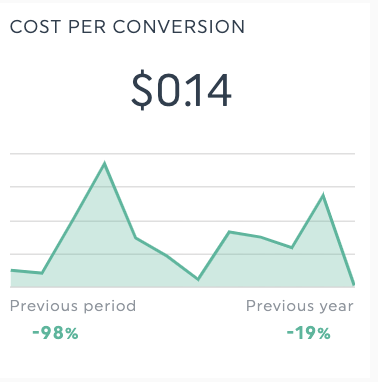
What: How much you’re spending per click or conversion
Why: Assess if your ad campaign is budget effective
Tip: Clicks or cost-per-click metrics can be vanity metrics, as they don’t tell you anything about website traffic quality. Review other metrics to see how effective your campaigns are. Segment your clicks (or conversions) by keyword or region on Google Analytics for a more detailed breakdown.
- Ad reach
What: How many unique accounts have seen your ad.
Why: Important for brand awareness campaigns. For example, compare ad reach across different times to see when your ad is more effective.
- Ad engagement rate
What: The percentage of people who have viewed your ad and engaged with your Instagram ad. (Calculation: Views/actions)
Why: Understand how well your ad is performing
- Conversions and conversion rate
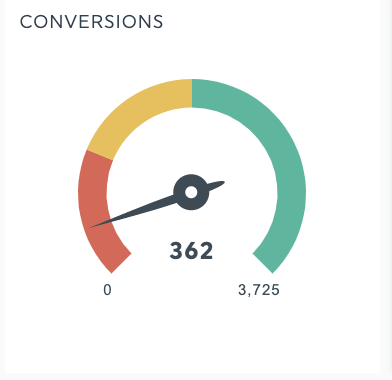
What: Tracks how many people have taken the desired action on your Instagram ad (like browsing your e-commerce sale items).
Why: Analyze conversion rates to determine how effective your IG ad campaigns are. Note that conversions isn’t always sales, it can be signing up for a newsletter, downloading your app or content offer.
How to create an Instagram report with DashThis.
You can get started in minutes. All you need to do is.
- Connect your Instagram account and import your Instagram data to DashThis. We also integrate with social media platforms like Facebook, YouTube, TikTok, and LinkedIn - allowing you to import your data with a click!
- Select the metrics to include from our Preset Widgets. Click on them to add them to your report. Then shift the metric to your desired position in the report.
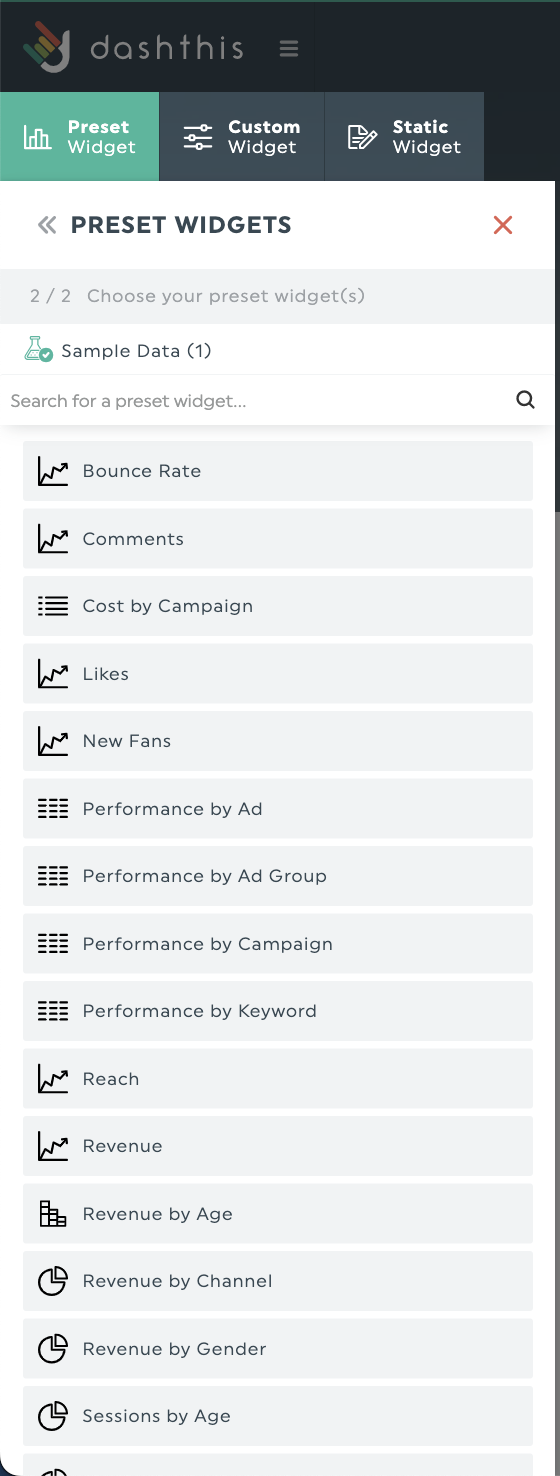
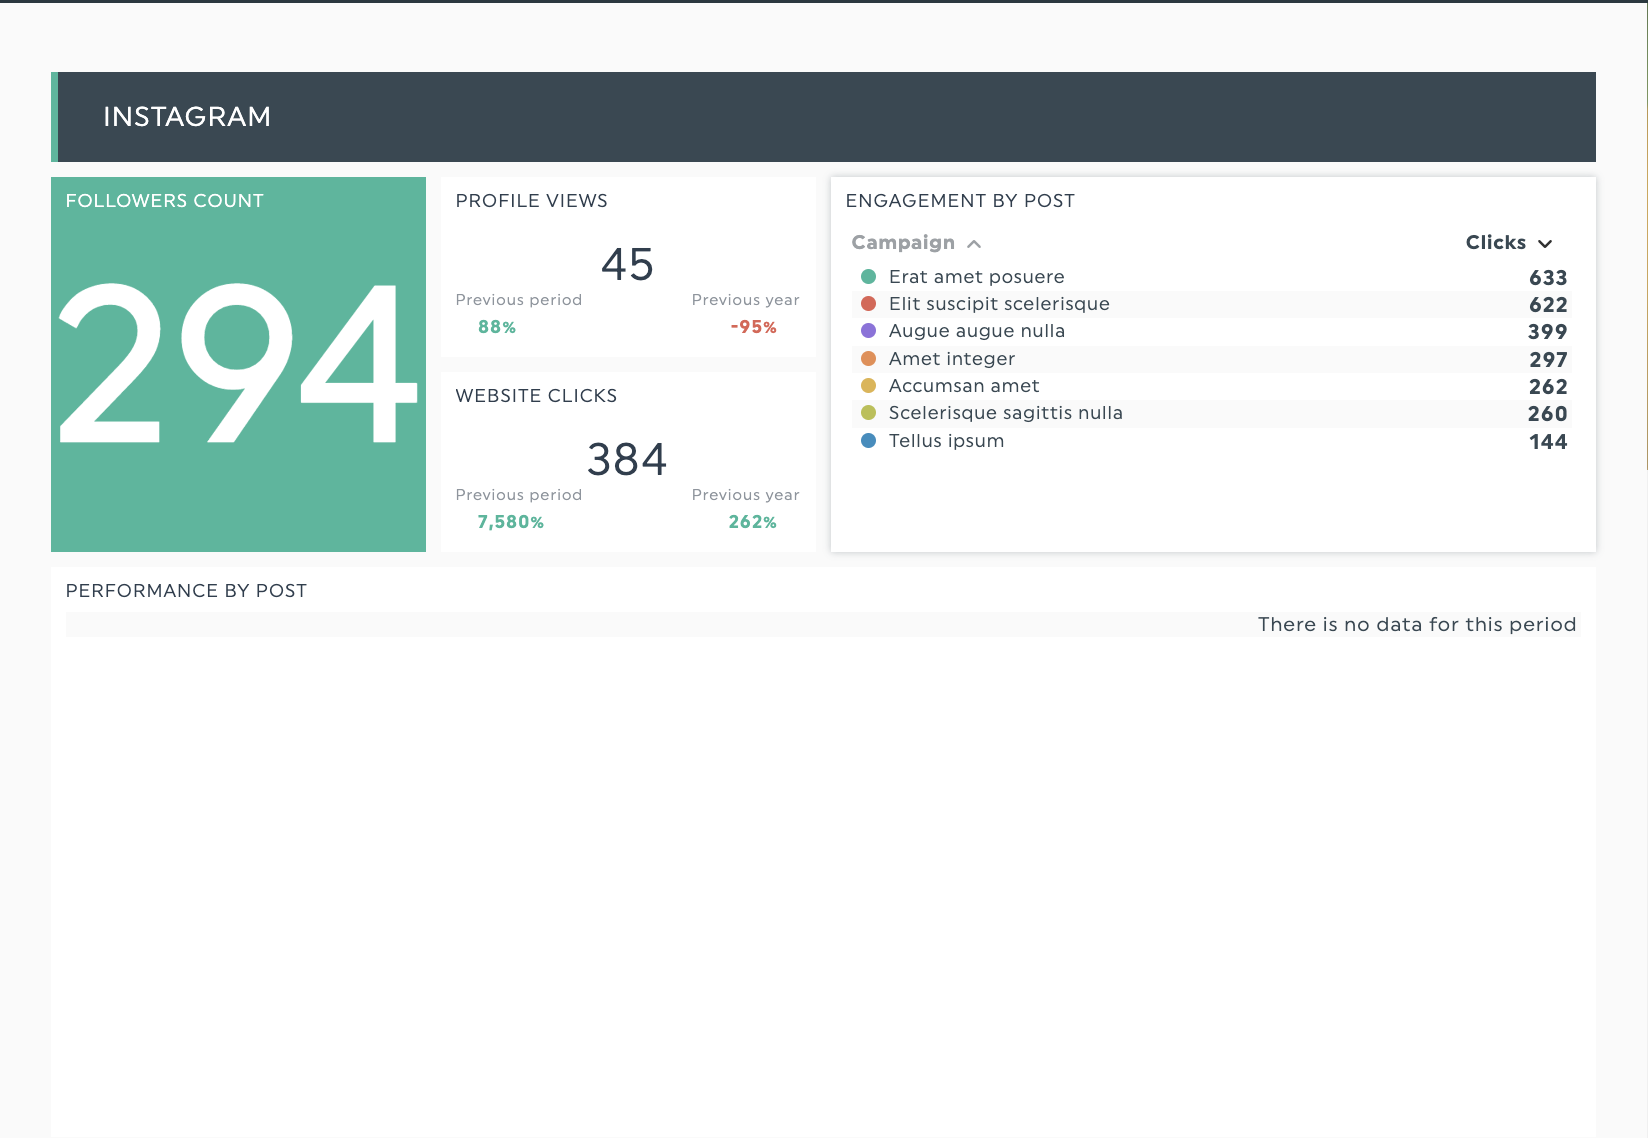
Some of the preset widgets available for you to include in your DashThis reports.
Bonus tip: Need to design your Instagram report in your branding? Check out our white-labeled report options.
Grab this Instagram report template to create a professional-looking report in minutes!
Grab our Instagram report template with your data, or see it live here.
Short on time or need help to figure your important KPIs out? Use our done-for-you Instagram report template to format less data. Analyze your Instagram posts or see their performance in context with your other marketing tools with our report.
Once you’re happy with how your report looks and what metrics are in it, why not save it as a template for future reference? That way, you have a foundation for any future Instagram report, which you can apply to future social media reports or use as a base for other clients.
Save time by automating your Instagram KPI reporting
The world of social media marketing moves blindingly fast, and you need to keep up to date with changing Instagram algorithms and everything happening in this space.
Time painstakingly assembling reports by hand is better spent thinking up new marketing campaigns, creating thoughtful content, or taking some much-needed rest.
Let DashThis handle your reporting while you focus on your marketing efforts.
Sign up for your free 15-day trial of DashThis today.

Ready to track your most essential Instagram metrics?
Read More

Don’t miss out!
Follow us on social media to stay tuned!
Automate your reports!
Bring all your marketing data into one automated report.
Try dashthis for free