The 7 Golden Rules for Creating Kickass Client Dashboards

Everything you'll learn in this article:
- Why client dashboards are essential to your business
- Why you should use a reporting tool to create your client dashboards
- How DashThis can change your reporting game
- 1- SEO Client Dashboard Template
- 2- Social Media Client Dashboard Template
- 3- PPC Client Dashboard Template
- The 7 golden rules
- 1. Less is more
- 2. Know your audience
- 3. Context is everything
- 4. Be visual
- 5. Guide your audience
- 6. Add useful functionalities
- 7. Make it evolve
Why client dashboards are essential to your business
See this dashboard template live | Use it with your own data
Here at DashThis, we love dashboards. Dashboards are actually our reason to live, so to speak, and if we’re able to make a career out of building client dashboards, it’s because we know for a fact how crucial they are to a business. They’re actually how Phil, DashThis’ big cheese, knows if JP, our marketing king, really deserves his name on the throne (spoiler alert: he totally does!). Or, if you’re working as an agency marketer, client dashboards are what indicate external clients whether they should renew their business with your company or not.
Why you should use a reporting tool to create your client dashboards
Of all dashboard rules, a client reporting tool is nothing less than the golden rule number zero for your dashboard creation.
Marketing reporting has already proven its worth, but it’s crucial to keep in mind that the process is useless if creating your client dashboard takes you so much time that there’s none left to act on the data itself.
Of course, you could import all your data into Excel, but that’s not exactly making the most of your time alive. Instead, you should use a tool that lets you centralize your reporting. This way, you’ll be able to create a client dashboard that lets you easily follow all your marketing activities in the same place. With DashThis you can gather multiple data sources and client accounts, from any platforms such as Facebook Ads, Google Analytics, AdWords, and all your search engine tools, in every client dashboard.
So not only will a reporting tool allow you to save a ton of time, it will make your dashboards much easier to understand for your clients, by gathering all your marketing data in a single place. Having automated reports is a way for you to not only streamline your reporting but even scale your business by putting more time where it truly matters; your digital marketing strategies.
How DashThis can change your reporting game
Client dashboards can serve countless reporting purposes, be it SEO reporting, PPC reporting, social media reporting, or any other. Now, if you’re a newbie in the field of SEO reporting dashboards or any other type, the team at DashThis has thought of everything! The multiple preset dashboard templates we provide are bound to really give you a nudge getting started with the type of dashboard that’s going to be the most useful to your clients’ business.
Here’s are some client dashboard example:
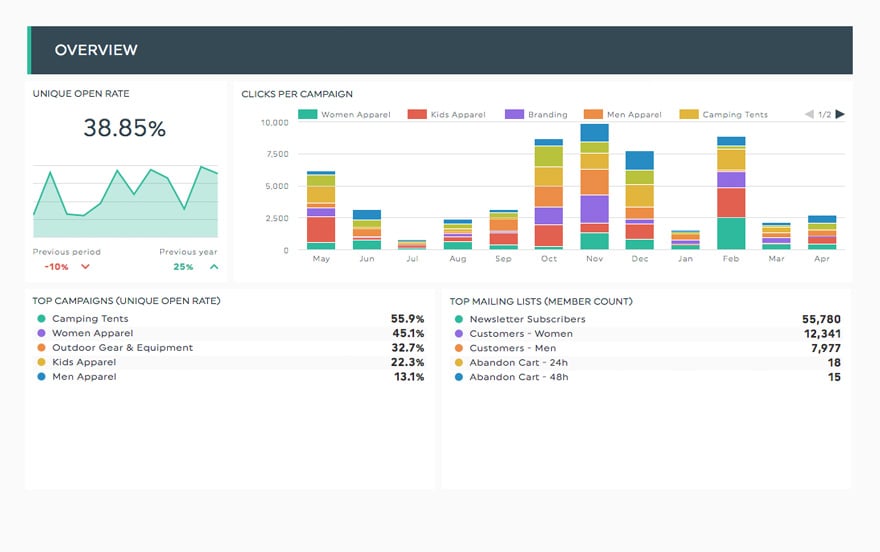
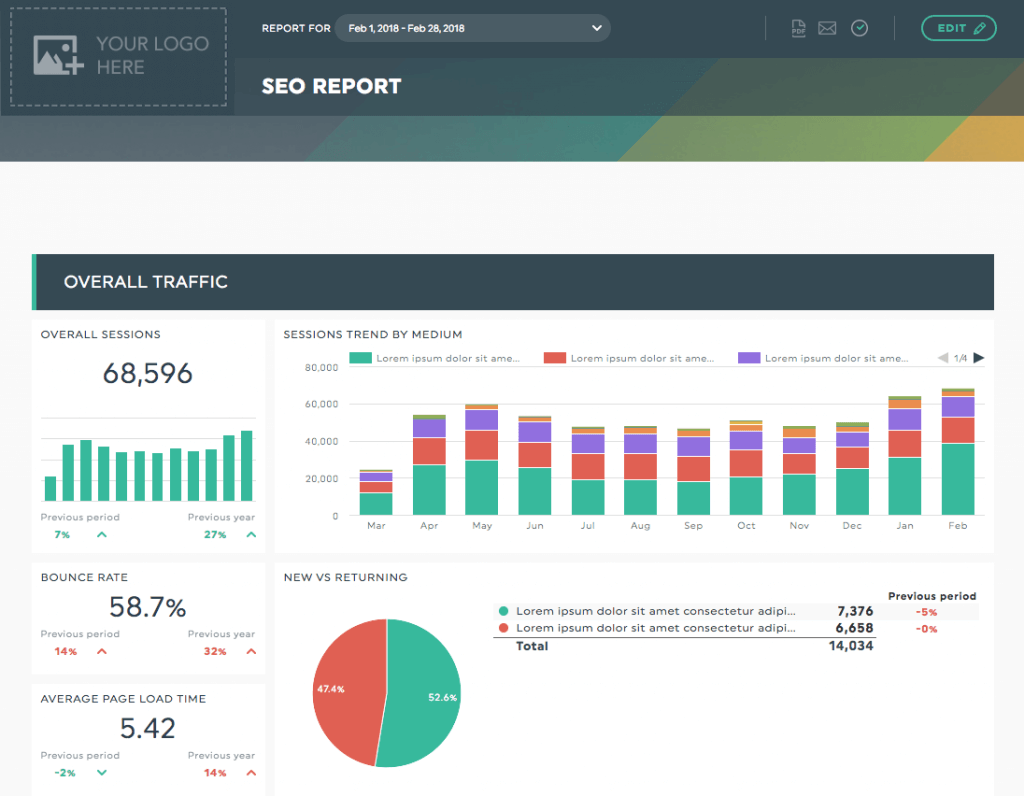
1- SEO Client Dashboard Template
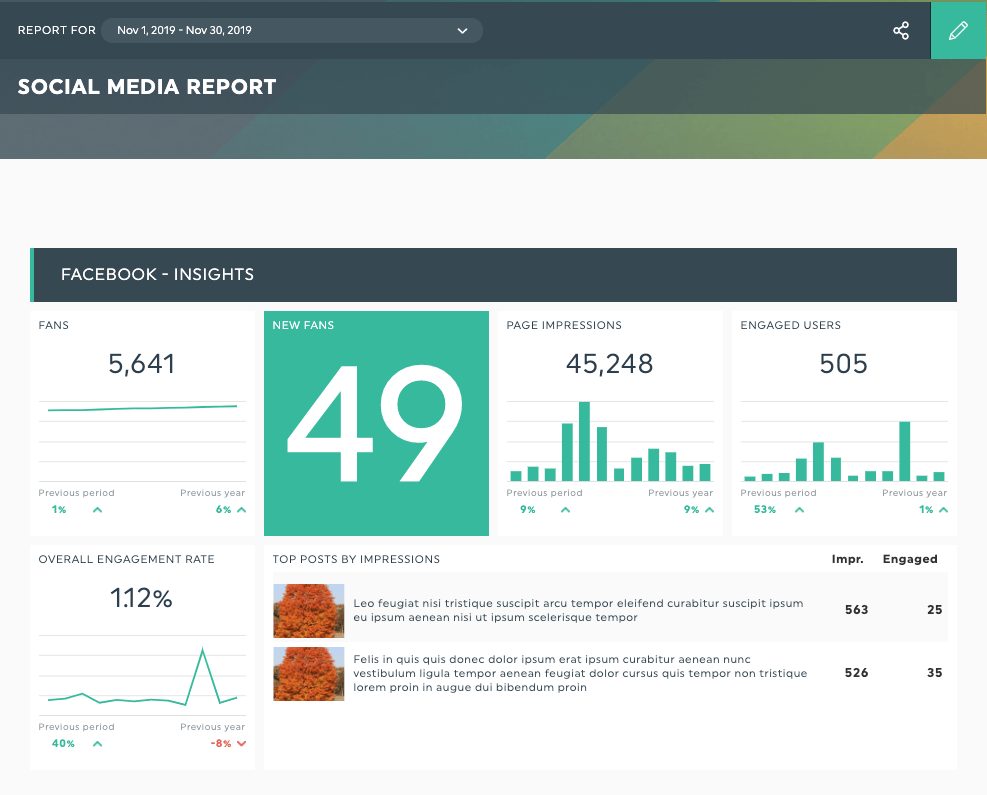
2- Social Media Client Dashboard Template
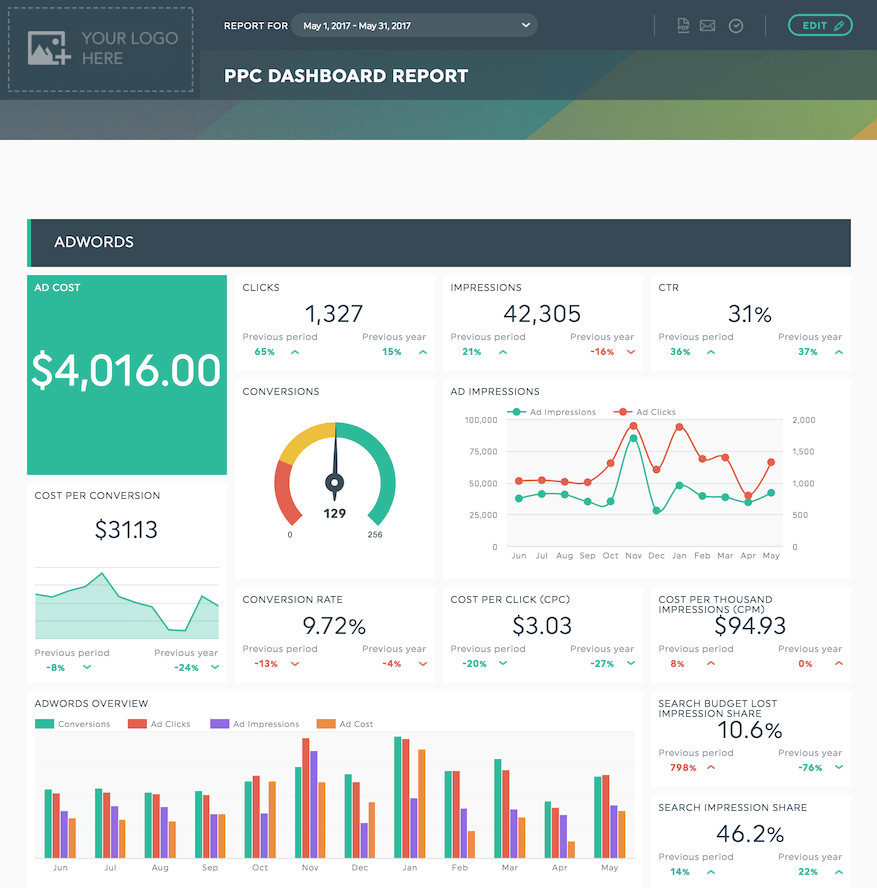
3- PPC Client Dashboard Template
By using client dashboard templates instead of starting from scratch for all your new clients, you will save hours of work! And you don't even have to start with our templates, you can build your own!
DashThis offers tons of customization features that are certain to take your reporting game to the next level.
You can even choose our white label dashboard features for a fully custom design and URL!
But whether you choose to go with a preset client dashboard template or a completely original one, there are certain dashboard design rules you shouldn’t ignore.
The 7 golden rules
Here are the 7 golden rules for creating kickass dashboards that your clients, colleagues, and boss will love (and actually USE to make better decisions).

1. Less is more
Of course, you’ve got a lot to say, and you’re probably so excited about every marketing detail that you want your client to know about absolutely everything. Unfortunately for you (but fortunately for your client), the good ol’ “less is more” isn’t just a minimalist motto and totally applies to the client dashboard context.
Knowing exactly which KPIs you need to save a spot for in your dashboard is the most important thing, since an awesome-looking client dashboard means nothing without the right metrics (or with too much of them).
In order to target the exact ones you need, ask yourself these questions:
- What is the business trying to accomplish?
- What are the business’ strategic goals?
- What are the actions that need to be taken in order to reach these goals?
- Which metrics can measure the success of these actions in terms of reaching the business’ strategic goals?
Asking these questions will inevitably lead you to your ideal KPIs; these are what you need to add to your client dashboard. A dashboard isn’t meant for heavy duty data analysis; instead, it serves people who want to see, at a glance, how things are going and what they should do about it. Yes, I know, we tend to repeat this over and over, but we won’t stop until every marketer on Earth knows it!
I’m often asked what the ideal number of metrics in a client dashboard is. Honestly, there’s no magic number. However, 10 is a pretty good place to start. Google Analytics dashboards have a 12 widget limit and that’s perfectly fine by me.

2. Know your audience
While you can’t go wrong by figuring out a business’ KPIs, knowing who will use the dashboard you create can also help you tremendously.
The level of detail you include shouldn’t be identical for every client. Managers generally want to know about the “money” part, such as Transactions and Revenue metrics, while specialists might need more precise information for their own work.
Perspectives can also differ depending on the type of audience. One metric might be of great importance for a certain business unit, and yet not at all for another one. For example, the content writing team might want more focus on SEO, while marketing specialists probably want an even mix of SEO and PPC, and your own boss would rather have more info about ROI and ROAS. You may even want to change the report’s time horizon to better suit a particular audience’s needs.
In other words, there are a lot of factors you need to consider when creating a client dashboard, but first and foremost, in order to know how to present a dashboard, you have to know who your audience is and what’s important to them.

3. Context is everything
Remember: data without context doesn’t mean anything! Never, ever give a number without giving a context. For example, is an average conversion rate of 4% good? Who knows! It may be an awesome result for one business, but totally bad for another one.
To give your audience a hand in analyzing the results shown in your client dashboard, you should always give them a sense of scale. How? By making comparisons.
For example:
- What was the conversion rate in the same period last year?
- What was it last period?
- What’s the average conversion rate for the entire site?
- Even better, compare different segments: how is the conversion rate for each traffic source?
Knowing the context is what will help you figure out the “why” of all these numbers.
But watch out! You don’t want to fall into the trap of adding too much information to your client dashboard. You don’t want it to become a mind-numbing accumulation of numbers, with never-ending questions that may or may not be relevant anyway.
While you probably know when your business is performing well and when it’s not just by looking quickly at your numbers, your readers don’t.
So if you want them to give your report more than just a quick glance, be sure they understand the scale of your numbers.

4. Be visual
They say that a picture is worth a thousand words and well, that’s pretty much the whole idea behind client dashboards. After all, dashboards are a visual way to present statistical information.
So, once you’ve chosen the right metrics for your client dashboard, you need to be sure that they will be understood quickly and easily.
How? By working with visual elements. And I’m not referring to fancy icons, 3D effects, or things you see in Hollywood blockbuster movies. The most simple graphs are always the easiest ones to understand, and if the information in the dashboard is useful, you shouldn’t need to put makeup on it to make it an entertaining read.
To make your dashboards visual, you could, for instance…
- …play with font size or make things bold to give them more weight.
- …place the most important metrics at the top of the client dashboard. Regrouping complementary or similar metrics together under distinct headers is also a good idea to make reading the report easier.
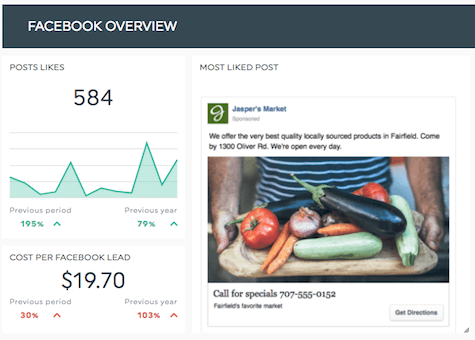
- …add images. They can truly help your clients visualize the information you want to communicate. Do you have a widget indicating the number of clicks on a certain Facebook post? Why not add an image of the post so that your client grasps what you’re talking about in an instant?
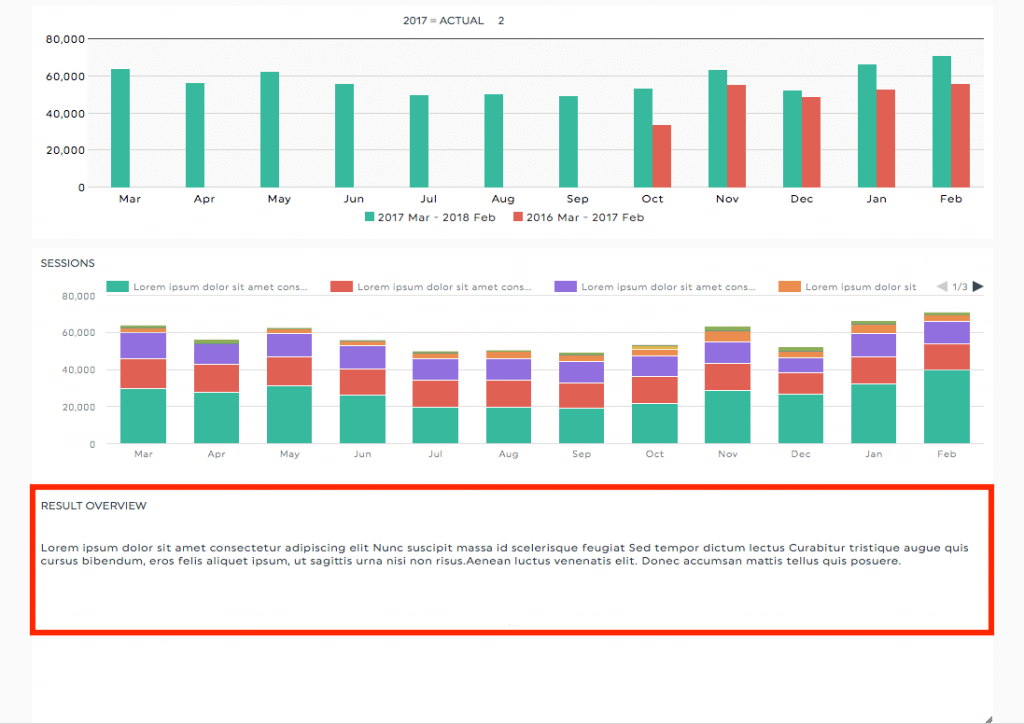
- …choose the appropriate chart type. Although this topic has a dedicated article in our Help Center, it’s important to remember that each chart type is best for demonstrating certain things. The first step in choosing the right type of graph is asking yourself what you want your data to show. Do you want to compare, show the distribution (over time, for example), analyze the composition, or illustrate the relationship between two elements?
This particular golden rule can be summarized this way: client dashboards are limited in space and information, so make good use of every pixel!

5. Guide your audience
Being visual is probably the biggest advantage of the client dashboard. It is also its biggest weakness.
As a web marketing specialist, I love dashboards. I have to admit, though, that some clients may need more guidance than others.
A client once asked me to stop sharing a dashboard with his entire company because each business unit was interpreting it in a different way according to what was favorable to their own needs.
Basically, they were seeing different things in the same charts. And believe me, my client dashboard was crystal clear. So we decided to let go of the dashboard and replace it with a written report; I was literally writing what I was seeing in the client dashboard and sending that report to the company instead.
Now, let’s be honest, it was a very, very political and hierarchical company. You probably won’t have to do this. But this example just goes to show that you need to be very discerning about how you present your client dashboards.
You can help your users go in the right direction with their thinking and analysis by adding comments and notes to the dashboard. You can also present an overview of the dashboard in the email you send your client, highlighting the main information they will be able to draw from their dashboard. This way, you eliminate any possible misinterpretations.

6. Add useful functionalities
The features your reporting tool offers are important factors that can certainly help boost your dashboard adoption rate! For example, a dashboard created with DashThis can be…
- …shared by mail (through a URL or a PDF format).
- …password protected.
- …accessed on all devices.
- …viewed through an interactive web version.
- …printed.
- …and so, so much more (can you believe that?!).

7. Make it evolve
If you follow these seven golden rules, there’s no doubt your clients will take the time to look at the dashboards you’ve put so much energy into creating. If they really use their client dashboards to their full potential, they will make wiser decisions which will undoubtedly lead to a business evolution.
A business’ focus is bound to change over time, so needless to say your client dashboards should reflect these changes and evolve accordingly.
SPOILER ALERT: applying these rules in DashThis is the easiest thing
As you have now realized, we didn’t speak much about technical elements; I could have mentioned which type of graphs or metrics have best served me. However, the issue with that idea is that the technical elements ARE secondary.
At this point, you’re already ahead of your competitors, since they’re all wasting their time searching for cool tools with NASA-type features (or ruing the day they got introduced to Excel).
If you follow each of these golden rules, the foundation of your client dashboards will be solid as hell and the technical stuff will be a piece of cake, thanks to DashThis. Not only does our tool allow you to fully automate your whole reporting process, we also offer the customer service of your wildest dreams. And we’re not even the only ones saying it!
So what are you waiting for? Why don’t you give DashThis a try?

Create your own kickass client dashboard today!
Read More

Don’t miss out!
Follow us on social media to stay tuned!
Automate your reports!
Bring all your marketing data into one automated report.
Try dashthis for free