Facebook Ads analytics explained: How to create reports your clients love

Two factors contribute to excellent Facebook ads analytics reports:
- Choosing metrics aligned with client objectives
- Presenting actionable data in the right format and structure
But when they're hundreds of Facebook ad terms and limited data export and viewing options in Facebook Ads Manager, you might need help explaining and visualizing your Facebook ad account data or insights for client presentations.
Here’s where and how reporting tools like DashThis help your clients make data-driven decisions and save you time on reporting.
What is Facebook Ads analytics?
Facebook Ads analytics shows how your Facebook ad campaigns perform within Meta’s ad manager, either as a campaign or individual ad.
There are a lot of metrics and dimensions by which you can analyze your Facebook ads to see which campaigns are performing and identify any growth opportunities. Meta also offers several preset column settings to analyze various aspects of your campaign, from performance metrics, bid strategy, ad engagement rate, and more.

Some of the preset column setups available in Facebook ad analytics
Why understand and track your Facebook ads analytics?
Blast from the past: our marketing director’s Jean-Philippe Cantin’s (JP) candid lessons learned from running Facebook ads for DashThis:
Facebook Ads is a beast of an advertising machine, with tons of different ad targeting options, campaign objectives and toggles to fiddle with.
As JP said, it all starts with knowing what you want to get out of Facebook Ads, then taking the time to set the right KPIs and campaign options. That way, it’s easier to identify opportunities for improvement and justify optimization efforts to your client.
But which are important metrics, and which aren’t?
Read on for our recommendations.
How to choose the right metrics for your Facebook ads reports
We’ve classified the top Facebook ads metrics according to the default columns in your Facebook ad account. These correspond to typical campaign goals - driving conversions and sales, brand awareness, and engagement.
Some of these 7 top metrics give valuable insights on their own. Other metrics like impressions, click-through rates, and frequency should be analyzed in context with other metrics.
Performance metrics:
Questions answered: Are your campaigns driving cost-effective results for your business/client objectives?
Sample metrics: Conversions, total amount of purchases, impressions, e-commerce website checkouts initiated (from people seeing your ad), cost per conversion
Example business/campaign goal: Drive lead generation by sharing a downloadable brochure or video presentation with prospects who attended a webinar
-
Facebook ad conversion rate
Conversion rates answer the question: are people taking action on my ads?
Formula: Conversions from Facebook ad / Total number of link clicks
Conversion rate benchmarks average out to 9.11% but vary across industries. Look up Wordstream’s Facebook Ad benchmarks for an estimate.
-
Return on ad spend (ROAS)
A measure of pay-per-click (PPC) campaign profitability, Facebook ROAS answers how much revenue you earned for every dollar spent on ads.
Formula: Total revenue generated from your Facebook ads (your return) / total ad spend.
Aim for a 3:1 ROAS ratio, i.e earn $3 in revenue for every dollar in ad spend. Other metrics that give ROAS more context for analysis: are churn rate, organic sales and clickthrough rate.
-
Cost per action (CPA)
Cost per action(not the same as cost per acquisition) refers to the money spent for a specific action like a customer checkout or a form submission.
It’s also a useful bid strategy in your Facebook ad campaign if you want to control how much you pay for a specific action.
Delivery metrics:
Questions answered: How many people have seen your ad, and how much did it cost?
Sample metrics: Impressions, reach, frequency, CPM (cost per 1000 impressions)
Example business/campaign goal: Make sure our updated product introductory video gets seen by a wider audience vertical for a follow-up retargeting campaign to move them down the marketing funnel
-
Impressions
Ad impressions track how many times your ad is shown to people.
Useful to track the effectiveness of brand awareness campaigns or to check whether your marketing efforts are working properly. Review your ad settings if you’ve got many impressions but little-to-no clicks or an exceptionally high cost per click (CPC).
-
Frequency
Frequency measures the number of times a person has been shown your ads. There’s no magic number for the ideal ad frequency - it depends on
- How established your brand is in the market
- Message complexity
- Various media factors
In essence, more established brand advertisers will need to show their ads less frequently compared to a brand who’s new in the market, or has a more complex message.
Read: Meta’s analysis on the ‘right’ ad frequency for your brand.
-
CPM (cost per 1000 impressions)
Crucial for brand awareness campaigns, CPM tracks how much you’re paying for impressions. Over time, you can use CPM and total impressions to see which campaigns are being viewed the most and deduce what’s working better for your audience.
However, impressions alone do not lead to engagement or revenue, so contextualize CPM with your CPC, CTR, and ROI metrics to get a full picture of your campaign performance.
Engagement metrics:
Question answered: How many people have interacted with your ad?
Sample metrics: Clicks, clickthrough rate, engagement metrics (likes, comments, shares)
Example business goal: Encourage our Facebook page’s audience to engage with a poll or giveaway and build social proof
-
Click-through-rate (CTR)
Clickthrough rate assesses if your ad applies to your target audience, or whether your ad campaign is optimized properly.
Formula: (number of clicks/number of impressions)100
How to create a Facebook Ads report your clients love with DashThis
Besides choosing the right metrics, there’s an essential second half to reporting success - presenting your data in a way that’s easy for your clients to understand and take action on.
Follow these 3 principles to create valuable reports for your clients.
1. Combine Facebook ads data with other campaign metrics for your clients
Facebook has a powerful analytics tool where you’ve got all your Facebook ads performance data in one place.
But today’s customers aren’t only active on one channel. Studies show shoppers interact with brands on 20 different channels, whereas B2B customers regularly use ten or more channels to interact with and evaluate potential partners and suppliers (i.e, agencies like yourself!)
To ensure your client remains top of mind for today’s customer profile, you might need more than Facebook ads in your digital marketing strategy. You'll also need to adapt your reporting to measure performance across multiple platforms.
Here’s where reporting tools like DashThis come in to make your reporting life easier.
With 34+ integrations across major PPC and social media marketing platforms like LinkedIn Ads or TikTok Ads, and web analytics tools like Google Analytics, you can get a bird's-eye view of all your digital marketing data in one place without cycling through 100 browser tabs or separate reports.
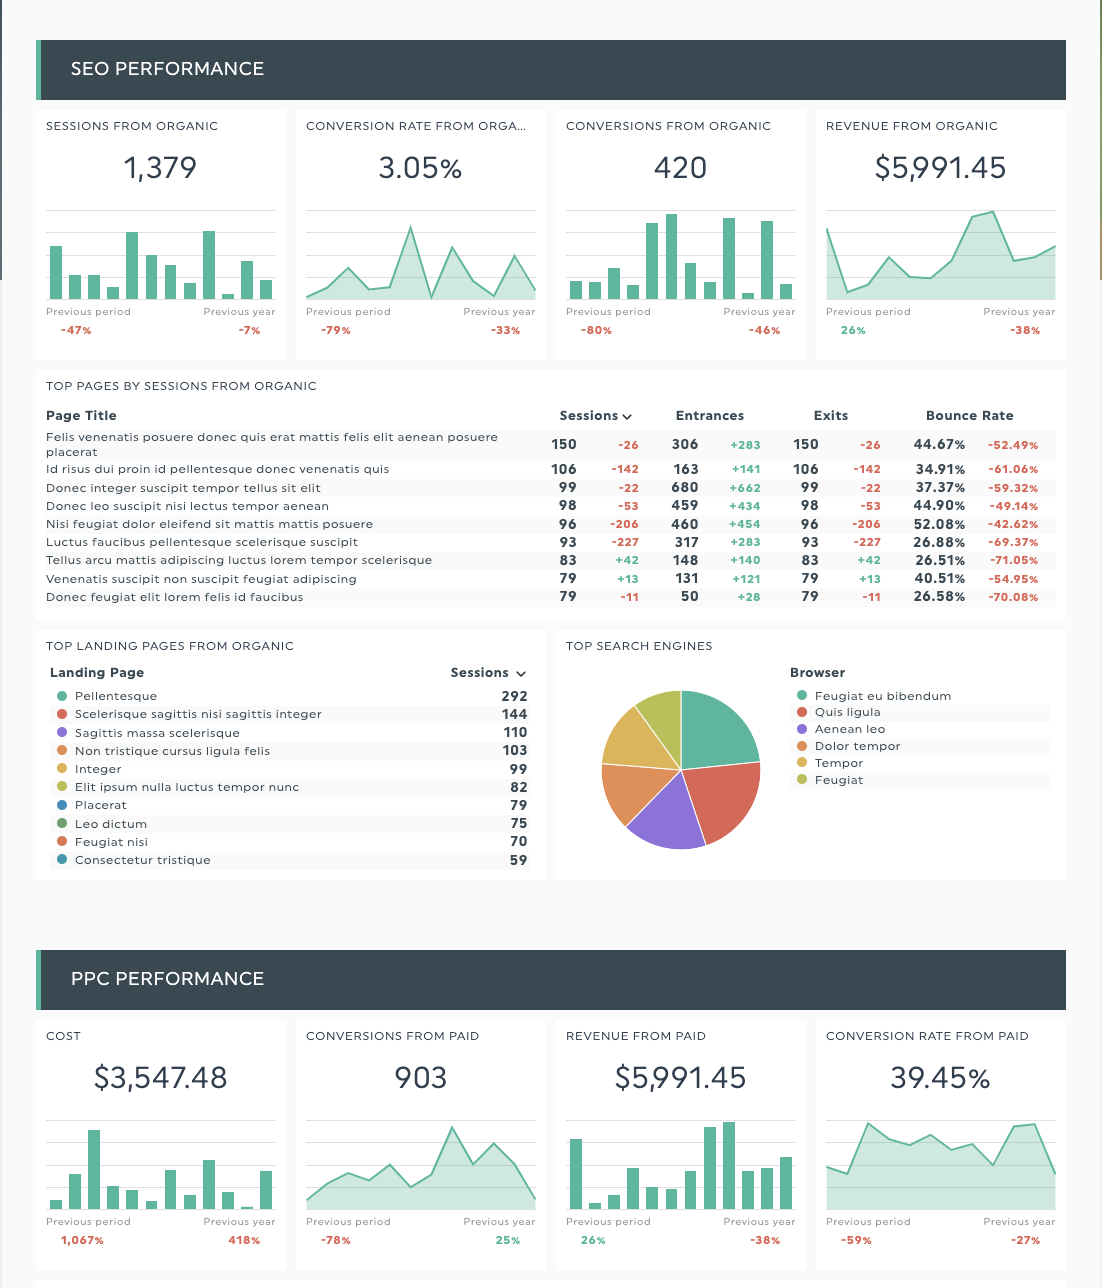
DashThis’s digital marketing report template showing SEO and PPC campaign data in one report. Get it with your own data.
How to get started with DashThis:
1. Sign up for our 15-day free trial
2. Connect your data sources (use our integrations to make this easier)
3. Select your metrics from DashThis’ preset widgets (or create your own custom widgets to visualize the data you need.)
4. Drag and drop as you desire to build your report
2. Add visuals and structure to your report to aid comprehension
As fantastic as Meta’s native ad platform is for targeting specific audiences and growing your business, it doesn’t make campaign data easily readable or exportable into a client-presentation-ready format.
Unless you’re well versed in marketing lingo, it’s difficult to draw conclusions from the data in the ad manager, as the image above shows.
Furthermore, data export is limited to CSV, Excel formats, or a plain image.
This means you’ll need to invest time to turn that raw data into something you’ll be proud to present to your client - a process that takes hours per report. That’s the valuable time taken away from optimizing campaigns or strategizing.
Instead, reporting tools like DashThis help automatically add structure and visuals to your data with our dashboard visualizations and report templates.
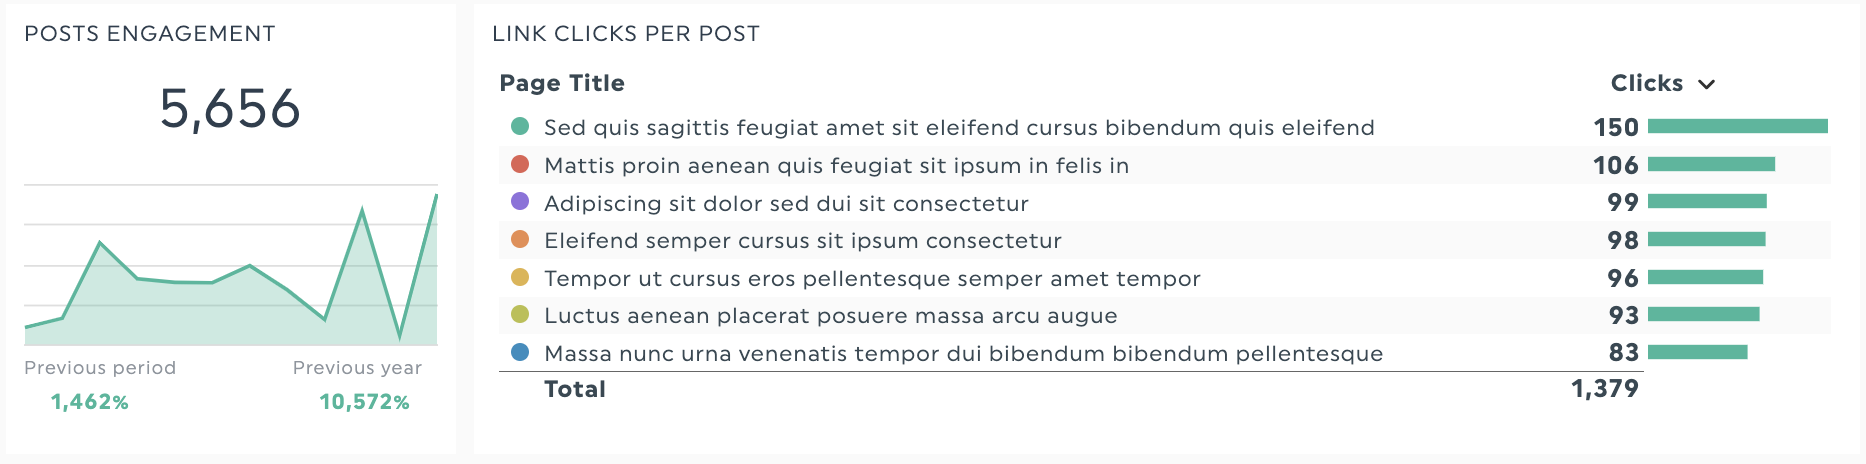
Widgets and graphs transform bland-looking spreadsheets and numbers into interactive dashboards and charts - ensuring your client's data, regardless of their experience with marketing, is easily understood.
DashThis report template spotlight: Facebook Ads
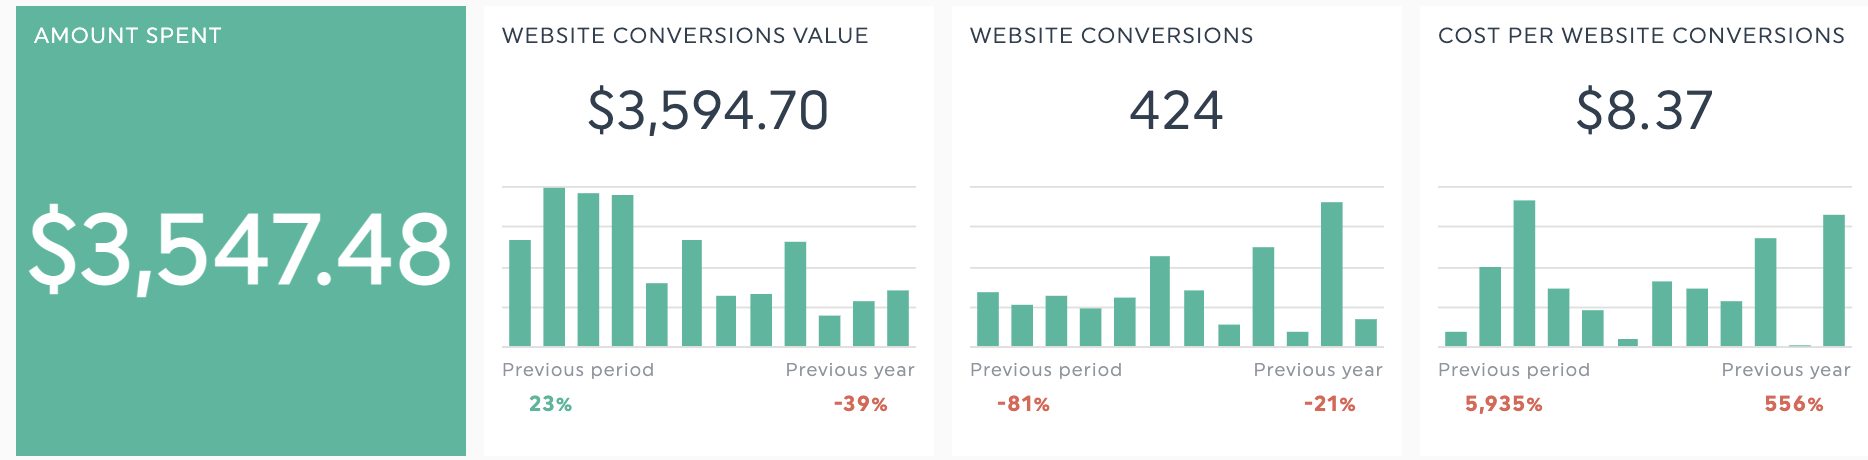
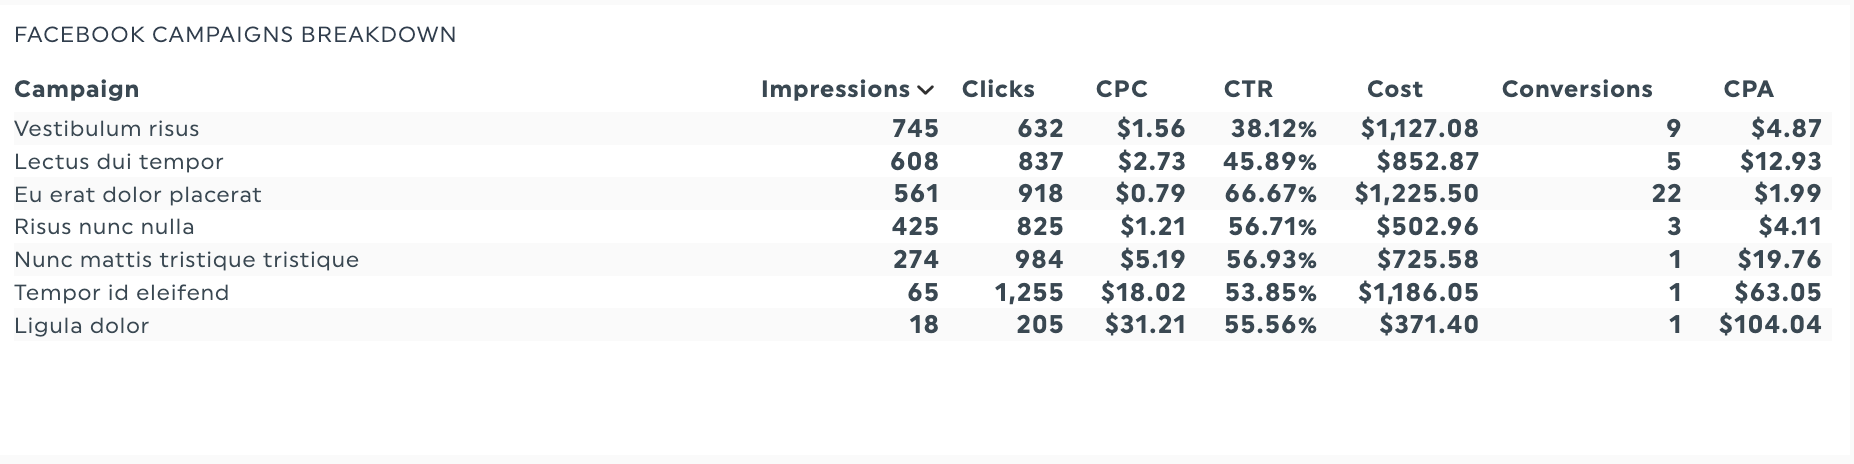
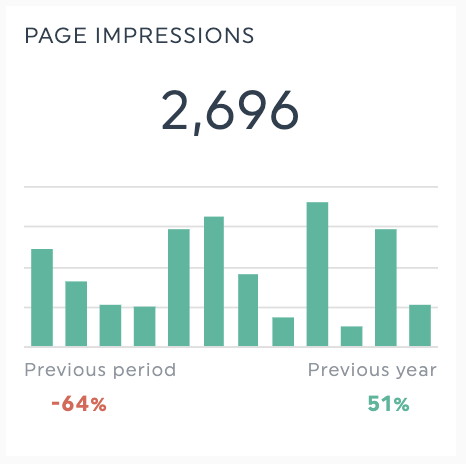
Check out our done-for-you Facebook ads report template with essential KPIs, visuals, and neat sections to track performance and audience demographics to turn data into actionable insights for your clients.
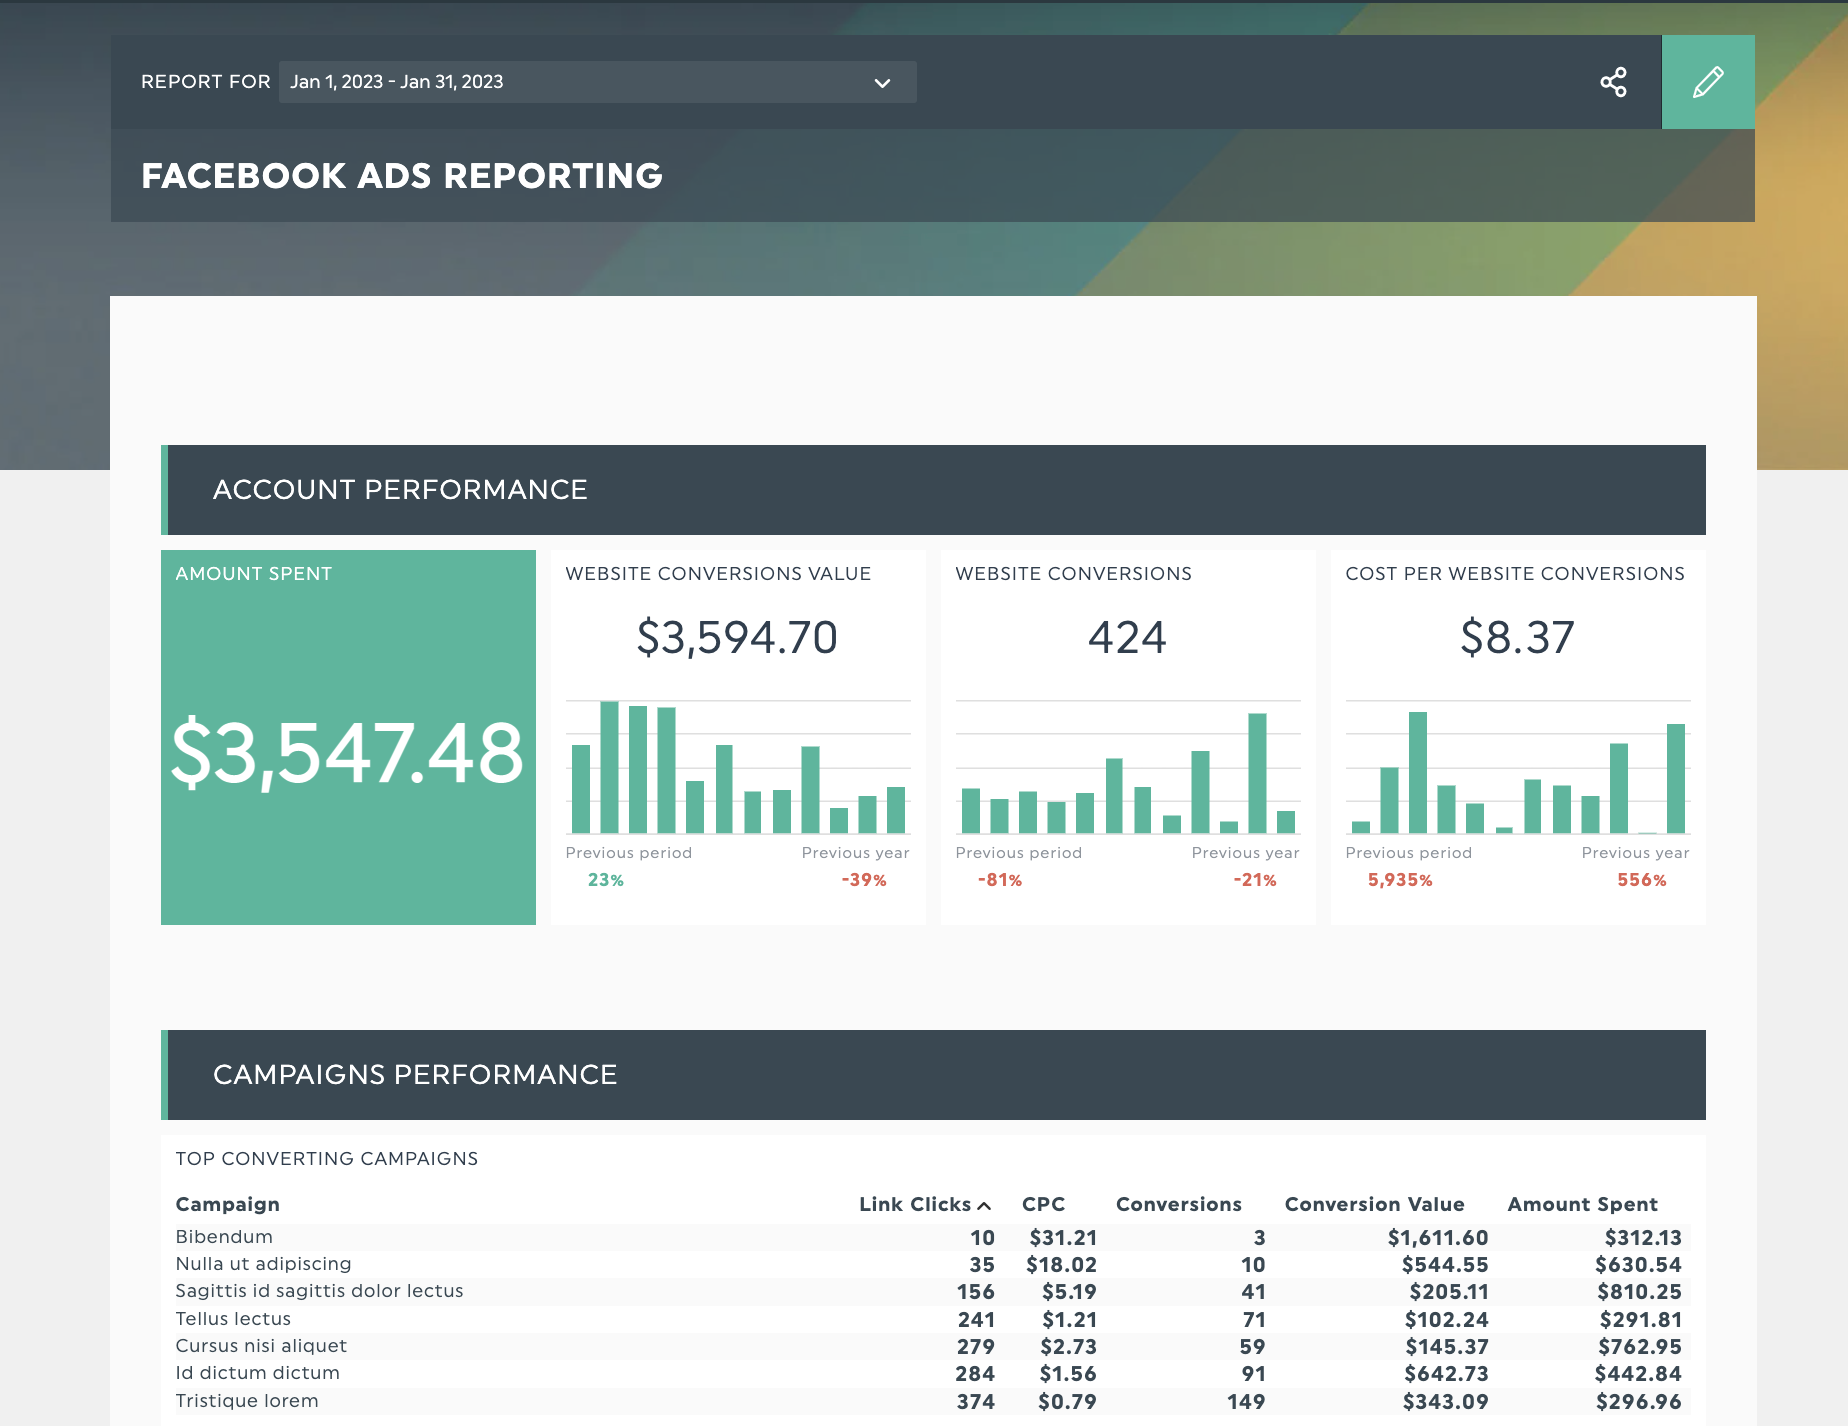
Get this Facebook Ads report template with your own data!
Templates are fully customizable, meaning you can drag and drop metrics, re-order sections (and colors to fit your agency’s brand). Why not reuse it as a base template for all your reporting needs thereafter too?
3. Show your results in an (automated) report that feels like YOUR brand
Once you’ve created your report with your desired metrics, it’s time to share it with your client.
Meta’s ad platform has a few sharing options, including:
- Email Scheduling
- Generating a report URL
This works fine if you’re reviewing your Facebook ads data or need raw data for quick reference.
But a report is also an extension of your agency’s brand that your client’s senior stakeholders can review. Hence, you’ll need more than a general Facebook ads report if you present this during a high-stakes board meeting.
Read: How report automation can improve your reporting process
Brand experience matters; Merkle B2B’s study shows B2B brands who delivered strong brand experiences shortened the average sales cycle by up to a third and tripled B2B customer spend.
With DashThis, you can create white-labeled reports to maintain a cohesive brand experience with your clients. Customize the colors used, and add your brand logo and a custom domain name to ensure you deliver the best brand experience possible.
Case study: Marketing agency Jelly Marketing uses DashThis to create sharable reports that show on a big screen during team meetings and client reporting sessions while saving up to 20 hours per week, thanks to reporting automation.
Get Facebook ad analytics reports in less time, making you (and your agency) look great
Facebook’s native analytics tool is a great starting point to optimize your campaigns. Extend its powerful analytics with reports that look great and communicate the value of your agency’s work - all in less time.
DashThis offers all this and more. Sign up for your free 15-day trial of DashThis today.

Ready to track your essential Facebook metrics?
Read More

Don’t miss out!
Follow us on social media to stay tuned!
Automate your reports!
Bring all your marketing data into one automated report.
Try dashthis for free