Why you need a meaningful inbound marketing report and how to create one

Committing to inbound marketing is a long-term strategy.
You’re providing value to your web visitors and meeting them where they are long before they purchase or convert on your website. Yet you’ll need to make sure your efforts are paying off. And that’s where inbound marketing reports come in.
How do you create meaningful inbound marketing reports without spending hours on them or getting overwhelmed? Which metrics should you report on?
We’ll answer all these questions and more.
- What are inbound marketing reports?
- What to include in your inbound marketing report
- - A clear goal and objective
- - Select the right metrics that link to your goal
- - Draw conclusions and recommendations based on the data
- 3 ready-to-use inbound marketing report templates
- How to create an inbound marketing report with DashThis
What are inbound marketing reports?
Since inbound marketing involves multiple activities like:
- Content marketing
- Email marketing
- Managing search engine optimization (SEO) rankings
- Social media marketing
Your inbound marketing report needs to cover multiple types of content and channels effectively while having all your performance metrics and key performance indicators (KPIs) in a cohesive flow.
Get this content report (and more!) template with your own data
Done correctly, inbound marketing reports help you and your marketing team:
- Understand which content channels perform better: Which social media networks drive qualified traffic and conversions? Which landing pages have the best conversion rates? You’ll answer these questions with an inbound marketing report.
- Get clarity on what to focus on: By defining your North Star metrics and proactively tracking progress towards these goals, you’ll keep everyone focused n the right things.
- Show the effectiveness of inbound marketing: Reports are a communication tool. Done well, they help your stakeholders and clients understand what’s going on, what’s happening next, and how your efforts contribute to meeting their goals and/or business goals.
What to include in your inbound marketing report
1. A clear goal and objective
Decide what to measure based on your inbound marketing strategy.
According to Sagefrog’s 2022 Marketing Mix Report, some examples of marketing objectives for B2B businesses
- Brand awareness
- Sales leads
- Website traffic
- Converting leads to customers
- Producing thought leadership
Once you’ve defined your overall marketing goal (and/or) channel goal, you can choose your KPIs to ensure you’re collecting the right marketing data.
Example: Writing a clear SMART marketing goal and selecting the proper KPIs.
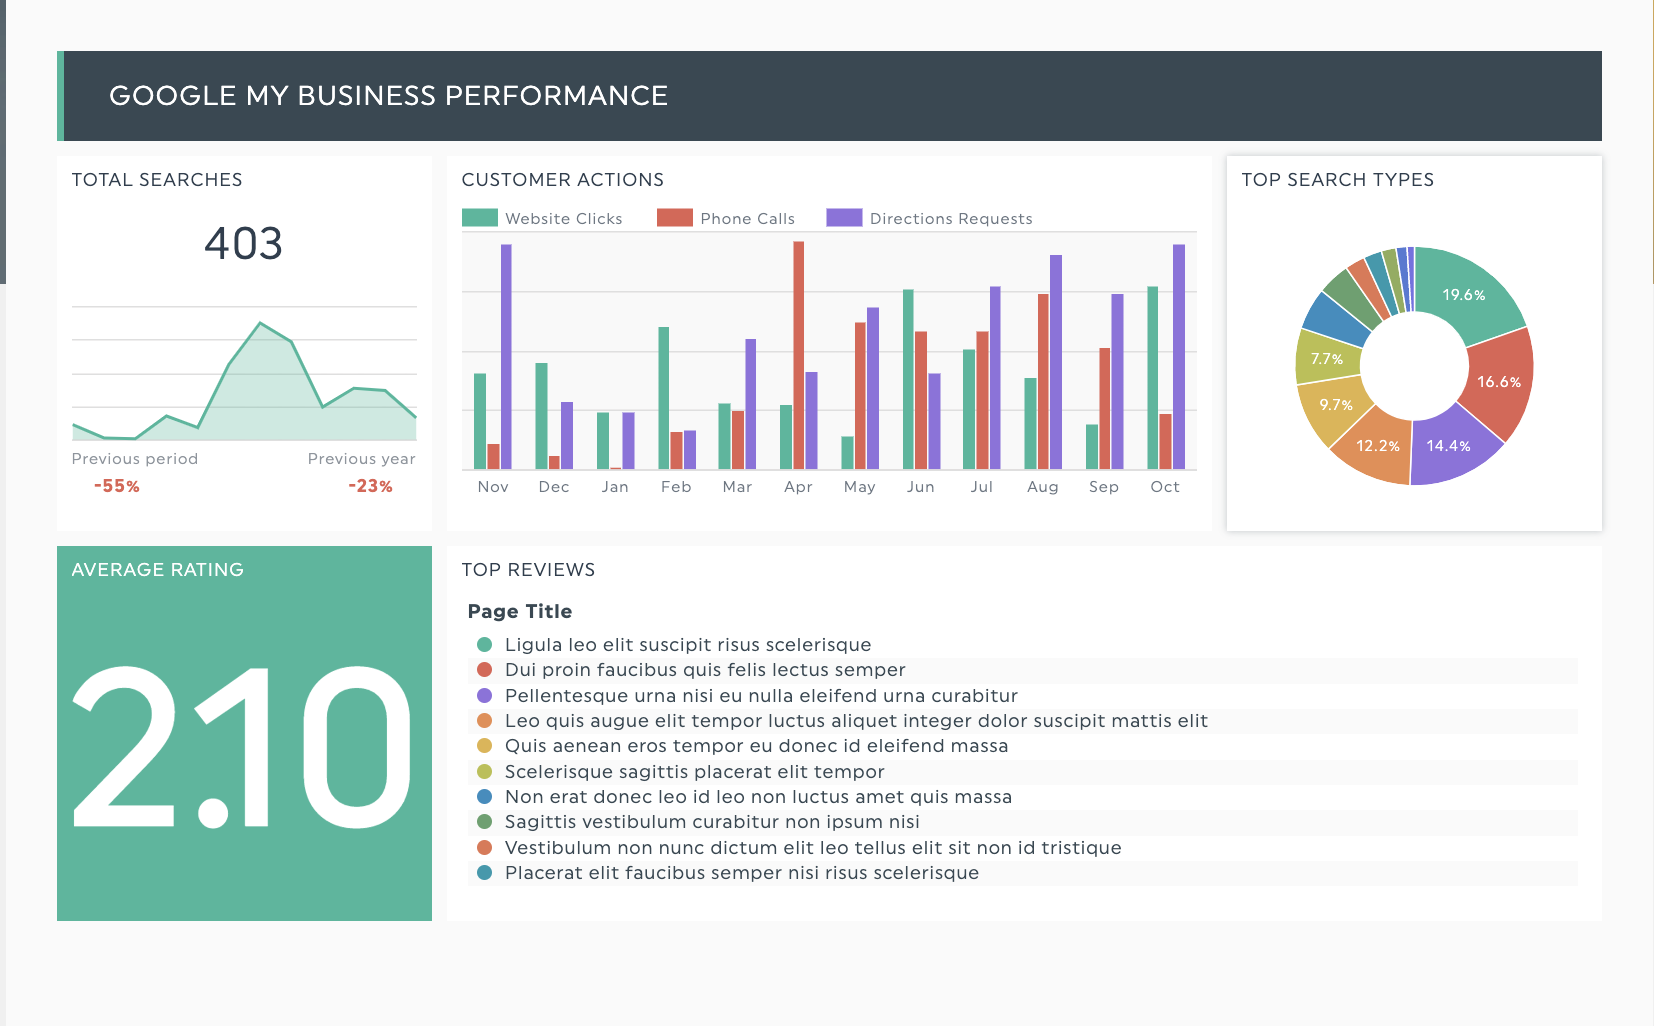
Let’s say you’re a marketing manager for a local service business that depends on web inquiries and phone calls for customers.
Here’s how you might write the goal using the SMART goal format.
Increase the total number of interested phone calls and average customer rating on your Google Business Profile to improve business lead generation and social proof within the next six months.
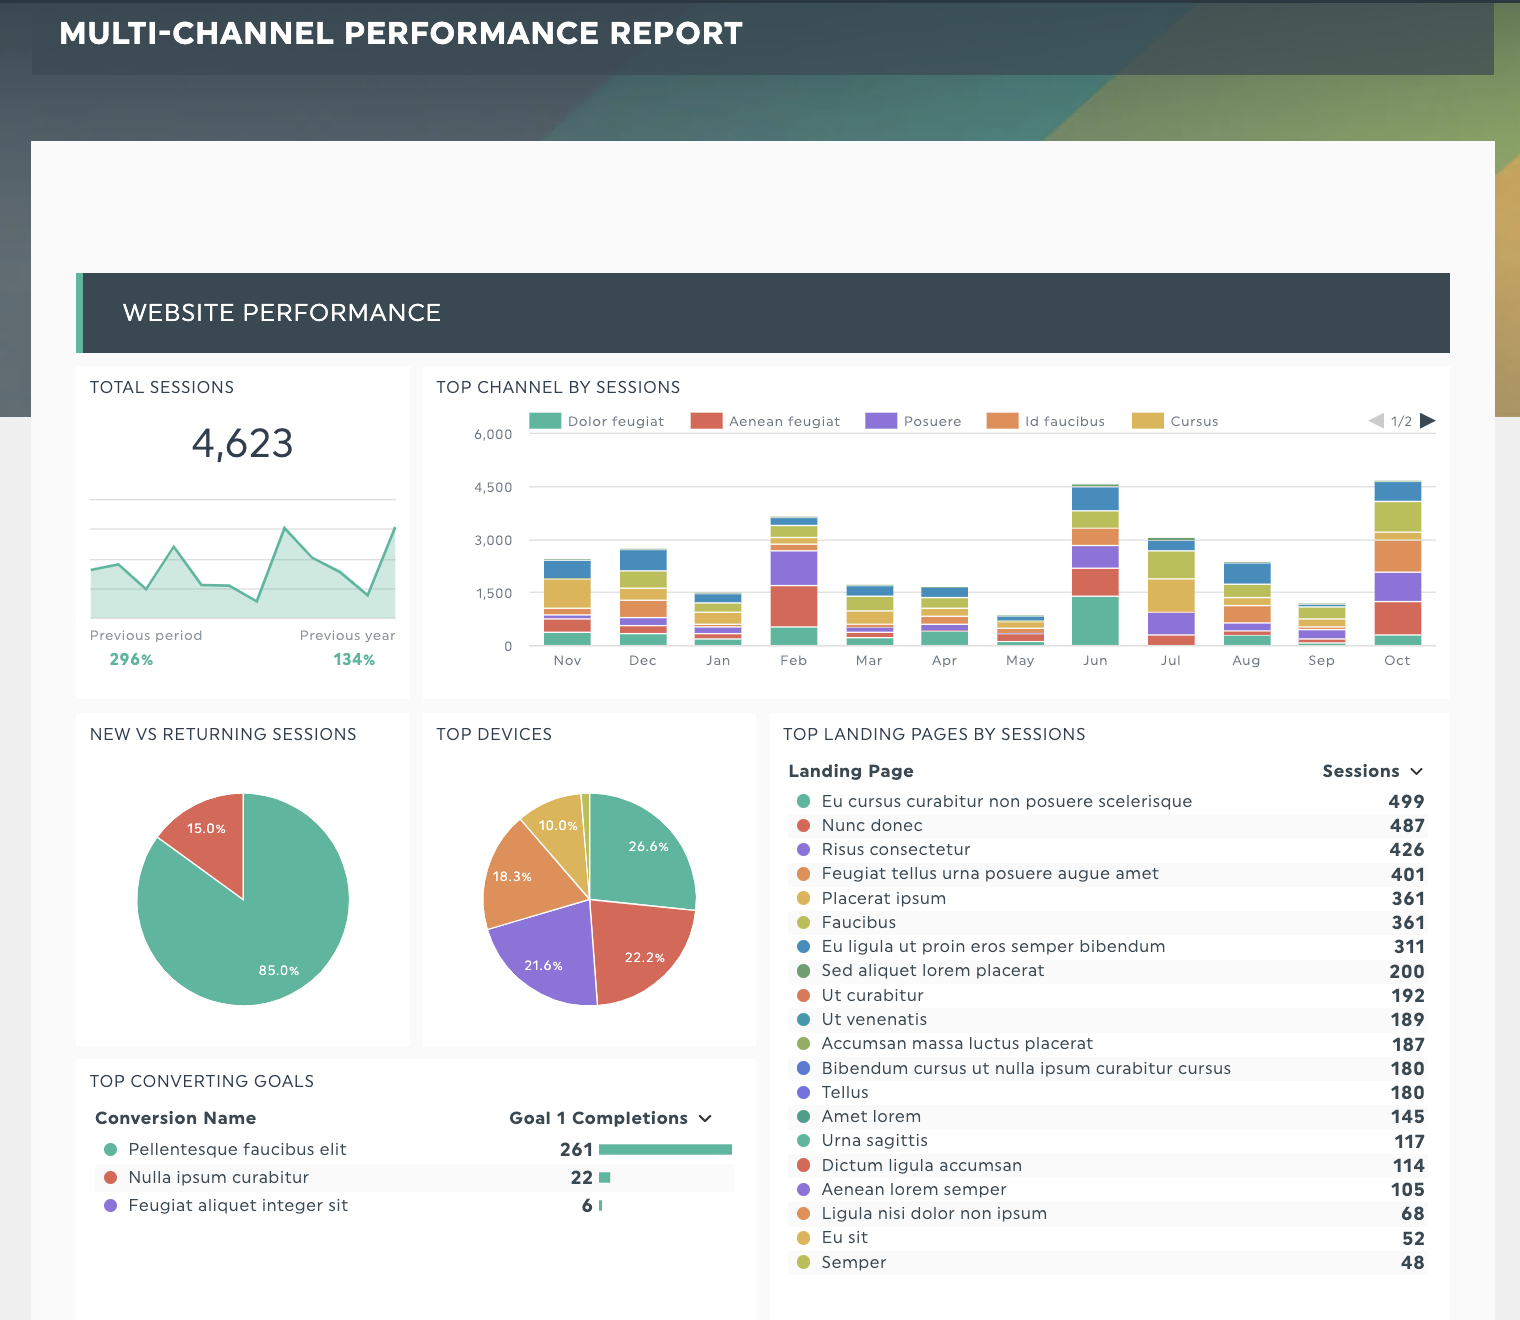
With your goal defined, put your essential metrics together in an actionable dashboard to gauge return on investment (ROI), like our content marketing reports.
Get this content marketing report with your own data
Read more: The difference between OKRs and KPIs
2. Select the right metrics that link to your goal (13 example metrics)
What metrics to include in your inbound marketing report? We’ve got 13 for you, sorted by question answered.
Traffic metrics: Is your website growing or attracting qualified traffic?
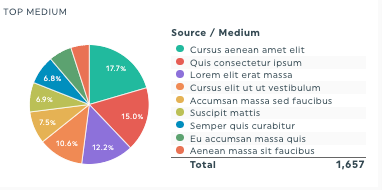
- Traffic sources: Understand which marketing channels attract the most web traffic and what to focus on. Tip: Cross-check your conversion and engagement stats to ensure they engage with your content.
- New customers vs returning customers: Key metric to measure if you want to improve your customer retention rates.
- Bounce rate: Did visitors find your content helpful? Analyzing your bounce rate helps answer these questions.
- Average page views per session or average session duration: How compelling is your content to visitors? These metrics also help you understand the quality of your user experience for critical conversion points like e-commerce checkout flows. Review this metric with other engagement metrics for a full picture.
- Page exit rates: Uncover optimization opportunities by showing you where and when people leave your website or customer journey.
Engagement metrics: Does your content resonate with your target audience
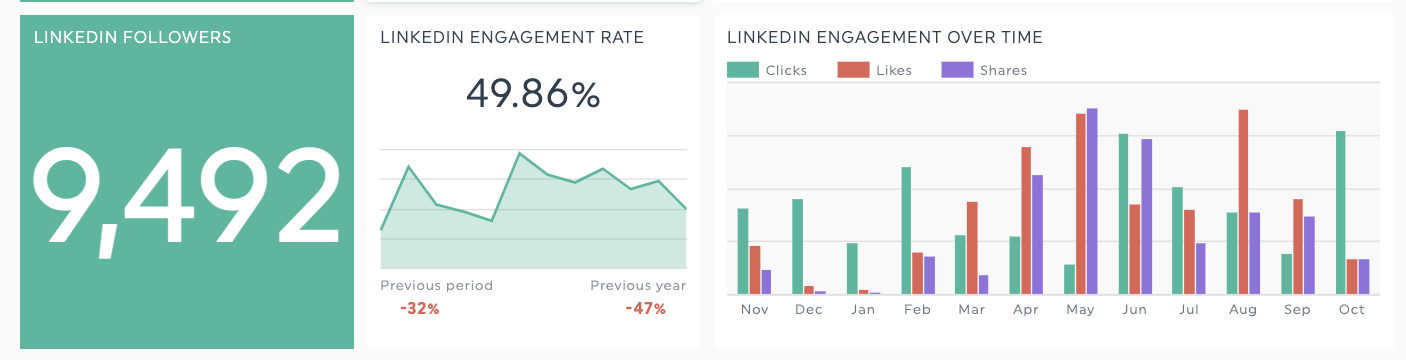
- Engagement rate: How well your social media channel content resonates with your target audience.
- Click-through rate: How many people clicked on the links in your email or paid search campaigns?
- Specific social media engagement metrics: Specific metrics differ across social media platforms. For starters, look at your Replies, Comments, Shares, and Saves (how often people save your posts for reference).
Conversion and revenue metrics: Are your marketing efforts generating qualified leads for your business?
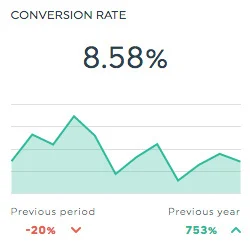
- Website conversion rate: Measure the percentage of your website visitors that convert on your website. Note that conversions aren’t always sales; they can be signing up for a newsletter or downloading your app or content offer.
- Cost per lead: How much are you spending to gain these leads? Also see, customer acquisition cost
- Goal completion rate: Measures how many of your visitors complete the goal you’ve set out. Examples include visiting a specific campaign landing page, completing a purchase on an e-commerce site, or visiting a target number of pages in a single session.
Audience and demographics metrics: How many people are seeing your content
- Social media impressions/reach: Running a brand awareness marketing campaign? Track its effectiveness with these two metrics
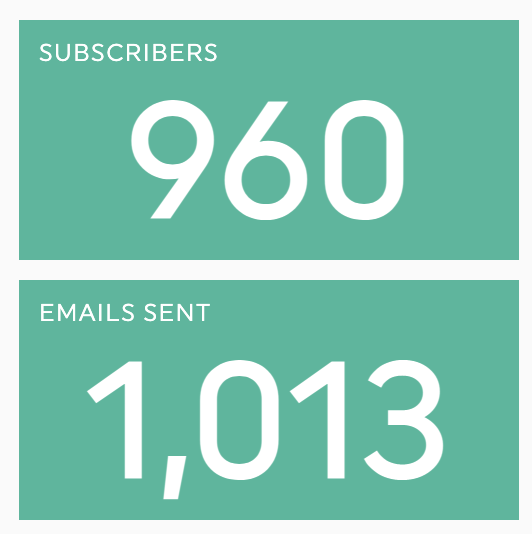
- Email subscribers/unsubscribes: Track your efforts to get more email subscribers for your newsletter or lead nurturing campaigns with these metrics. Tip: Use email segmentation for more personalized messaging - like segmenting emails based on what content they’re interested in.
Read more: 100+ KPI examples for your next inbound marketing report
3. Draw conclusions and recommendations based on the data
Any data you include in your report should answer these two questions:
- How do these data points relate to my business goals?
- What should we do next?
Here’s how to add these valuable insights to your report
- Annotations: DashThis allows you to annotate graphs and metrics with notes and comments; useful for summarizing key points, explaining anomalies, and including helpful context or recommendations on what to do next.
Here’s how to add an annotation to a chart in a DashThis report.
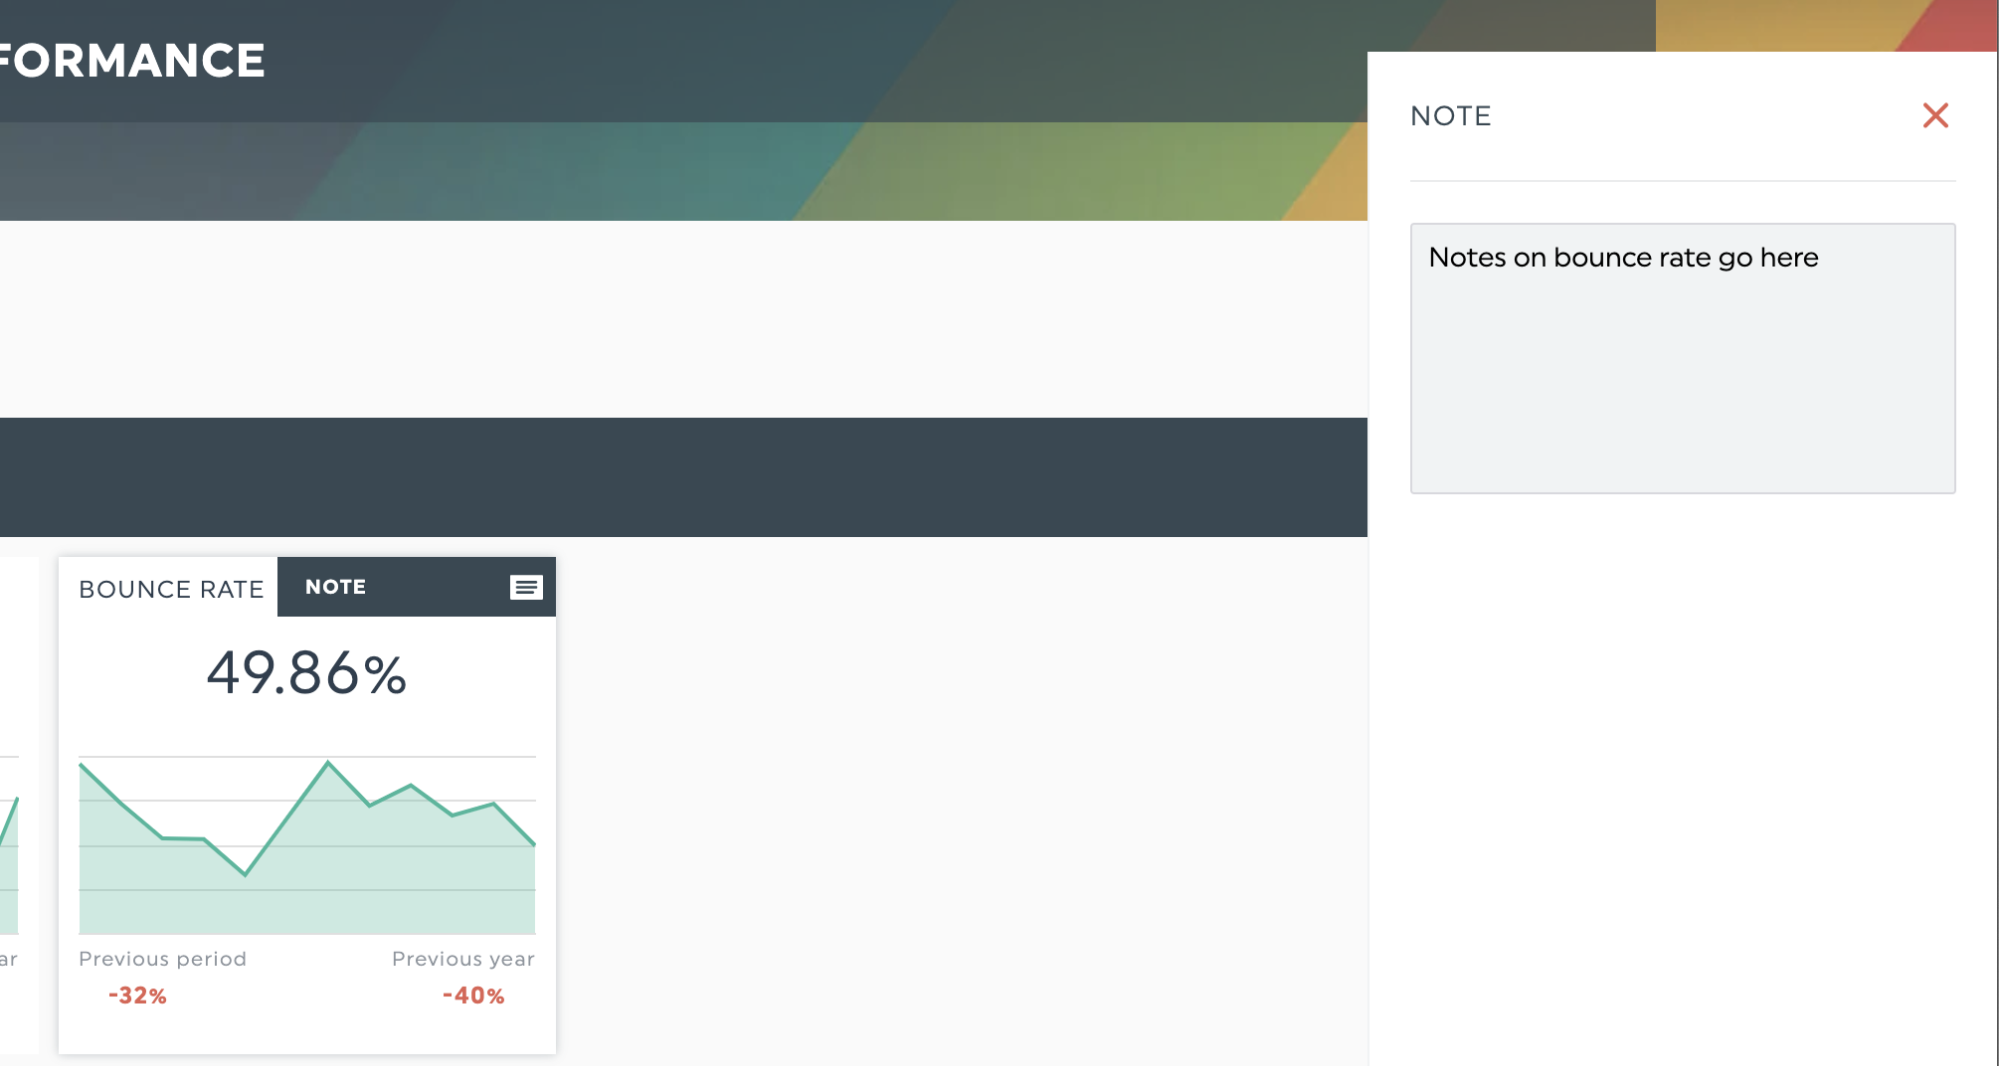
How a note in DashThis looks like in live view
- Use multiple metrics to conclude. One metric alone doesn’t tell you the complete picture. For example, if your recent social media content reach has increased, but website sessions remain flat, you might target the wrong hashtags or audience. Or, if your organic traffic increased with no change in your total conversions, review your SEO strategy to see if you’re targeting the right keywords.
- Make a recommendation!
When presenting a recommendation to your client or stakeholder, aim to answer these three questions.
Let’s say you’re running an e-commerce store. While reviewing your latest weekly report, you see a higher-than-average exit rate on your checkout page.
Here’s how you might present this to your boss.
- What has changed since the last report? (Example: We’re seeing a high exit rate on our e-commerce checkout page this month, meaning there may be an issue with our sales funnel as people aren’t completing their purchases)
- What are we going to do about it? (Example: Find out why by reviewing our payment processors, site forms, and our checkout flow. Review the copy on our call-to-actions (CTAs) or remove any distracting pop-ups on our website.
- What impact are we expecting? Greater clarity on what’s creating the issue and insights to reduce exit rates on our e-commerce checkout page)
3 ready-to-use inbound marketing report templates
Since inbound marketing typically involves multiple channels, take inspiration from our report templates to create your own report that suits your needs. Use section headers to separate each set of metrics in your report to keep them clear and concise.
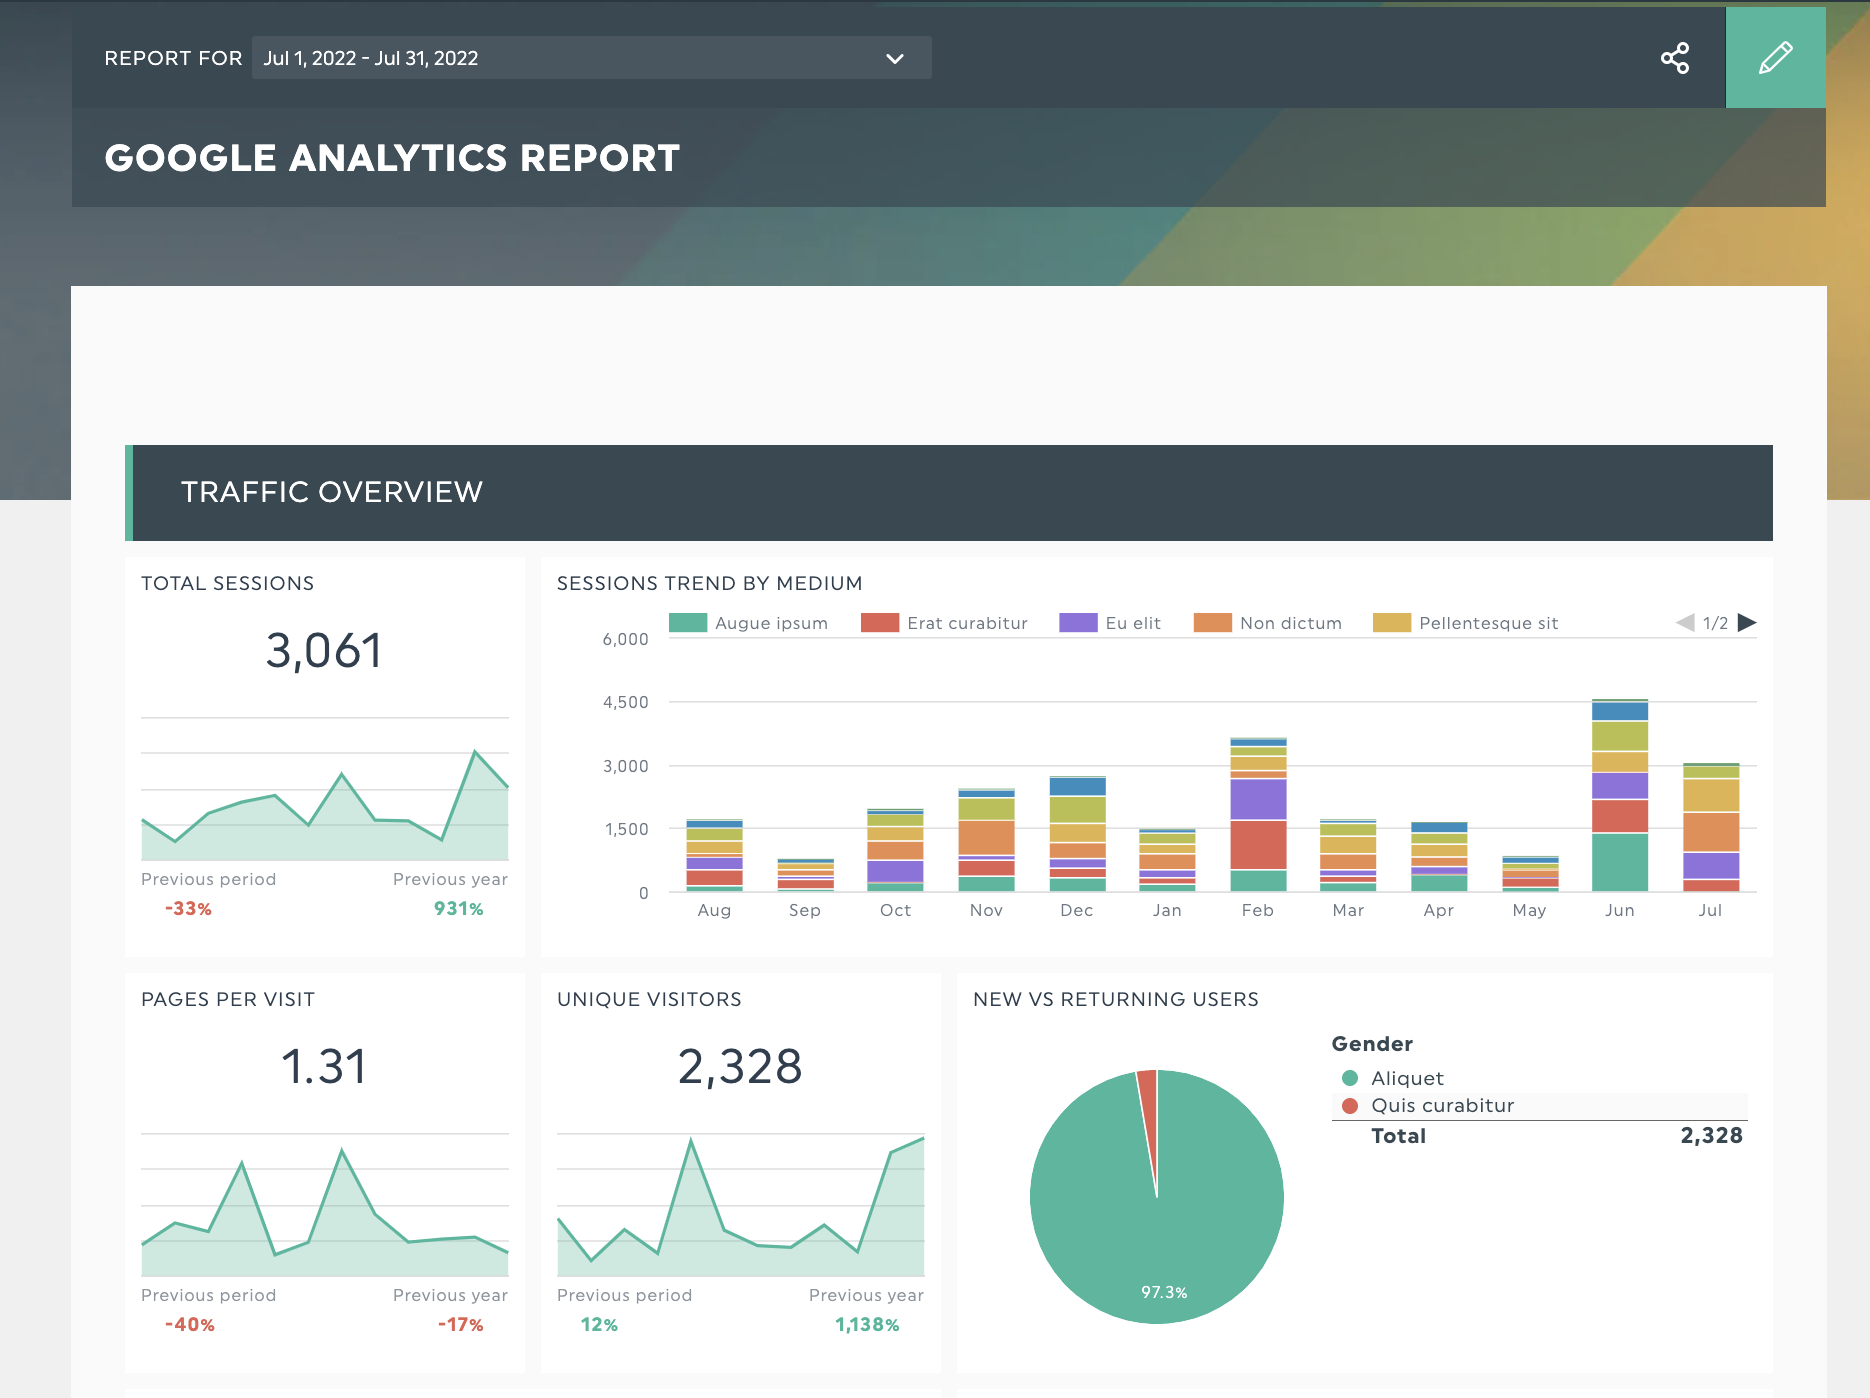
Digital marketing report template
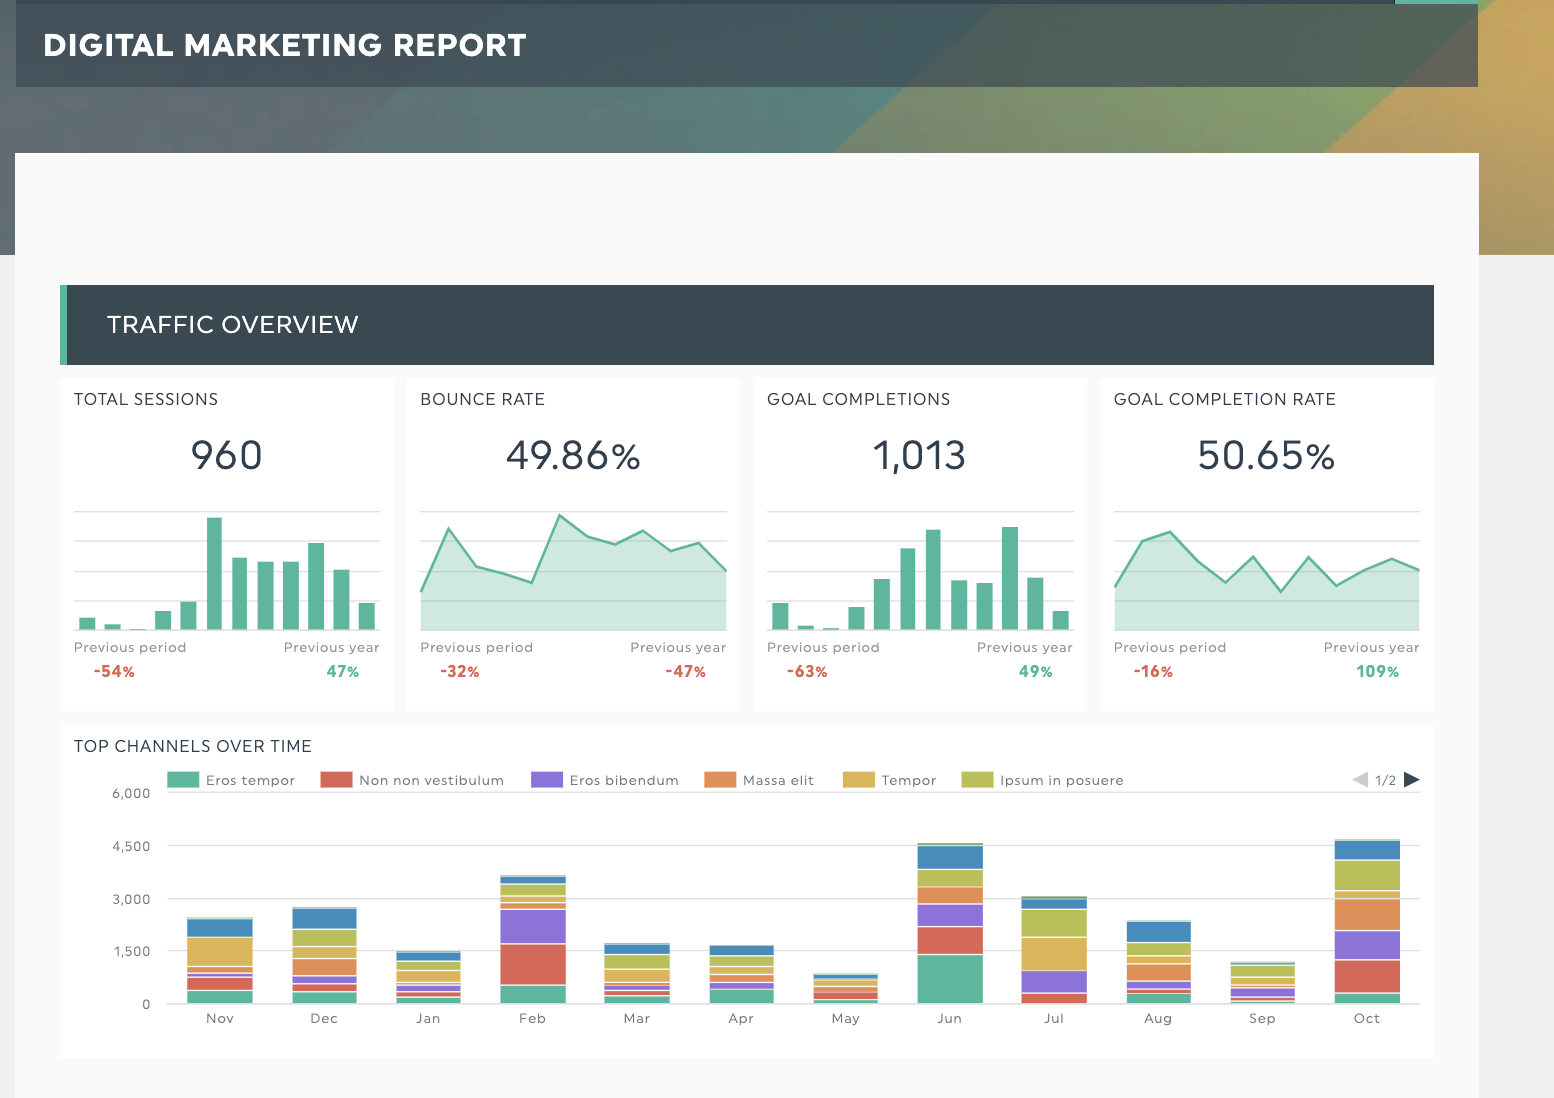
DashThis’s digital marketing report template: Get your digital marketing report with your own data
Get all your data from your entire digital marketing suite organized and neatly presented in one report. Instead of opening 27 different tabs and manually importing/exporting PPC data into PowerPoint or Excel, this template will help bring all the data across your marketing tools into one place.
Advertising campaign report template
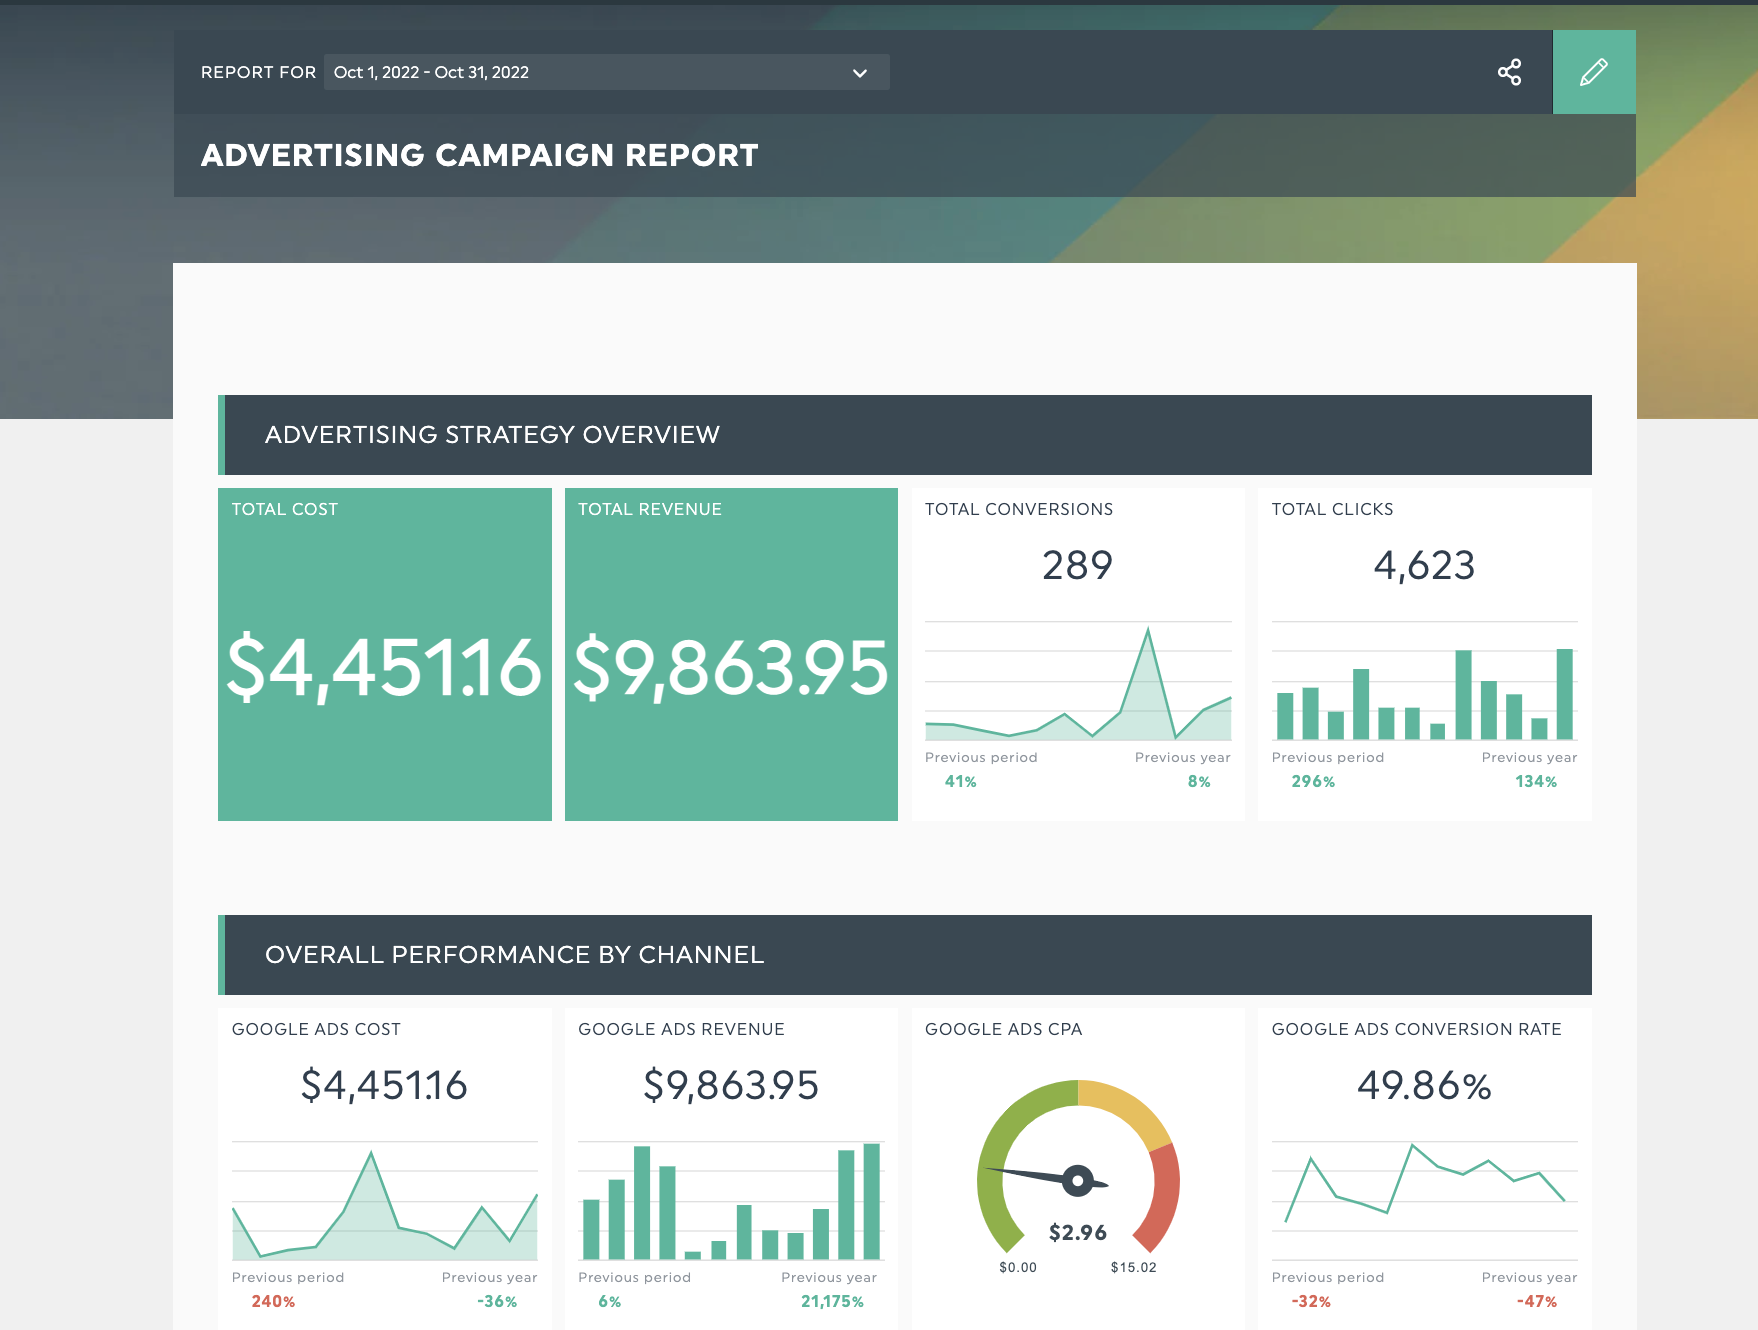
Get your advertising campaign report with your own data
Running a multi-channel advertising campaign? Use this report to get all your marketing analytics at your fingertips, helping you build trust with your clients or stakeholders on what’s happening in your campaigns.
Email report template
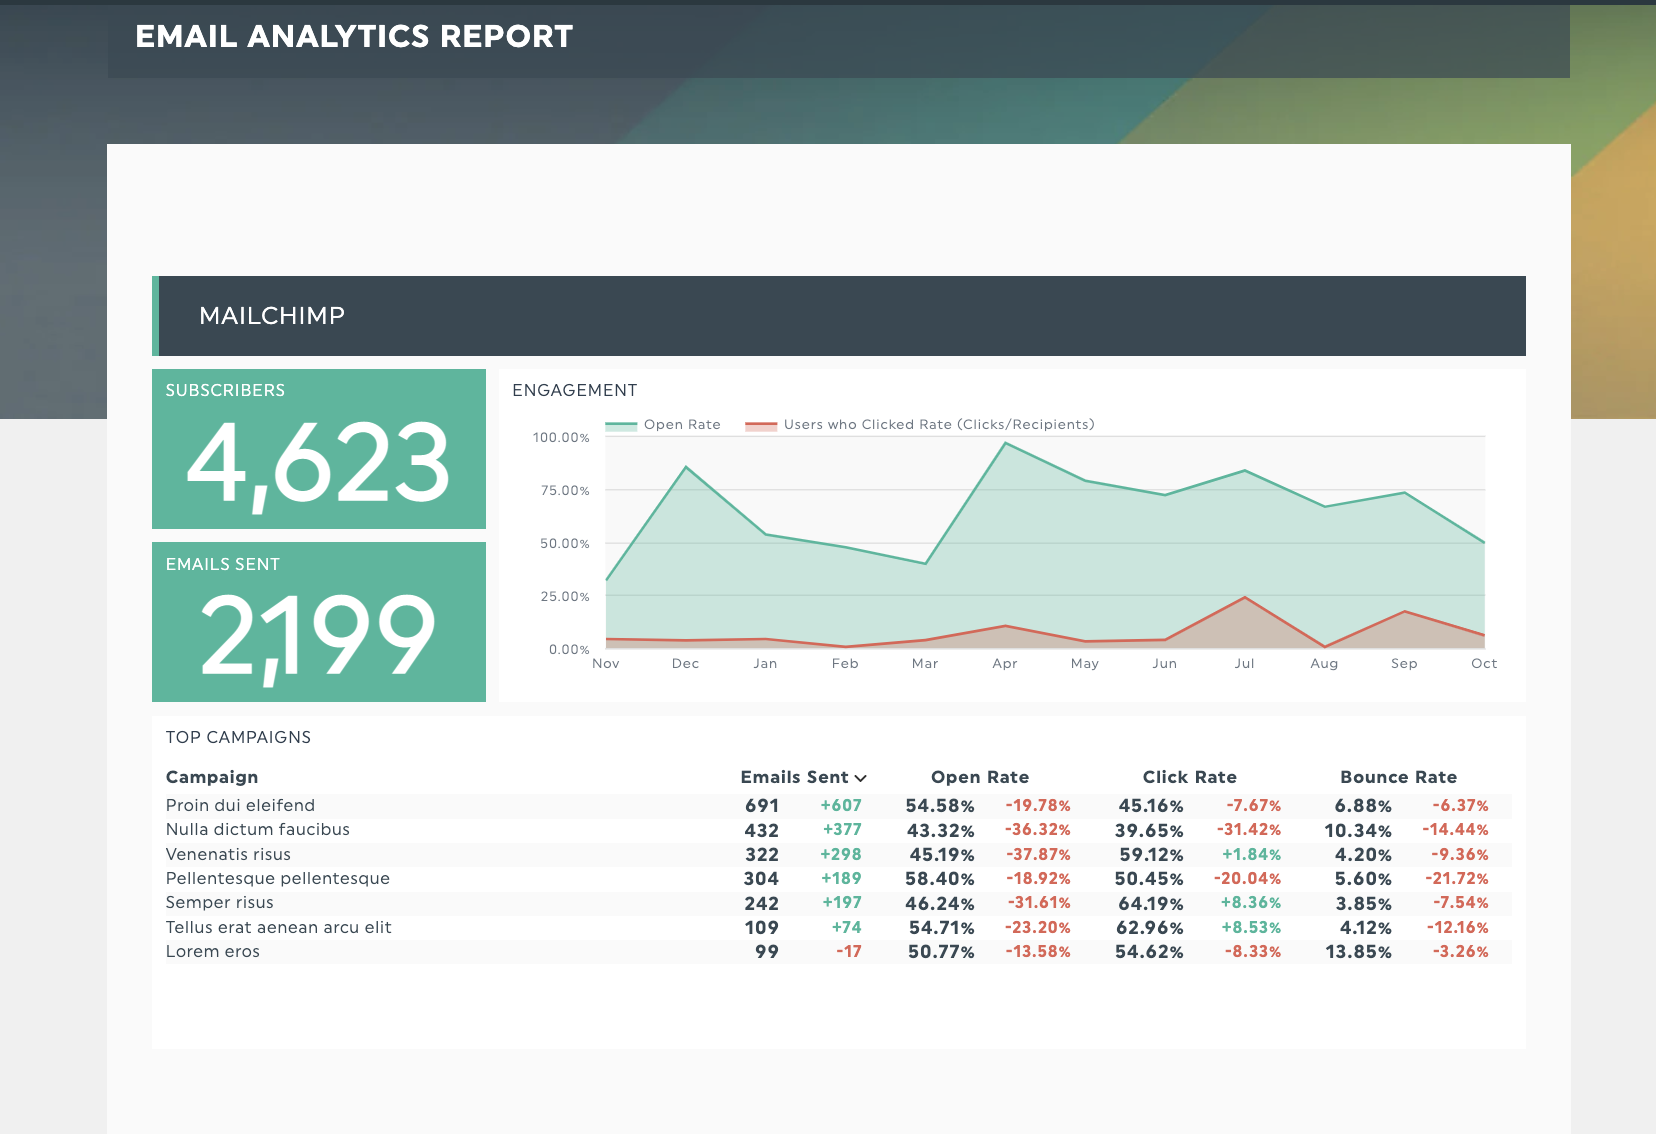
Get your email report with your own data
Show all your email marketing metrics for email campaigns and lead nurturing sequences in real-time with this report. This template tracks email campaign performance (open rates, email click-through rate in a chart so you can see how your metrics have changed. By doing this, you'll be able to determine which campaigns resonate with your subscribers or what email elements you should A/B test in seconds.
Need more report template examples to choose from? Head on over here.
How to create an inbound marketing report with DashThis
Get 20+ report templates just like this one with DashThis. Try it with your own data here.
You can get started in minutes. All you need to do is.
- Sign up for an account with our free 15-day trial
- Connect your marketing tools with our 40+ integrations
- Select the metrics to include from our Preset Widgets
- Choose your preferred preset marketing report template or create a new one from scratch!
Connect action with results with an inbound marketing report
When you invest in reporting automation, you’re investing in clarity.
The clarity to make informed decisions and communicate well with clients. The process takes some time at first, but with automated reporting tools like DashThis and some time to define your reporting process, you’re investing in a solid foundation for your business.
Visualize all your inbound marketing metrics in one place with DashThis. Sign up for your free 15-day trial today.

Ready to create an awesome inbound marketing report?
Read More

Don’t miss out!
Follow us on social media to stay tuned!
Automate your reports!
Bring all your marketing data into one automated report.
Try dashthis for free