Top 9+ LinkedIn KPIs and metrics to measure your LinkedIn marketing efforts

You've probably heard of LinkedIn if you’re a B2B marketer or salesperson.
With 63 million active decision-makers on social media, it's one of the best places to find new clients. It’s also one of the more effective social media platforms for B2B organic social media content in 2023.
If you want to build relationships with these potential customers, you’ve got to understand your LinkedIn critical performance indicators (KPIs) and the essential metrics to track.
We’ve narrowed down 9 LinkedIn KPIs for you to track if you want to grow your LinkedIn company page or optimize your LinkedIn ad campaign to deliver more sales for your business.
What are LinkedIn KPIs?
LinkedIn KPIs come in two categories:
1. LinkedIn company page or personal profile performance
These KPIs measure the organic engagement and growth rates of your LinkedIn company page or LinkedIn profile. Track KPIs like total followers and post engagement rates to analyze how the content on your LinkedIn page is performing.
2. LinkedIn ads performance
Besides organic reach, you can also run ad campaigns as part of your LinkedIn marketing strategy to generate leads and boost sales and brand awareness of your company.
Tracking campaign efficiency metrics like conversion rates, cost per conversion, or engagement rate is helpful to ensure your campaign delivers results at optimum cost.
How to measure KPIs in LinkedIn analytics
LinkedIn already has a solid native analytics platform which you can access for free!
You can view the Analytics tab here if you have admin or analyst rights on your LinkedIn company page.
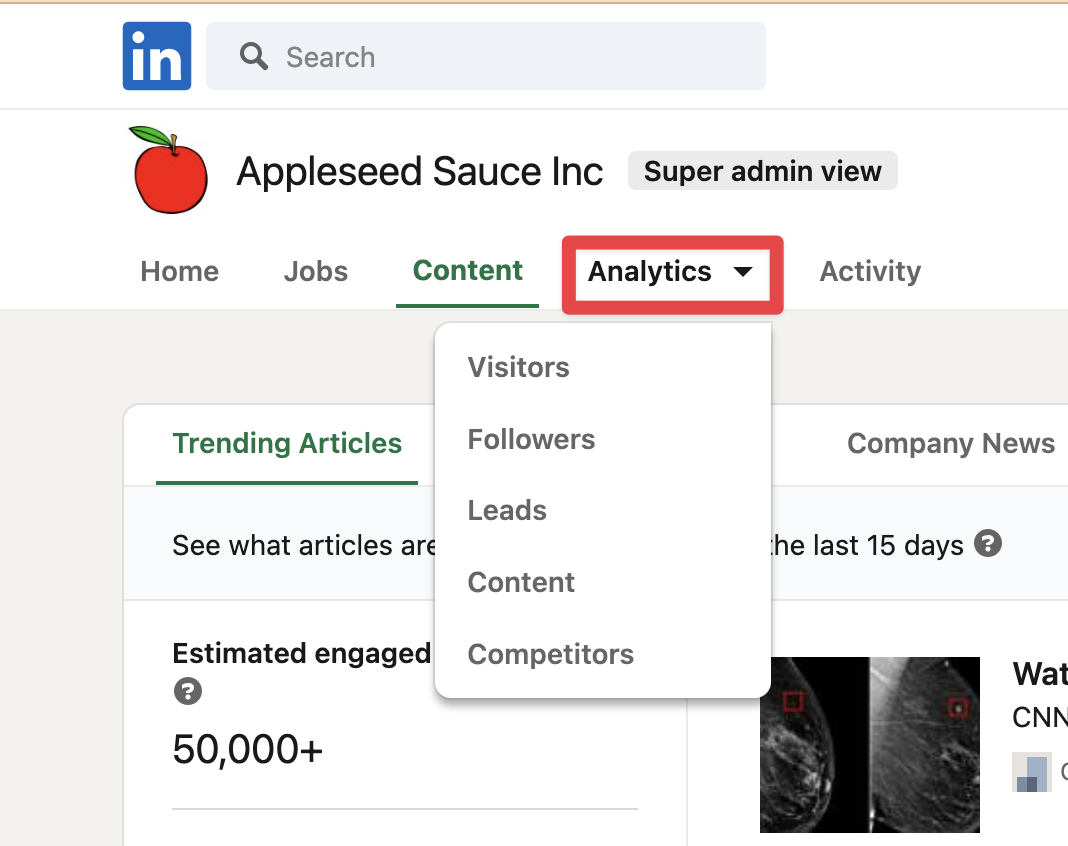
Page admins have full access to the LinkedIn analytics tab.
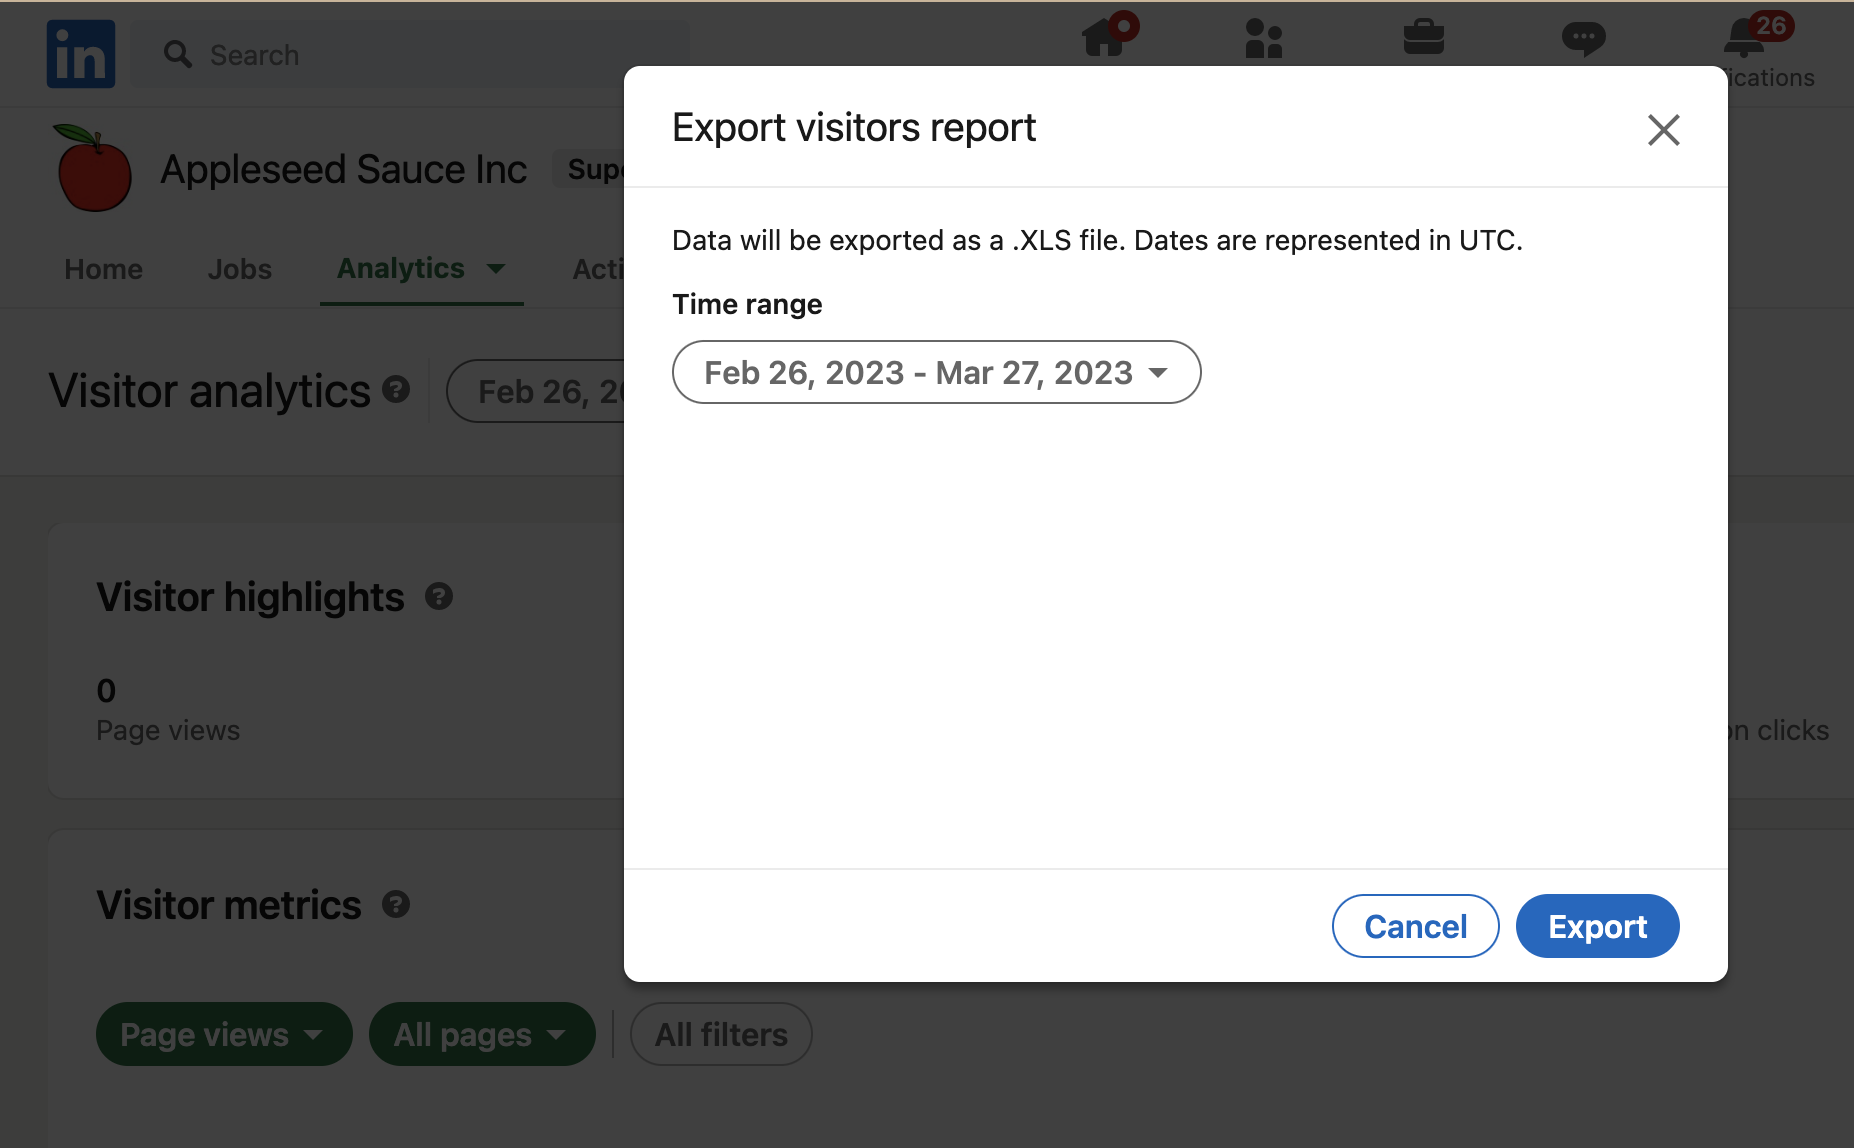
Exporting LinkedIn data in .xls format is also an option.
If you’d like to take your reporting to another level, tap on reporting tools like DashThis. You can combine LinkedIn KPIs with crucial metrics from other digital marketing platforms as part of your reporting to get a complete picture of all your digital marketing efforts.
Examples of how combining digital marketing metrics with LinkedIn metrics can help you report more efficiently in one report:
- Analyze LinkedIn data with Google Analytics metrics to understand how many people visited your site from LinkedIn
- Examine organic traffic growth to assess the effectiveness of content marketing campaigns on LinkedIn
- Compare LinkedIn engagement with other social media channels like Facebook or TikTok to analyze which social media platform to focus your efforts on
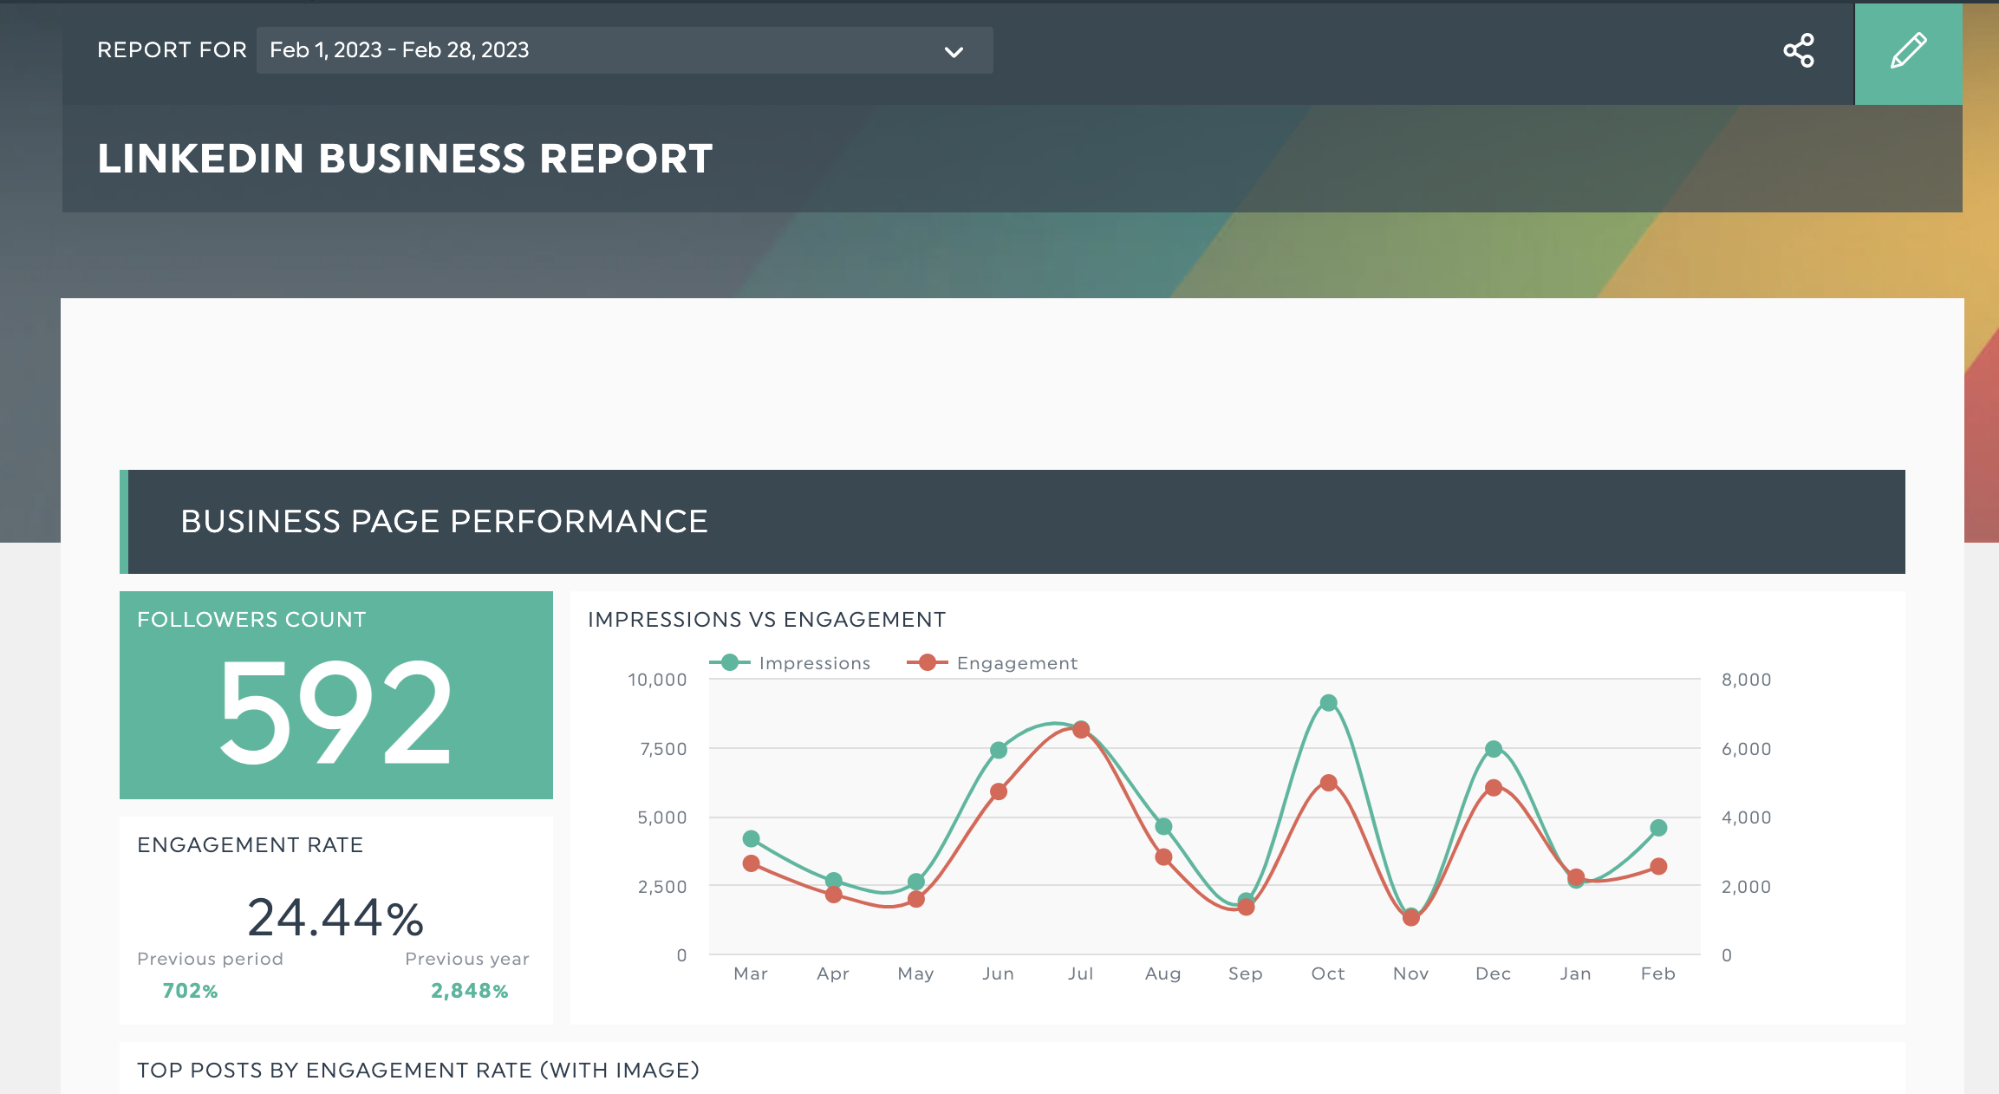
Get your LinkedIn business report with your own data here
We’ve got a bunch of report templates, including this LinkedIn business dashboard to help quickly visualize and report on your LinkedIn business page metrics or ad campaigns. Turn your Excel spreadsheets into beautiful visualizations that are easily understood and explained in minutes.
What are the top 9 essential metrics for LinkedIn analytics?
Number of followers
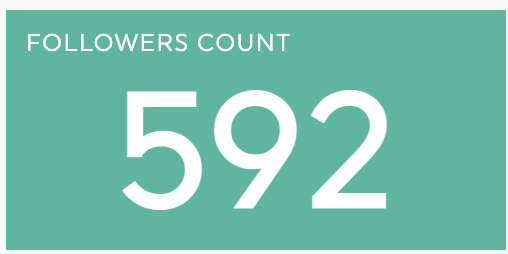
This top-of-the-funnel metric shows the number of people who can see your page’s content and LinkedIn posts in their social media feeds.
More new followers mean more people see your LinkedIn content, which helps you build credibility with your target audience over time.
Besides the number of followers, you’ll also want to track the follower growth rate over time and compare this to the content you’ve posted this month to see what’s driving growth. Combine these metrics with audience demographics to get more specific insights on what’s resonating with your audience.
Audience demographics
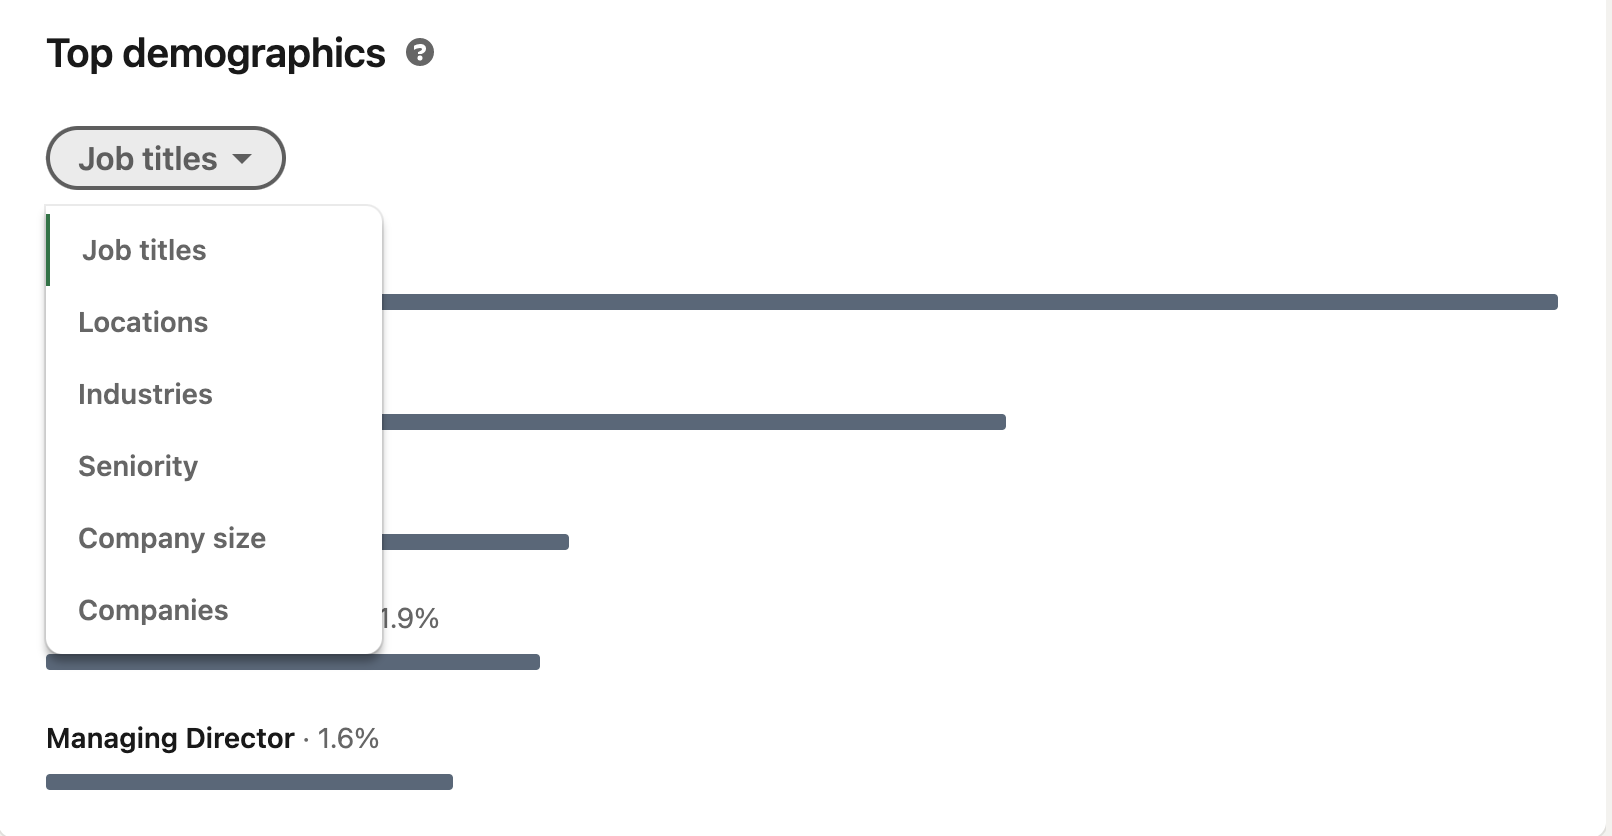
Analyzing your follower demographics lets you home in on creating more targeted content. It also acts as a pulse check to ensure the right people are following your page and you’re communicating with the right audience.
Audience demographics let you understand who makes up your audience, which industries they work in, and how senior they are. The next time you plan a LinkedIn campaign or content strategy, here's how you might use the info.
Create more tailored content:
Use the job titles, seniority, and company size data to understand who your content reaches and create specific content for them. For example, if you see content marketers from small startups following you, you could create content that helps them work efficiently with fewer resources for lead generation.
Find out what's happening in your top 3 follower locations:
Are there emerging trends in your follower’s countries or industries? Create content explaining these trends and how your company’s product can help address them.
Page views
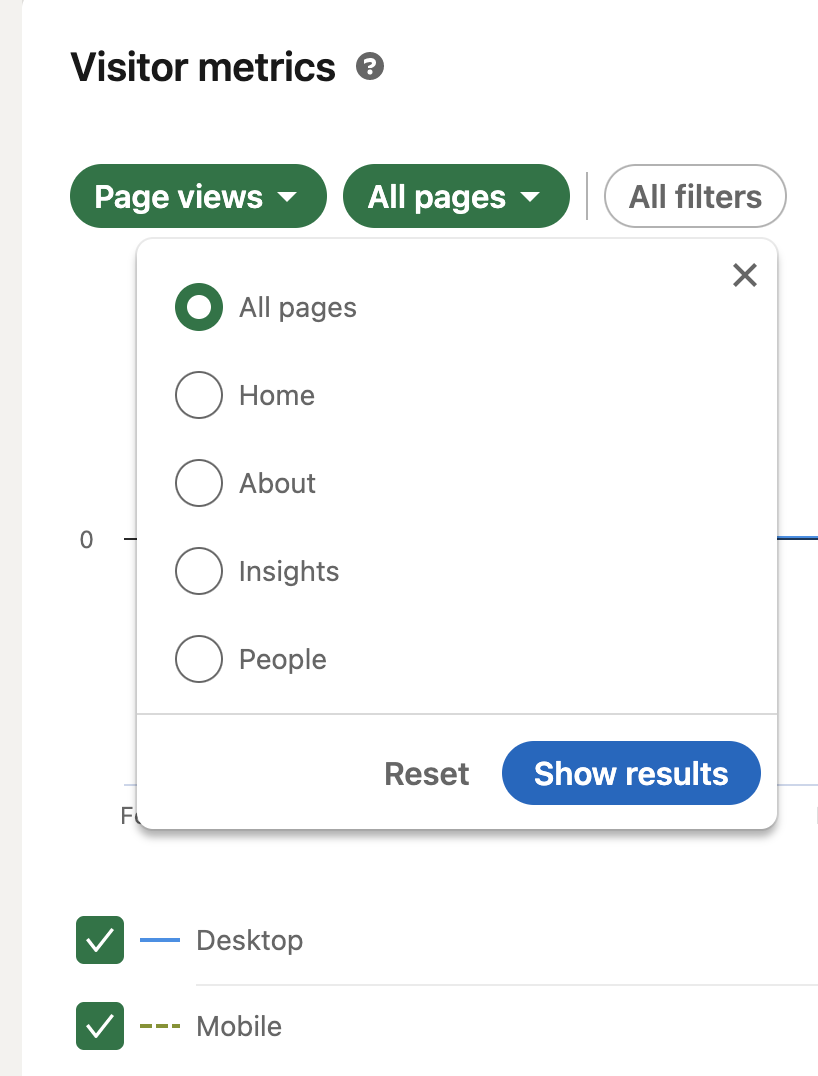
Page views answer three essential questions:
- How often have LinkedIn users viewed your company page?
- Which are the more popular pages?
- Do most people view your page on mobile or desktop devices?
Page views count all views, so if a person visits twice, they’ll count as 2 page views.
These insights guide your LinkedIn company page optimization. Are you seeing significantly more views on your About page than on your home page? Make sure you update your About page. If you see more unique visitors on mobile devices, ensure your page’s content remains appealing.
Reach
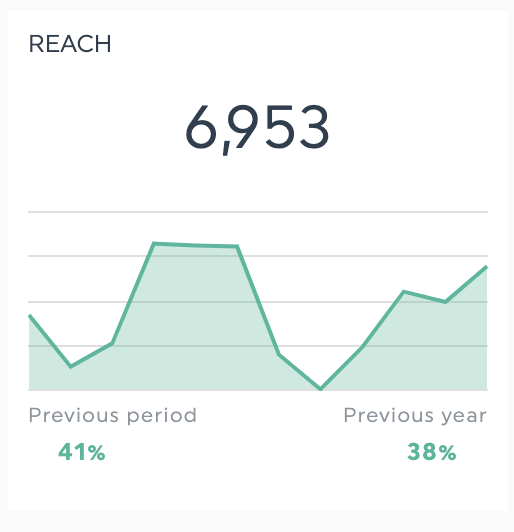
A critical brand awareness metric, reach determines how many unique people see your posts and shows you whether people find your content valuable. Use this metric to assess when’s the best time to post content, the content topics to tackle, and how to optimize your posts for maximum engagement and reach.
LinkedIn is a social network, so get social! Test different ideas to determine what works for your company and target audience. Respond to comments or questions on your posts, kick off engagement with a prompt, and so on.
Post engagement metrics: Comments/shares/reposts
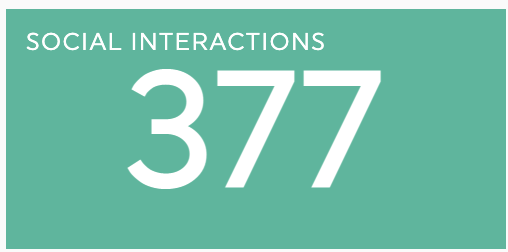
People love to comment on posts they find engaging or share posts they resonate with, so tracking the number of interactions on each post does wonders for figuring out which type of content works on your LinkedIn page.
Besides comments and shares, LinkedIn introduced the option to repost content, allowing you to share content from other people or company pages while crediting the original creator.
Engagement rate
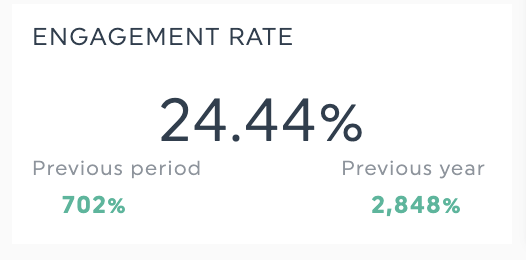
Treat engagement rate as an overall feedback mechanism to see if your content resonates with your page’s audience as you grow. The findings here can inform future LinkedIn content strategy.
Besides the overall engagement rate over time, it’s helpful to break down the engagement rate across individual posts to see which posts performed well this month. For example, look at elements like:
- Topics: Personal stories and genuine employee appreciation posts do particularly well on LinkedIn
- Formats: Compare engagement of text posts versus native video or document posts
Don’t stop at analyzing your posts too. You could check out what post formats or topics your competitors use to inspire your future content.
Video views
According to LinkedIn, native videos on LinkedIn capture attention and are 20 times more likely to be shared than other types of posts. Track video views (counts after people play the video for 3 seconds) to get a first sign of whether your videos resonate with your page’s audience.
Click-through rate (CTR)
A key metric for paid ads campaigns, click-through rate assesses how relevant your ad campaign is for your audience. Plus, it's a good indicator of your ad content's engagement. Useful if you’re A/B testing several ad creatives or copy variations and want early feedback on what’s working.
How do I know if I’m getting a good CTR for my LinkedIn lead generation ads? According to Metadata’s analysis of nearly $30m in LinkedIn ad spend, the average CTR on LinkedIn in 2021 was 0.67%. However, CTR also ranged from 0.32% to 4.40%, depending on the offer, creatives, or target audience.
That’s quite a wide range, so use these numbers as a starting point, then benchmark your CTR as you run more LinkedIn ad campaigns.
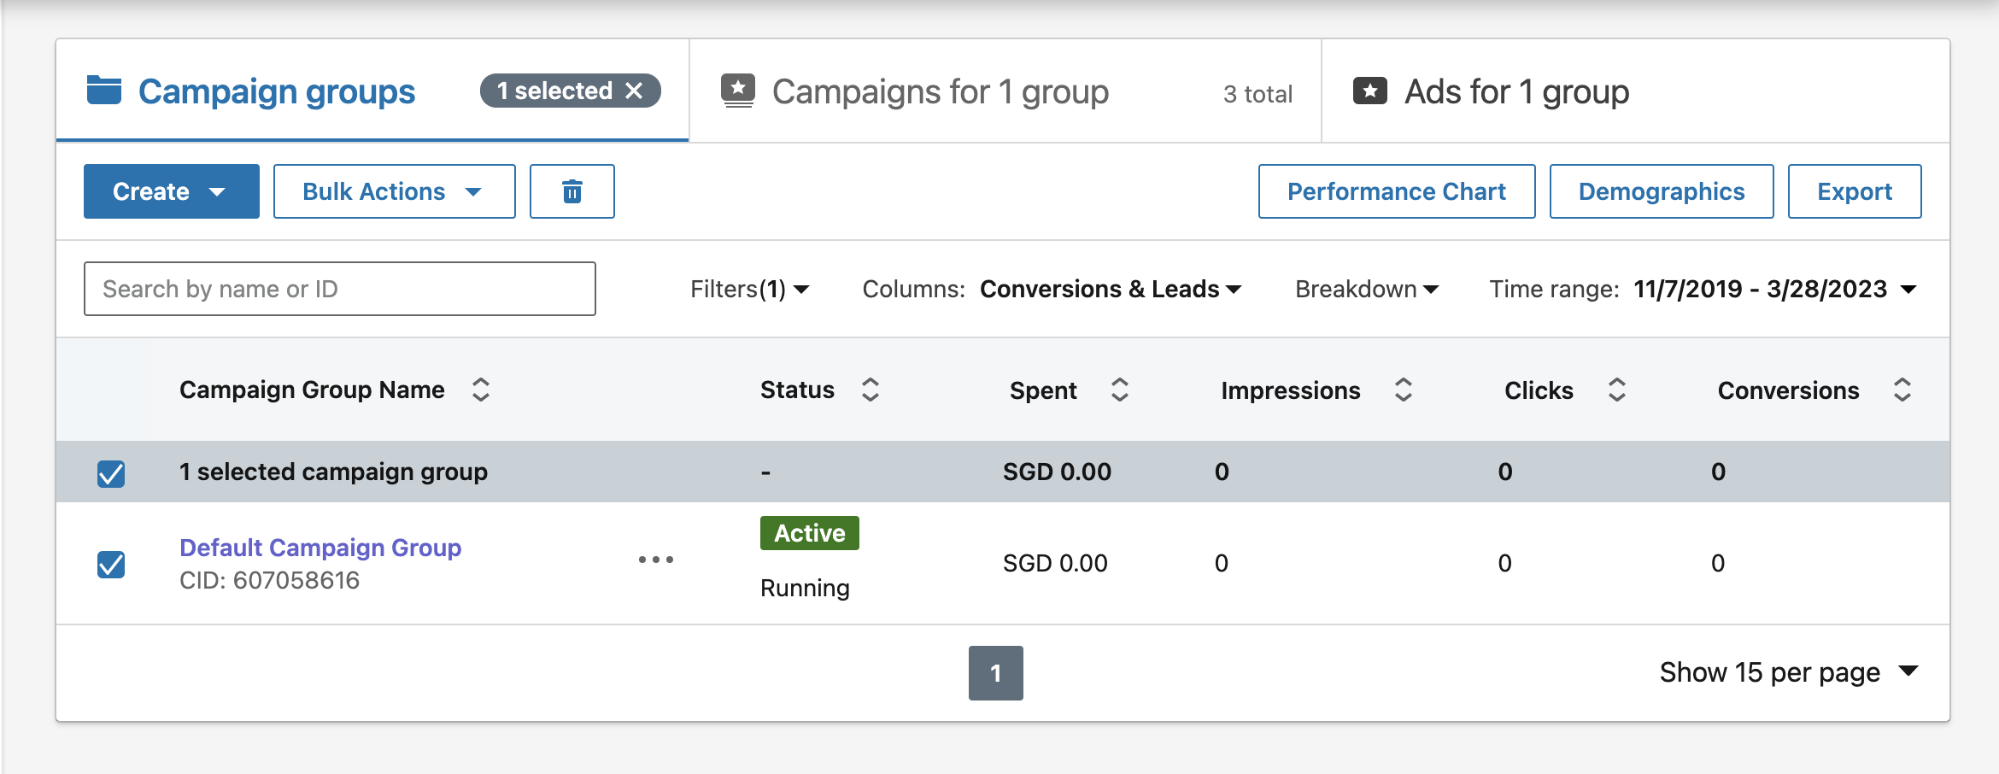
Paid campaign performance metrics
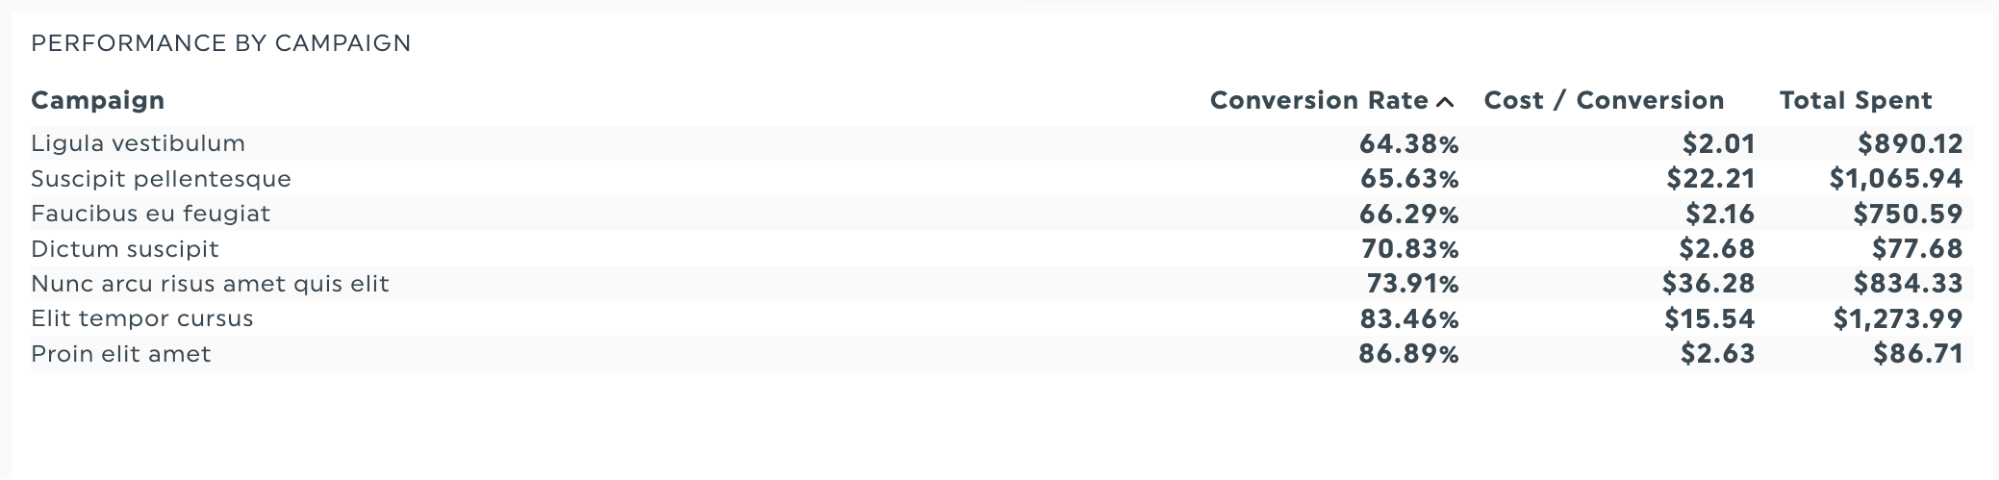
This group of metrics measures the effectiveness of your paid LinkedIn campaigns, including engagement, cost, and overall conversion rates/contribution to revenue:
Some key metrics to pay attention to:
- Ad delivery metrics: Metrics like impressions and average CPM show whether your ads deliver or work correctly.
- Conversion metrics: Conversion rates naturally differ across ad types and the offer you’re promoting. A personalized Message Ad generates higher conversion rates than a text banner ad.
- Ad efficiency metrics: Cost per lead, cost per conversion, and return on ad spend (ROAS) show how much you spend on your ad results.
How to track performance with a Linkedin KPIs report
Creating LinkedIn analytics reports from scratch is time-consuming, and reporting templates help free up your time manually producing reports. Use a reporting tool like DashThis to get complete visibility on your digital marketing performance for easy analysis
How to get started with DashThis in 5 simple steps:
- Sign up for our 15-day free trial
- Connect your LinkedIn account (we’ve got LinkedIn ads or LinkedIn pages integrations to make this easy)
- Select your metrics from DashThis’ preset widgets (or create your own custom widgets to visualize the data you need)
- Drag and drop as you desire
- Repeat this process as needed for the other social media platforms like Facebook, YouTube, and TikTok to get a complete picture of your social media efforts in one report.
It’s easy to share your newly-created report with your clients or stakeholders! We’ve got automated email dispatches and sharing via URLs to send to your clients in seconds.
Prefer a printed version? Export your report to PDF format for easy printing. More details on DashThis’s sharing options here.
Grab this Linkedin report template.
Get your LinkedIn business report with your own data here
Need to create a LinkedIn report fast?
Use our report template to track all LinkedIn metrics in an easy-to-read interface. We’ve included widgets and visualizations to make it easy to explain your metrics to your clients.
You can add notes and comments to your dashboards or widgets to provide more context or explanations for a specific data point or show your goal for a KPI. Helpful when explaining an unusual increase or drop in your data this week (or month).
Once you’ve created your LinkedIn report, save it as a template for future reporting to save even more time once the next reporting cycle comes around.
Automate your LinkedIn reporting with DashThis
LinkedIn has gone beyond being just a site for job seekers to becoming a key B2B marketing platform.
Automating the reporting process with tools like DashThis lets you focus on your clients instead of staring at your insights page each month. You’ll spend less time creating reports on LinkedIn engagement or ad campaigns and more time making informed decisions.
Which client wouldn't love that?

Start reporting on your Linkedin KPIs today!
Read More

Don’t miss out!
Follow us on social media to stay tuned!
Automate your reports!
Bring all your marketing data into one automated report.
Try dashthis for free