A Comprehensive Guide to Creating an Effective Social Media Dashboard

Social media has grown from a digital bulletin board to an almost all-you-can-do network.
Back then, we could only share life updates.
Today, it’s the first place shoppers engage with your brand, shop, and contact customer support. Remember that customer who ordered a silk chiffon pink dress but got it in neon green… a color you don’t even sell? Strange times.
Whatever the goal is, you need a social media dashboard to track your progress.
This guide explores its benefits and how you can create one automatically.
- Why Marketers and Business Owners Should Double Down on Social Media
- The Importance of Tracking Social Media Metrics in a Dashboard (Spoiler: It’s Not Only To Save Time)
- Top Metrics to Include in Your Social Media Dashboard
- How to Create a Client-Friendly Social Media Dashboard with DashThis
- Automate Your Social Media Reporting Today!
Grab this free all-in-one social media dashboard template with your own data!
Why Marketers and Business Owners Should Double Down on Social Media
Explore the biggest benefits of social media, along with some tips on making your favorite channels work.
Engage customers from start to finish
According to Hootsuite, there are over 4.74 billion people on social media—there are no better platforms with built-in audiences to increase visibility and foster connection.
To engage with your audience, take a page out of HubSpot’s Global Social Media Trends Report and create this content:
- Relatable content: Highlight your target audience’s struggles and desires (e.g., Instagram reel on how a busy executive built muscle mass with strength training)
- Trendy content: Share cultural moments and latest news (e.g., LinkedIn post or video about your brand’s unique take on the one-hit wonder app, Clubhouse)
- Educational content: Inform and teach your audience on solving a problem (e.g., YouTube how-to video on building an indoor garden)
Mix these different content in your social media strategy to grab customers’ attention across different journeys.
The how-to video on building an indoor garden? It’ll be perfect for consumers who want to build one but don’t know where to begin.
Drive conversions and revenue right away
Tremendous news for eCommerce.
In the same HubSpot report, 80% of consumers buy products directly on social apps more often than on brand websites or third-party resellers.
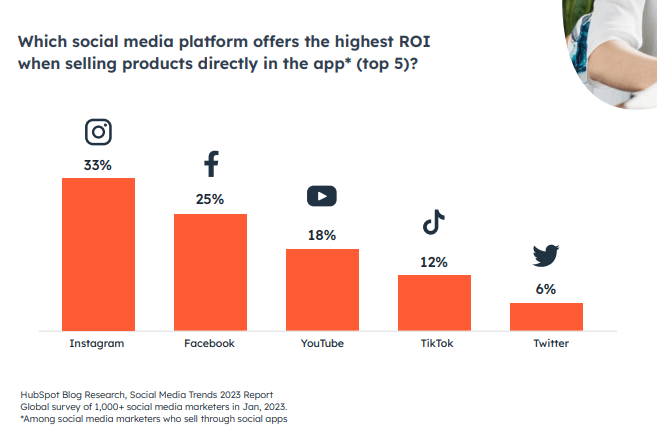
Source: HubSpot
Not only do Instagram and Facebook offer the highest ROI, but they also boast the most sophisticated social shopping tools
However, challenges persist.
Many consumers complain about the quality of goods sold, getting refunds, and buying from illegitimate companies.
Work on gaining consumer trust before swaying them to click the “buy” button. Invest in user-generated content (UGC) and testimonials to generate brand awareness and trust.
Support customers and gather valuable insights—two birds with one stone!
According to HubSpot's report, around 1 in 5 Gen Z, Millennial, and Gen X social media users have contacted a brand through DMs for customer service in the past three months.
Consumers want direct access to support via social networks, and brands that do this successfully win in the long run.
Note how Buffer addresses users’ concerns head-on on Twitter. The social media team and product marketer personally responded to a user’s tweet about an unwanted billing email.
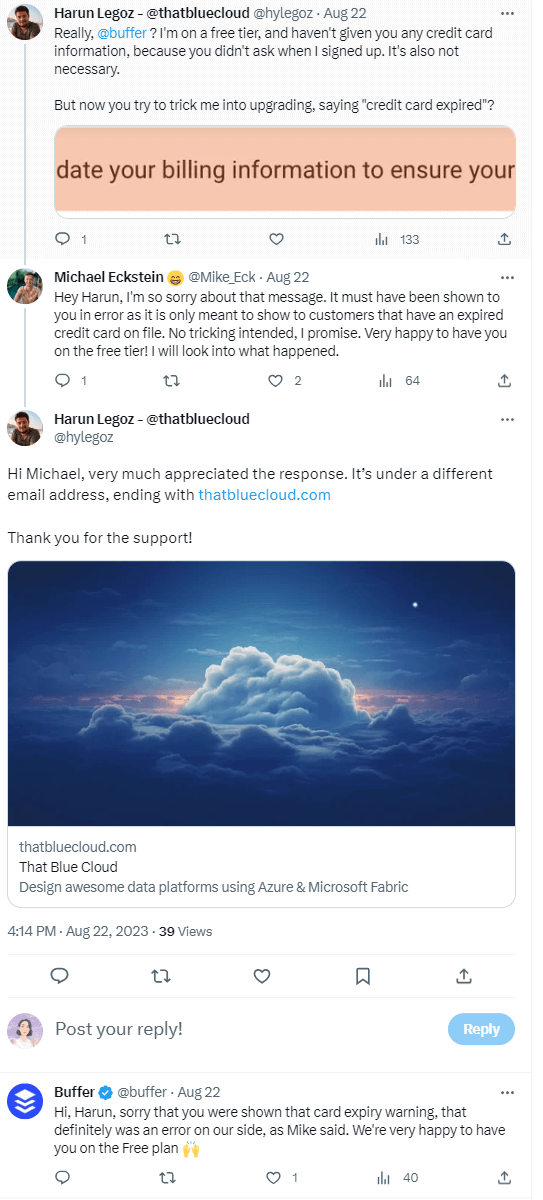
Source: Twitter
Putting customer inquiries in public display is intimidating.
But hey, here’s a different way of looking at it: when you acknowledge your mistakes, you reclaim control of the situation and show your full commitment to customers.
Buffer reinforces its reputation as a caring and customer-centric company with these two tweets.
If you want to use social media for support, ensure your social team is adept at handling inquiries—or, at the very least, can seamlessly route them to customer service.
And while you’re at it, gather these insights to improve the customer experience. In Buffer’s case, it’s reviewing the backend of the payment processing platform and transactional email sequence.
The Importance of Tracking Social Media Metrics in a Dashboard (Spoiler: It’s Not Only To Save Time)
By aggregating data from different social media channels into one central location automatically, you not only gain back hours of your time but also:
Assess campaign performance in a few clicks
Dashboards operate on a “set it and forget” mode.
Connect your data sources just once, and data will be overpopulated daily.
You no longer need to manually grab them and painstakingly distill insights from one channel at a time. This frees up hours* and opens up more space for critical marketing activities, like strategizing for the next quarter.
*No kidding, a client of ours went from at least 30 minutes each week per client to less than 10 minutes across their entire portfolio of clients.
Identify emerging trends before they take off
Data is only useful when you understand it.
Fortunately, social media analytics tools like DashThis offer a wide range of customizations to quickly make sense of your data.
Here’s how it looks when you adjust the data display settings on DashThis. From the chart type to display preferences, you only need a few clicks to communicate your marketing performance most effectively.
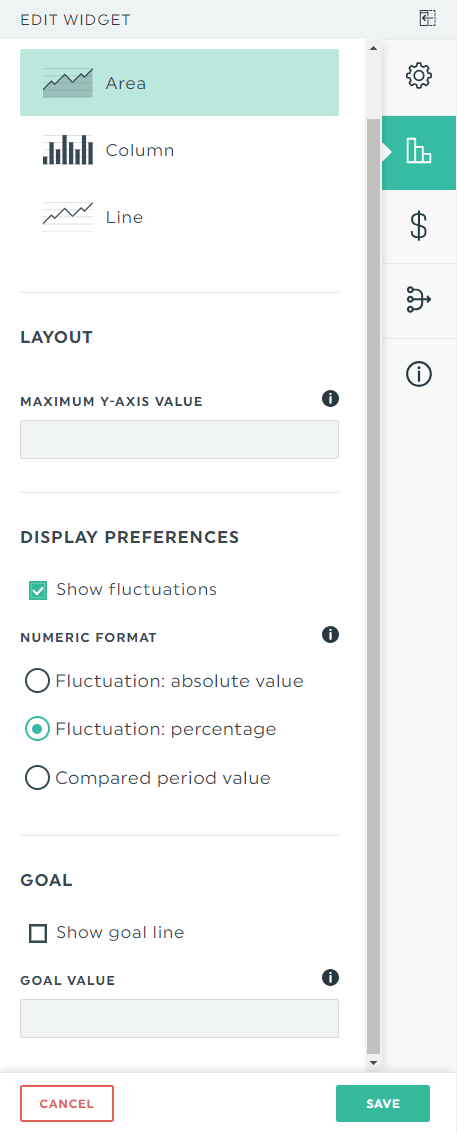
These granular visualizations make it easy to compare your social media performance across months (or years) and surface under-the-radar trends and opportunities.
Suppose you want to show a client how cheap it is to acquire a lead from warm custom audiences in your Facebook Ads. Simply customize the cost-per-lead (CPL) fluctuation format to show the percentage of points gained between the distinctive periods.
That’ll drive your point home.
Justify investments with cold, hard evidence
Social media dashboards act as “proof of worth.”
By clearly outlining your metrics across all social media accounts in one place—conversions, ROI, and whatnot—you prove your marketing efforts at a glance.
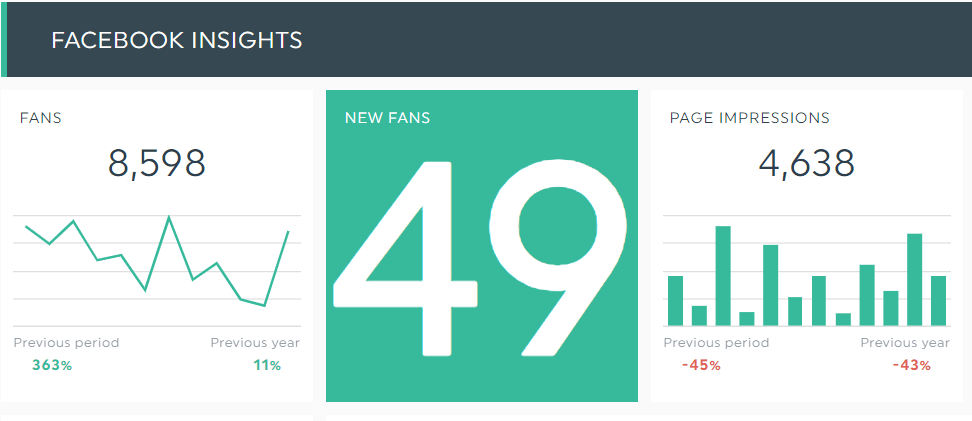
Note how you can go as far back as five years in this automated social media dashboard and analyze each period within seconds.
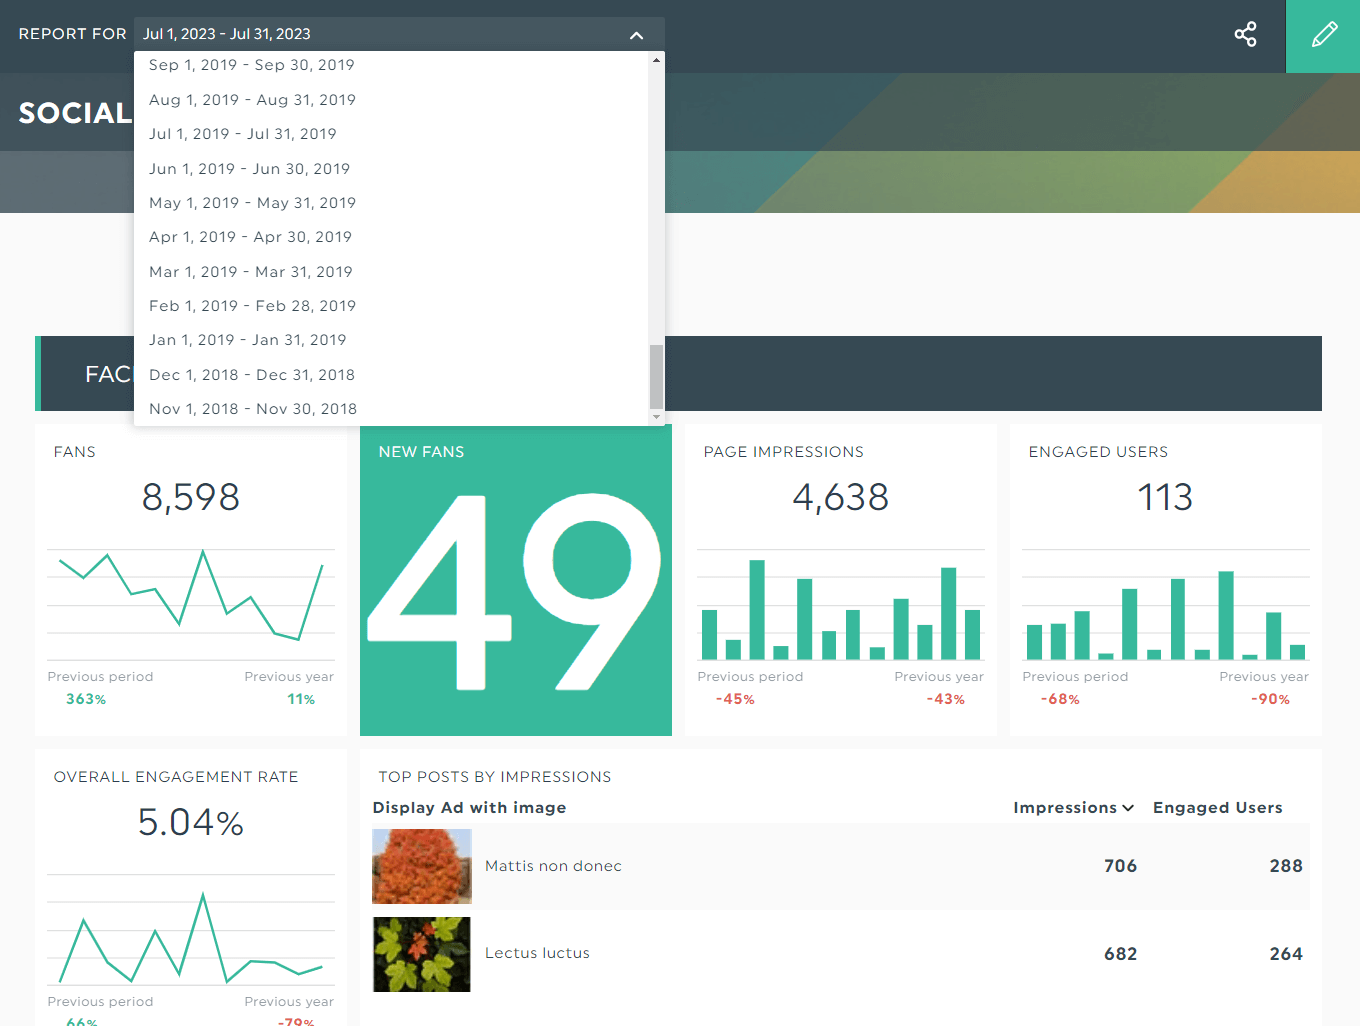
It’s helpful to have this data at your fingertips when contracts end.
With a report like this, you might present it on the big screen and say, “Since [year], we’ve grown the number of fans from 700 to 5,598, reduced our CPC from $7.89 to $3.59…”
It’ll reinforce the value your marketing agency delivers and help the client justify the investment to management.
Top Metrics to Include in Your Social Media Dashboard
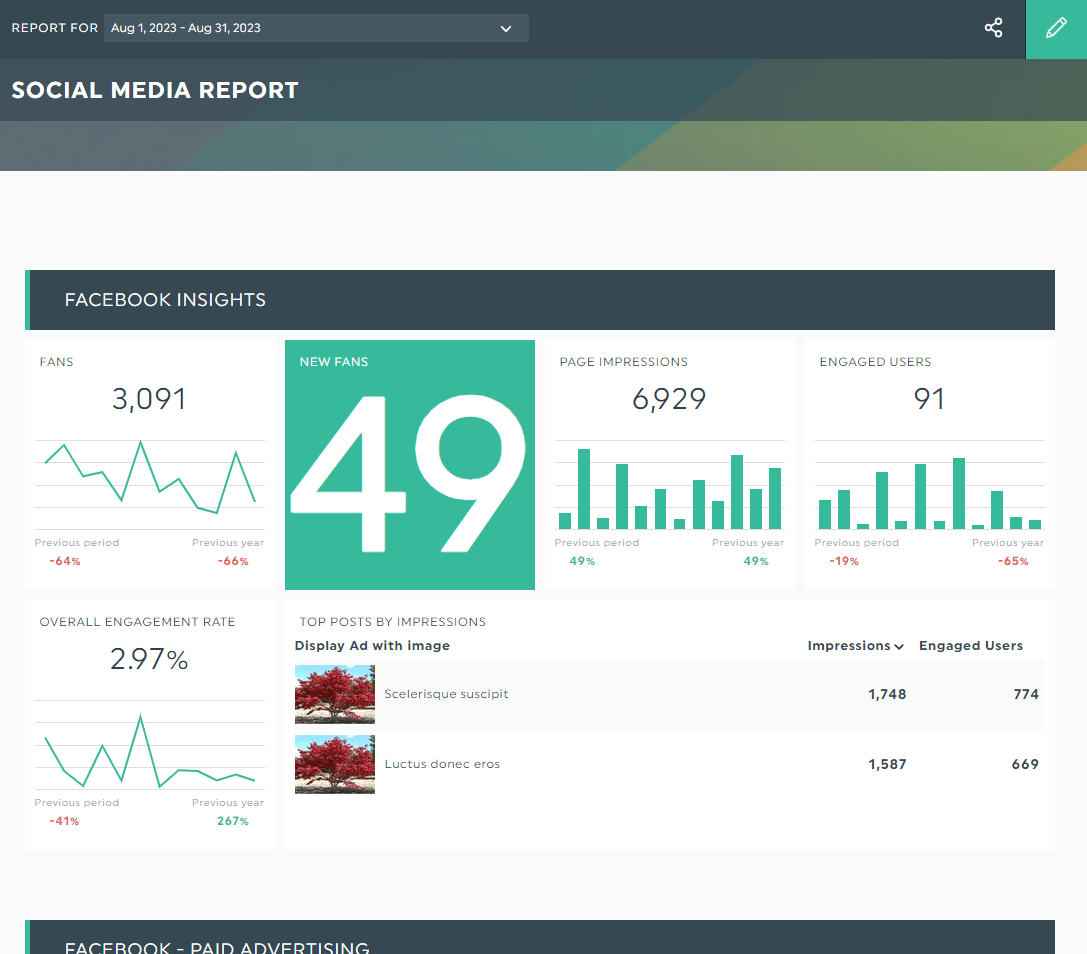
After setting the KPIs, you decide on the metrics to track your progress. This section recommends some of the most popular metrics and shows you how they look when you combine them to form a cohesive look.
Engagement metrics
Engagement metrics identify your best-performing posts and uncover customer sentiment.
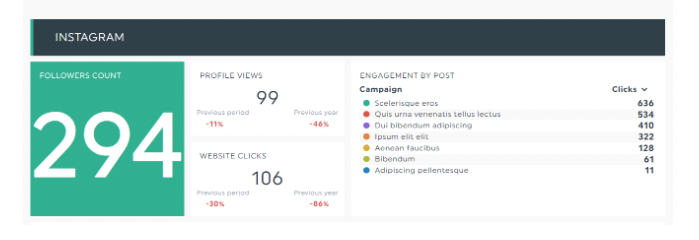
Note how the report above stacks up Facebook against Instagram. You can see within seconds which platform has better engagement.
Popular engagement metrics:
- Likes
- Comments
- Shares (including retweets)
- Branded hashtags
- Share of voice or mentions count (tracked on social listening tools like SproutSocial and Mention)
- Click-through rate (ads, website, profile)
- Overall engagement rate
Reach and impressions metrics
Evaluate the size and impact reached with these metrics. With this dashboard above, you can see if your Facebook page is growing according to plan.
Popular reach and impression metrics:
- Number of views (e.g., video, profile)
- Number of subscribers or fans (i.e., follower count or growth)
- Page impressions
- Impressions share
- Brand awareness (tracked on brand monitoring tools)
- Virality rate
Conversion metrics
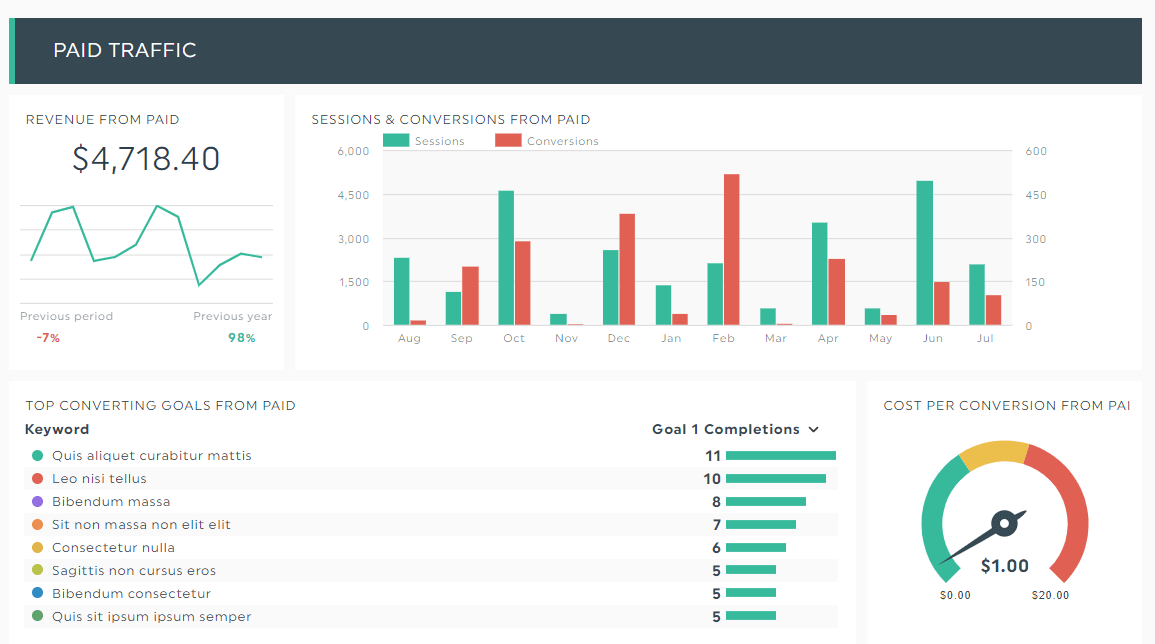
Conversion metrics calculate profitability, improve ROI, and determine if you’re making the most of your ad budget. This report gives you an overview of your paid traffic efforts.
Popular conversion metrics:
- Conversion rate
- Cost per conversion
- ROI per conversion
- Cost per click
- Cost per conversion
- Cost per thousand impressions
How to Create a Client-Friendly Social Media Dashboard with DashThis
You need a frictionless reporting tool like DashThis if you’re juggling multiple social accounts across a portfolio of clients.
Automatically gather data across your favorite platforms into one beautiful report. This saves you the hassle of manually grabbing them from one social network at a time.
Here’s how it looks like when you create a social media dashboard on DashThis:
- Select Social Media Report (or Social Media Campaign Report if you want to compare different periods)
- Connect your social platforms (note: DashThis also integrates with other data sources like Ahrefs and MailChimp)
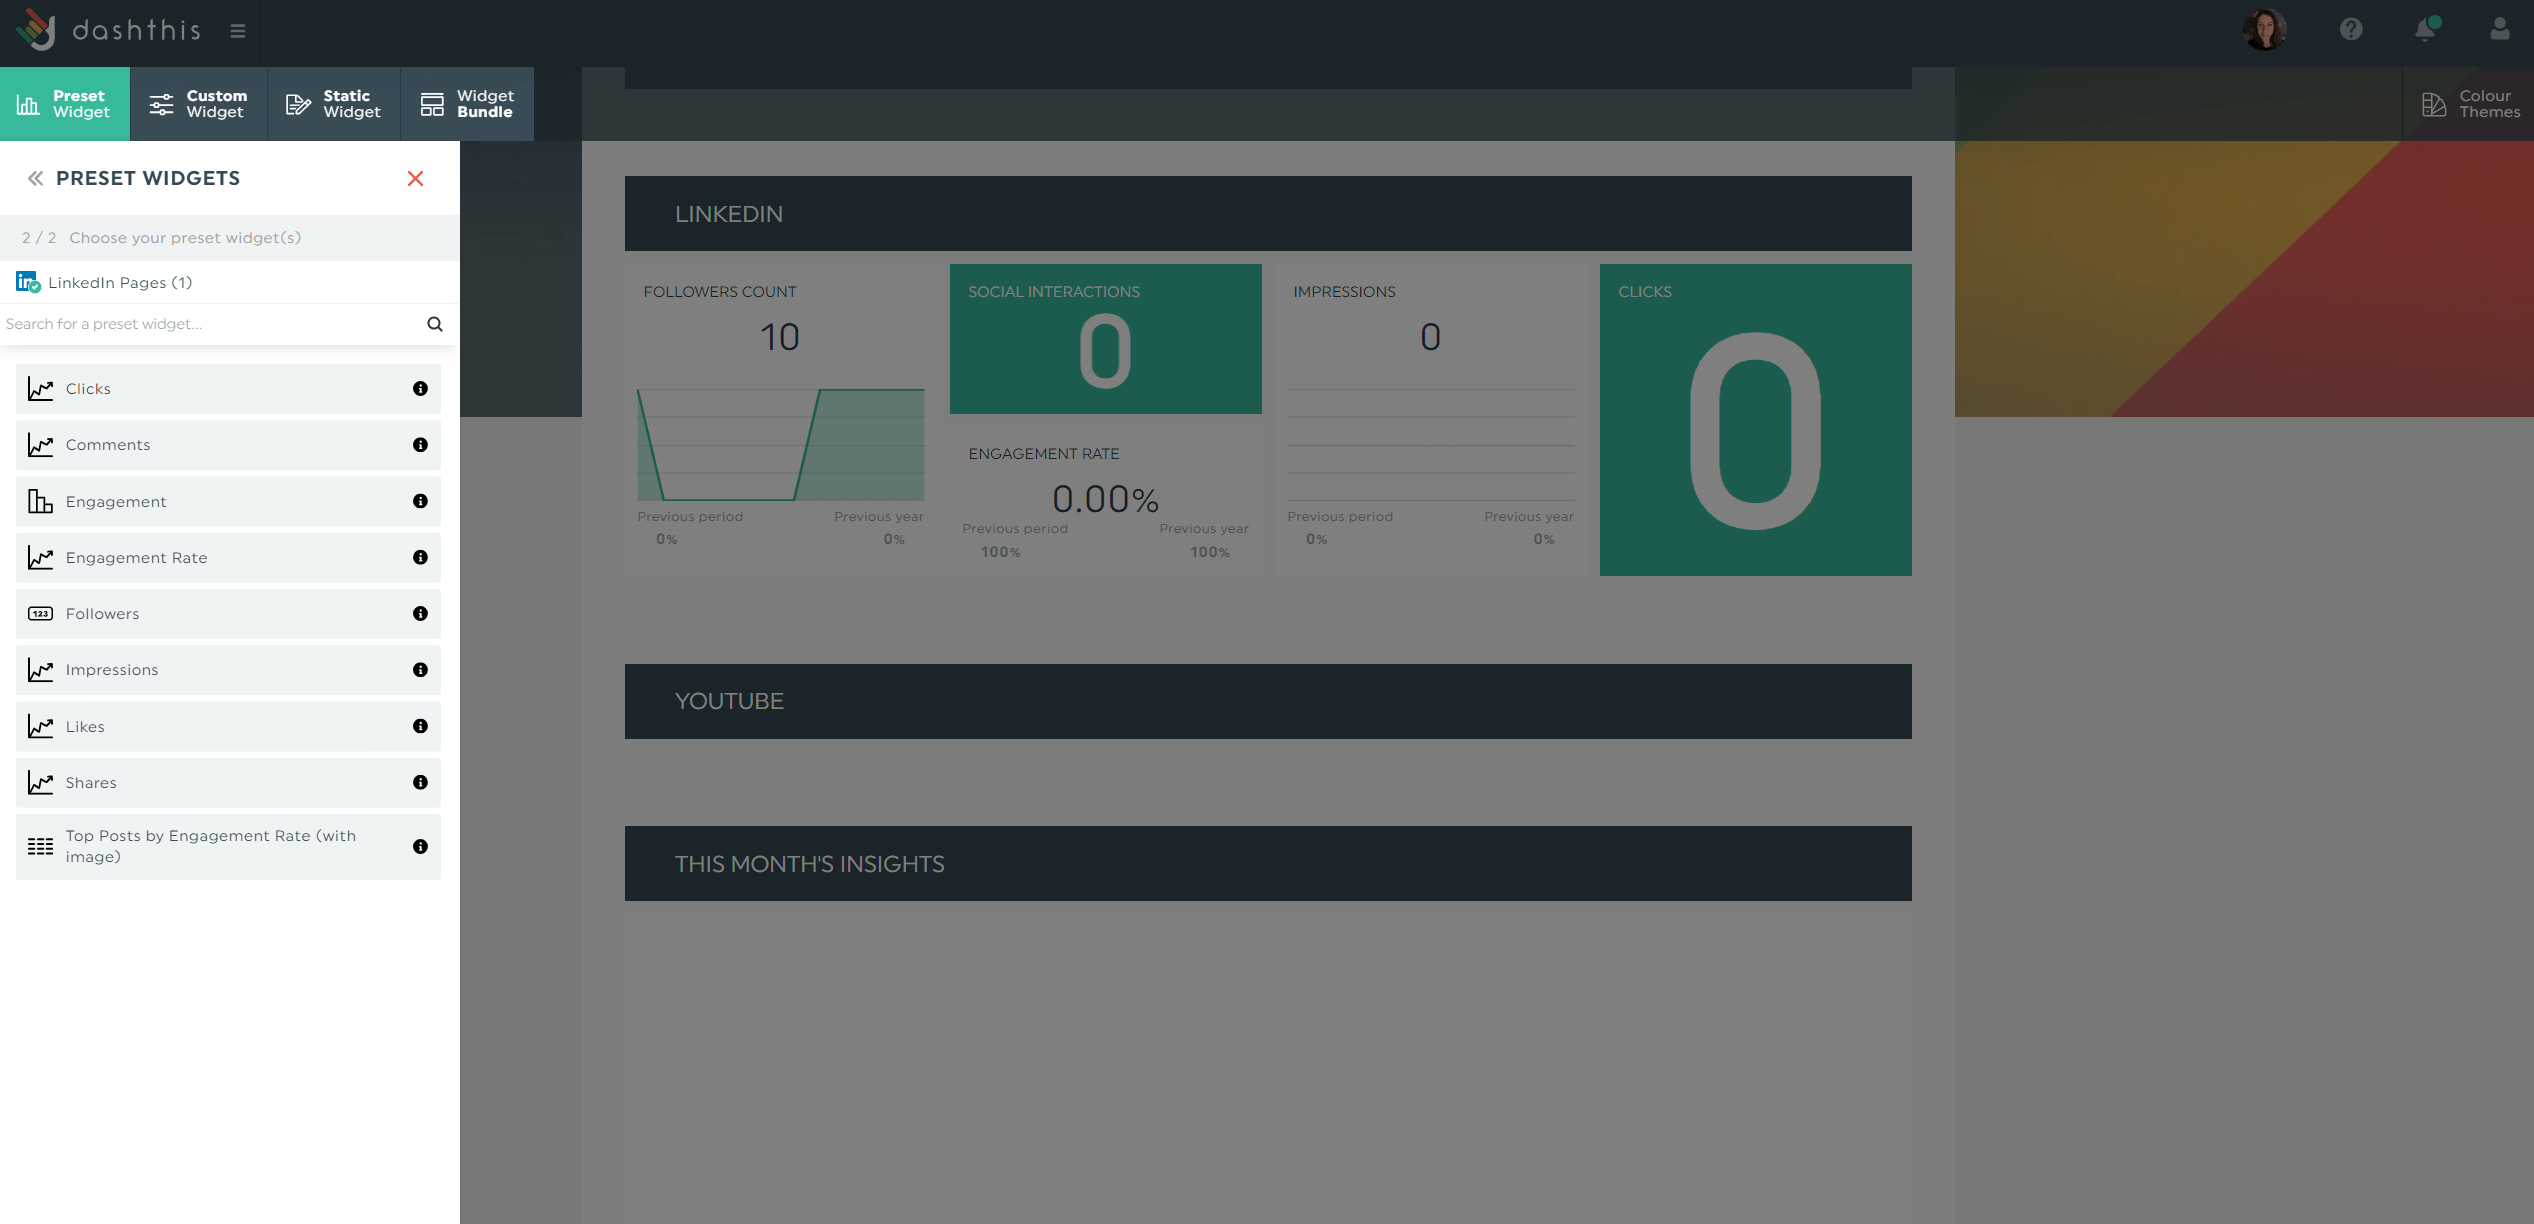
- Pick your key metrics in Preset Widgets
This social media dashboard template automatically transforms your data into graphs and charts. Drag and drop them as you see fit.
Separate different social accounts with headers.
Include snapshots of top-performing posts.
Add notes within the dashboard to combat FAQs from clients with zero marketing expertise. You can explain any erratic graph, patterns you’re seeing, under-the-radar opportunities, etc.
To do this, hover to a widget and click Add Note.
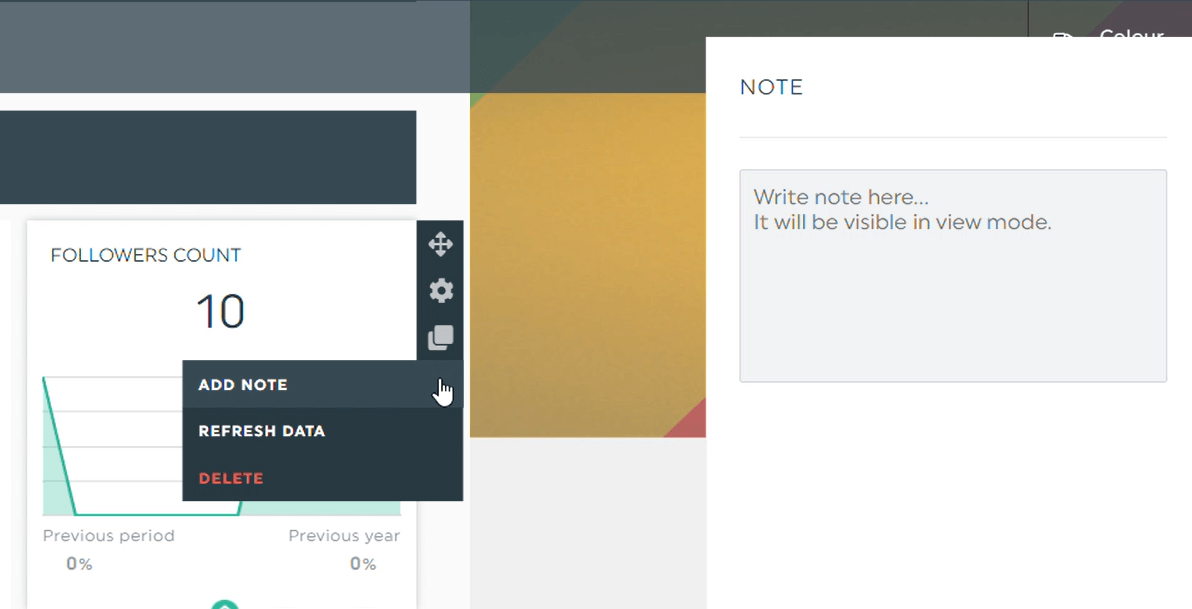
Share your findings and click Save (note: it will appear as an orange tab in view mode).
Once satisfied with the social media analytics dashboard, share it with the client and marketing team via an automatic email dispatch.
Click the Sharing Options icon > Share by Email. You can select the recipient, message body, and preferred reporting frequency here.
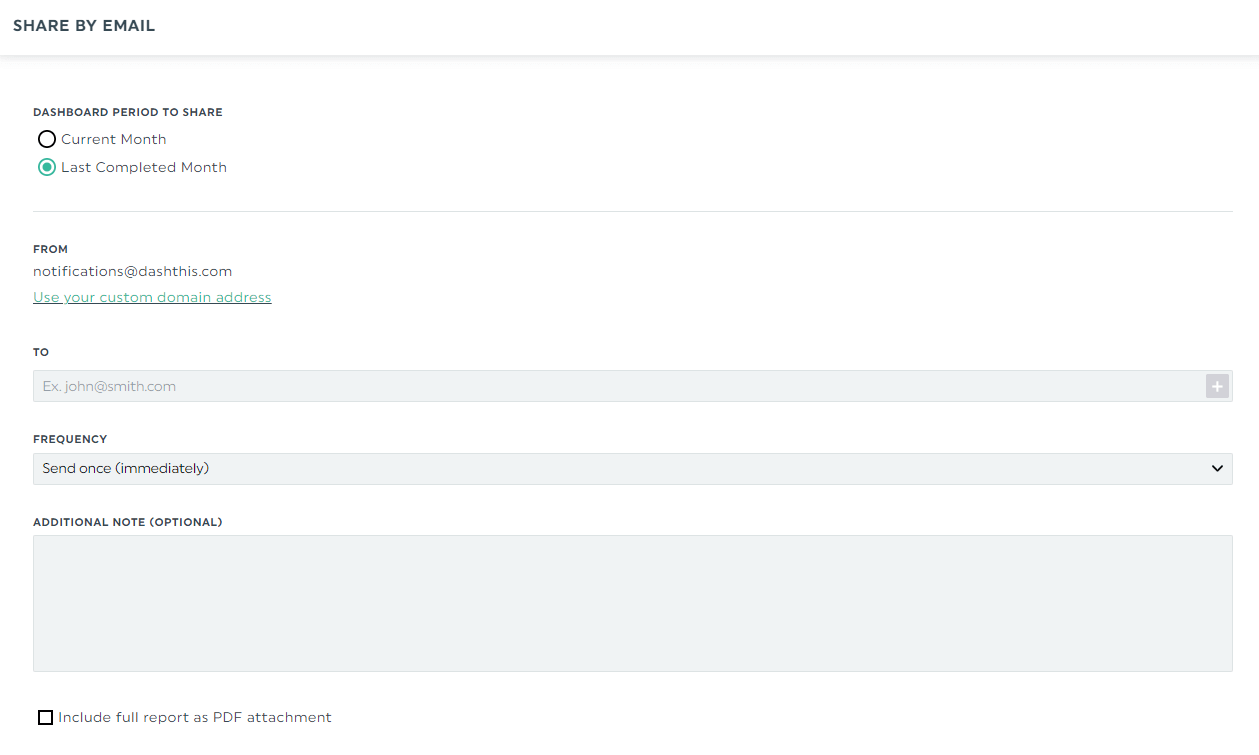
Alternatively, send a shareable URL link. Both sharing options let stakeholders view the report real time in different periods.
Run a full-service marketing agency?
Connect all your marketing channels—email, SEO, and PPC campaigns—within the same report.
This gives you a comprehensive overview of your holistic marketing strategy and helps you decide where to optimize and allocate your budget for social media marketing.
Automate Your Social Media Reporting Today!
Social media has grown from a personal bulletin board to a nearly all-you-can-do network.
Whichever way you use it, measure your progress with an automated marketing dashboard.
By gathering your data across multiple social media platforms into one central location, you assess campaign performance quickly, identify under-the-radar trends, and justify the investment to management.
DashThis is the easiest reporting tool that gathers your favorite social networks into one beautiful report. Pricing starts at $44/month when billed annually. Start your free 15-day trial today.

Ready to create a social media dashboard?
Read More

Don’t miss out!
Follow us on social media to stay tuned!
Automate your reports!
Bring all your marketing data into one automated report.
Try dashthis for free