The Right Signs: KPIs for Your Various Channels

It’s reckless to create marketing campaigns on a whim without considering your channel metrics.
Not only does this careless approach risk wasting valuable time, but it also eats up your productivity and profit margin. And yet, many marketers still rely on these “spray and pray” marketing tactics to target their prospective customers.
Today, let’s look at the 4 main types of channel metrics you should measure and how you can track them with a few clicks of the button.
- What are KPIs?
- Top Metrics for Your SEO Channel
- Top Metrics for Your Social Media Channel
- Top Metrics for Your Paid Channel
- Top Metrics for Your Organic Channel
- How to Choose the Right KPIs to Track?
What are KPIs?
KPIs, which refer to key performance indicators, are a set of channel metrics that determine the performance of your marketing strategy (e.g., how many leads generated for a new service, how far along you are at hitting the email marketing benchmarks in your industry)
There are primarily two ways to track your channel marketing metrics:
- Manual: Gather data from one data source to another and copy-paste the results into a spreadsheet
- Automation *Recommended*: Connect your marketing channels with a reporting tool with a few quick clicks and let it do the rest. These tools operate in a “connect and forget” mode.
In this guide, we'll focus on the latter.
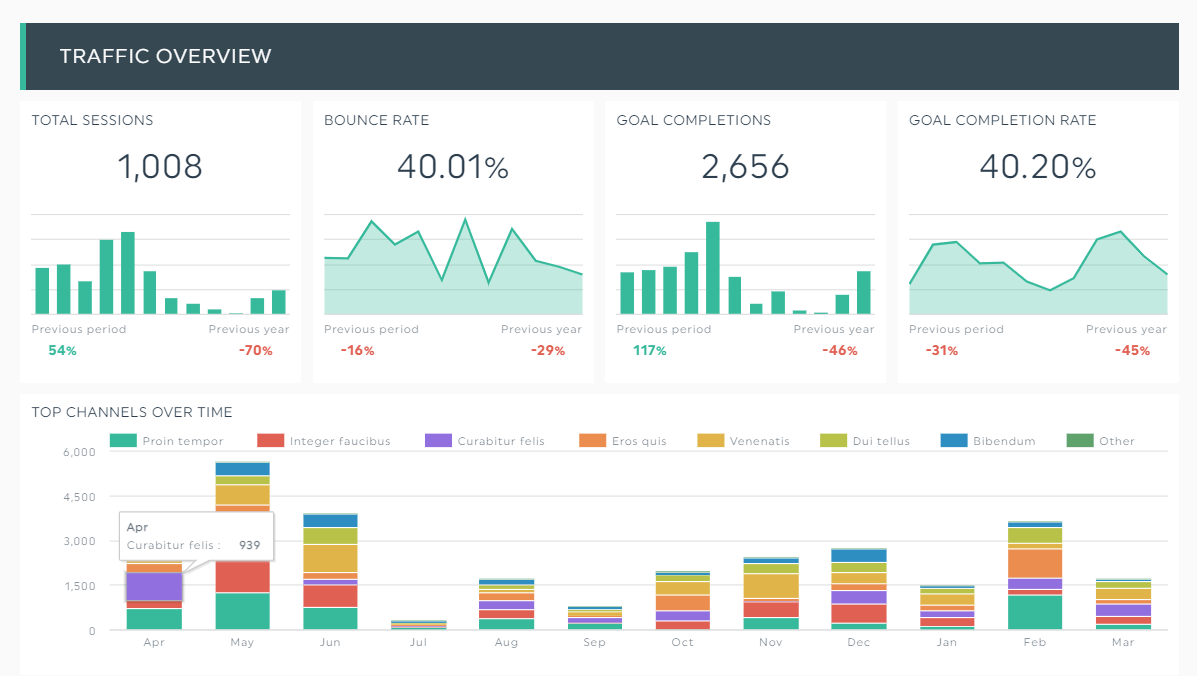
Here’s a stunning Google Analytics report created on an automated marketing reporting tool called DashThis.
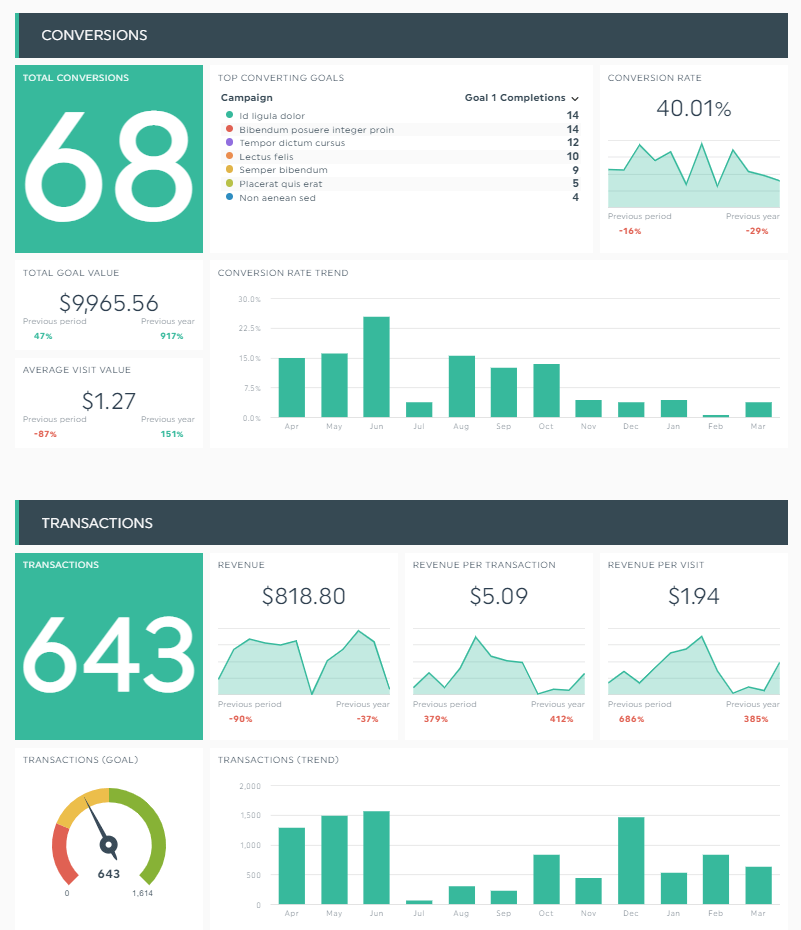
Grab this Google Analytics report template with your own data!
Notice how it shows the numerous channel KPIs that played a significant role in revenue growth.
Top Metrics for Your SEO Channel
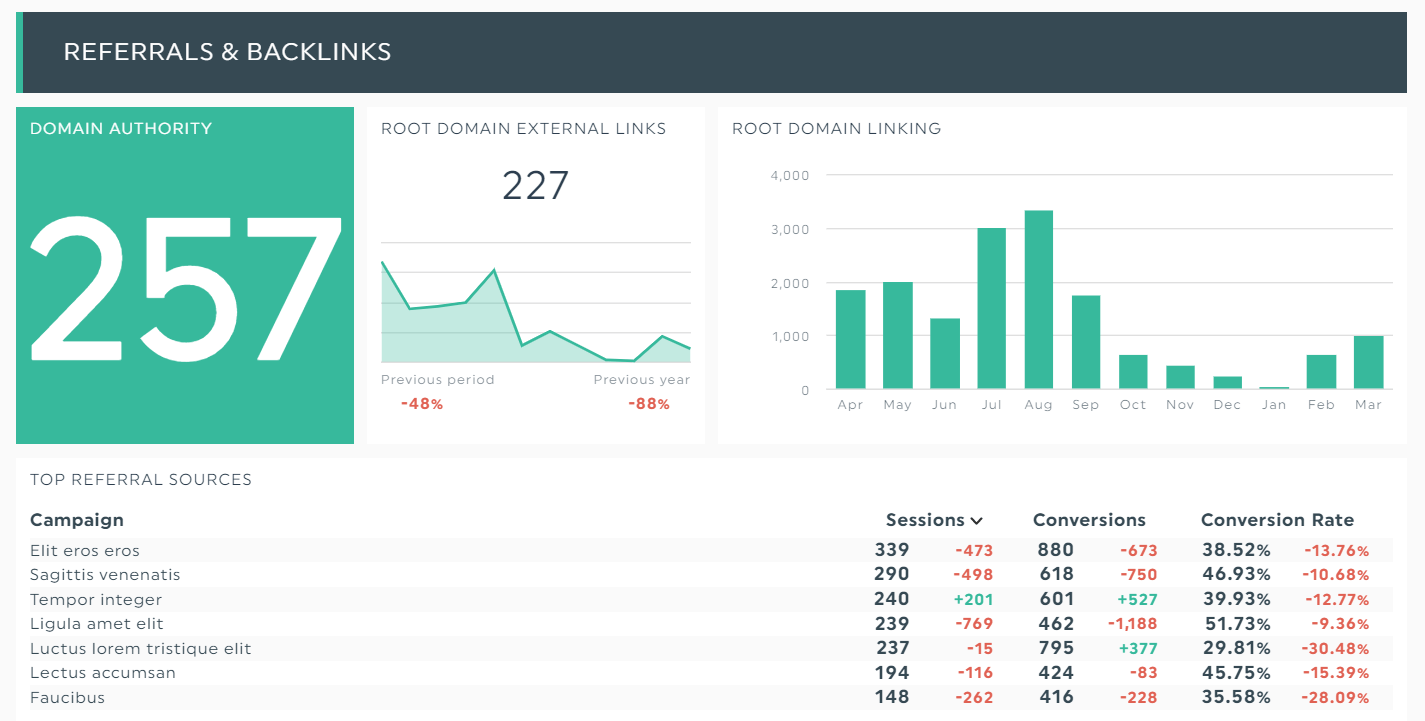
Grab this SEO report template with your own data!
SEO remains a popular content marketing channel despite the colossal time and resources it requires.
Fortunately, visibility, traffic, and brand loyalty make up for it big time.
Note the SEO report above that breaks down a website’s DA score, number of external links acquired, and most successful campaigns (i.e., top referral sources) according to the number of sessions and number of times visitors completed an action.
Focus on these channel metrics to ensure that you’re heading in the right direction.
- Backlinks: The number of external sites pointing to your page. The more backlinks you acquire, the higher your rankings on search.
- Keyword ranking: The position of your site on Google for a specific keyword. Optimize your content to reach the top spot. It's a lucrative prime estate for leads and sales.
- Average session duration: The average time spent per session. This important metric tells you how engaged your web visitors are on your site.
- Domain authority (DA): A search engine ranking score that determines the probability of your site ranking on the SERPs. The higher it is, the better.
Top Metrics for Your Social Media Channel
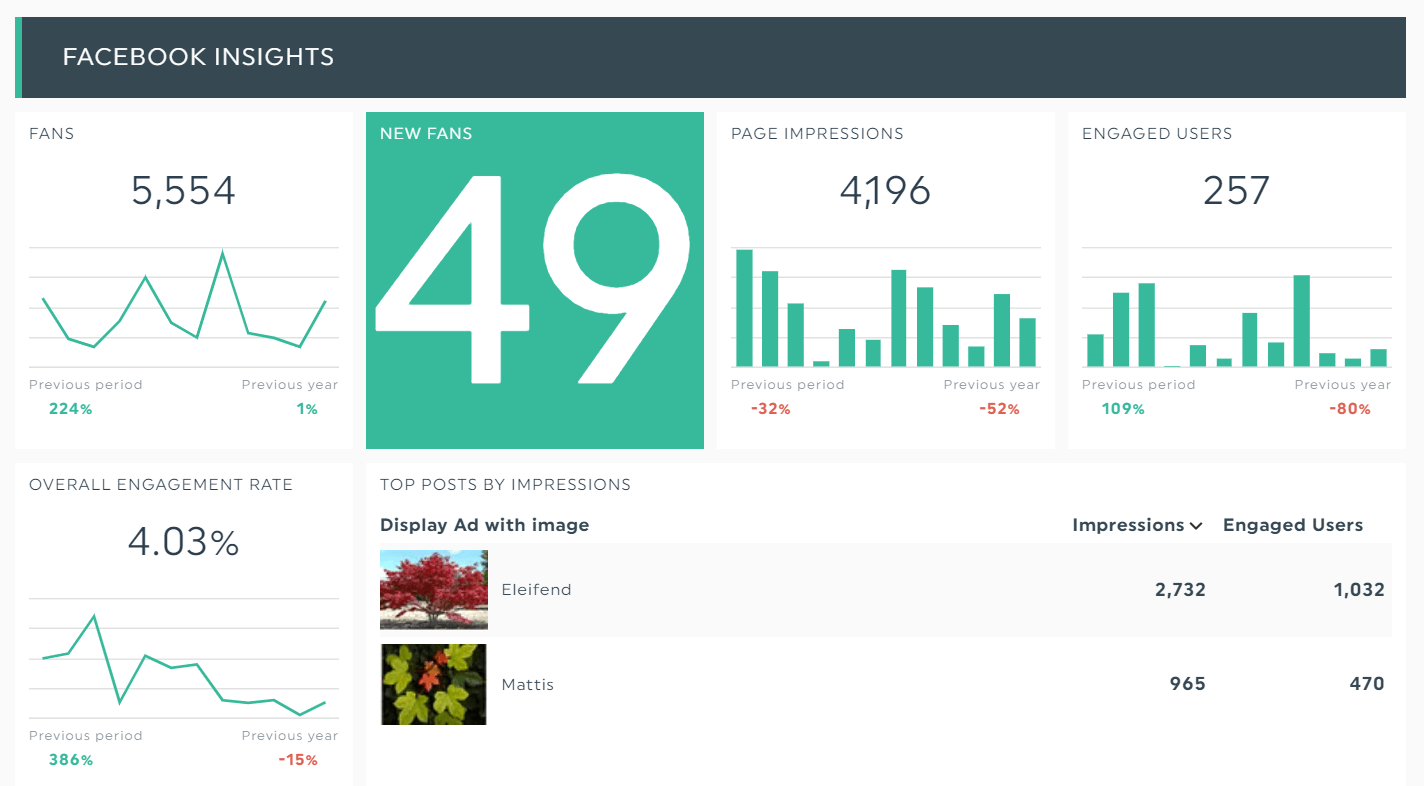
Grab this social media report template with your own data!
Marketing campaigns are incomplete without social media.
This powerful form of community promotion gets your content in front of your target audience without doing the legwork yourself.
Above, you’ll see a social media dashboard that combines Facebook, Instagram, LinkedIn, and YouTube data. Instead of individual reports, it conveys all essential social media engagement metrics in one place.
Common channel metrics for social media include:
- Top posts: A list of your top posts by reach, likes, comments, etc. Analyze this metric to find your best-performing content formats.
- Engagement rate: The average number of interactions received per follower. The higher the engagement rate, the higher the potential reach of your posts.
- Top mentions: A list of brand mentions. Measure your brand awareness and find out who’s talking about your brand.
Top Metrics for Your Paid Channel
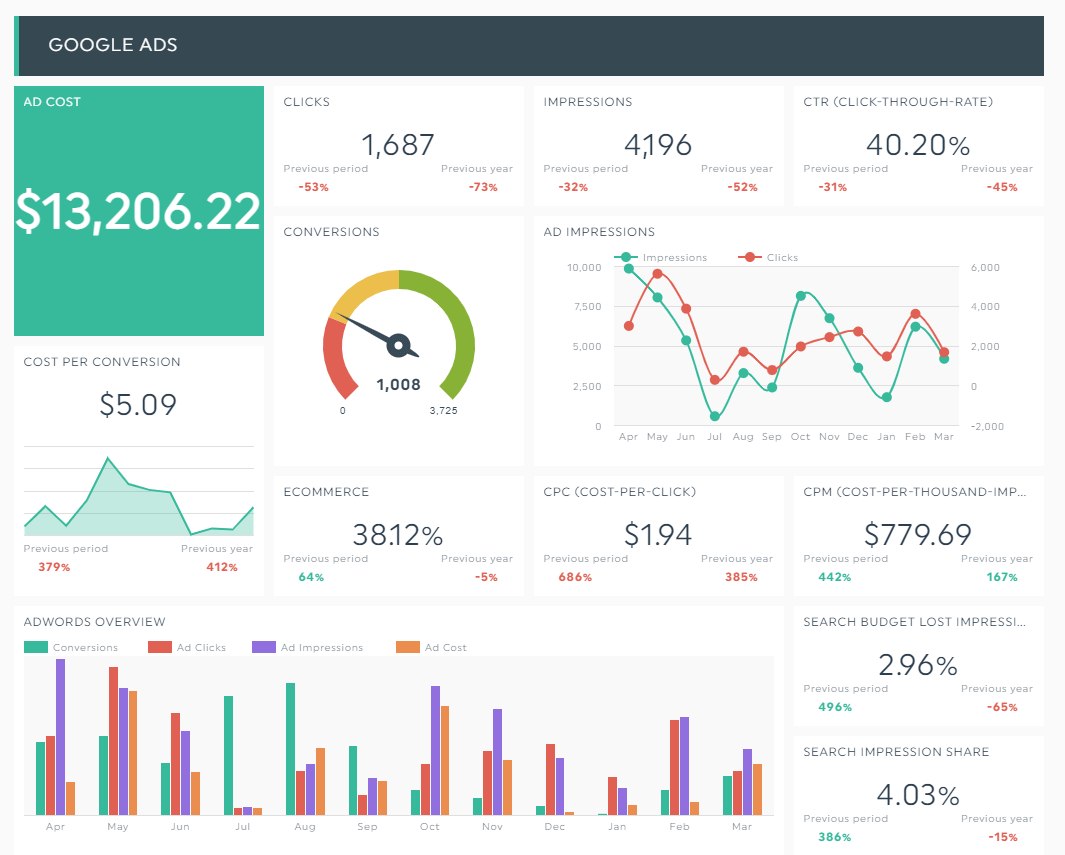
Grab this PPC report template with your own data!
Drive traffic to your site right away with paid ads.
Unlike SEO, paid channels get results in a shorter time. Use it together with SEO for a well-rounded marketing strategy.
Whether it’s attracting sales directly from your content or prospective customers in a lead generation funnel, these key metrics will get you started:
- Cost per click (CPC): The total cost of a click (i.e., whenever a user clicks on your ad).
- Return on ad spend (ROAS): The revenue earned from an ad or campaign. Use this channel metric to make sure your paid marketing efforts are paying off. You don’t want it to wipe out profitability.
- Impression share: The percentage of impressions your ad receives compared to the total number of impressions that your ad could get.
- Cost per acquisition (CPA): The total cost of acquiring a paying customer. Together with CPC, these metrics ensure that you’re getting the most bang for your buck.
Top Metrics for Your Organic Channel
Grab this digital marketing report with your own data!
In marketing, memorability takes precedence.
The longer time users spend on your website, the higher the odds of them becoming customers.
The digital marketing report from above, which marries organic and paid traffic, helps you gauge how users engage with your brand and the ROI of your overall marketing strategy.
Check to see if visitors are interacting with your site with these channel metrics:
- Unique visitor: A user who has visited your site at least once in the reporting period.
- Bounce rate: The number of users leaving your site after viewing one page. Beware of high bounce rates (unless it's a short landing page that requires visitors to complete a lead generation form). Aim for at least 40%.
- Conversion rate: The percentage of users successfully completing an action. It’s often measured with click-through rate to determine the effectiveness of web copy.
For better results, pair the channel KPIs above with sales metrics.
For example, if you want to measure the effectiveness of your sales enablement content or onboarding experience, measure the churn rate and number of leads acquired.
How to Choose the Right KPIs to Track?
At the end of the day, it’s dangerous to create marketing campaigns without digging deep into your channel performance metrics.
Select your KPIs with SMART goals (Specific, Measurable, Achievable, Relevant, and Time-bound) in mind.
Instead of a vague goal (e.g., “Grow client’s presence on Instagram”), a SMART goal reinforces business objectives and drives action.
Here's what we mean:
“Grow client’s Instagram followers by 30% (measurable) by 2022 (time-bound) as it’s the best-performing platform to attract direct sales for our F&B product (specific). We will do this by collaborating with micro-influencers under a budget of $100K (achievable). If done right, this exposure will tap into a wider audience and increase our followers (relevant).”
Using this actionable goal, you could decide on channel metrics such as CPC, CPA, conversion rate, mentions count, and engagement rate.
Next, start tracking these metrics on an automated reporting tool:
- Connect your marketing channels with DashThis
- Select a pre-made template or start from scratch
- Pick your channel metrics in Preset Widget
Sit back while our reporting tool grabs the metrics you chose automatically.
By gathering data from multiple data sources into one place, you get a holistic view of your marketing strategy.
Other benefits of using DashThis include:
- Scheduling your report automatically and sending it to your chosen time frame
- Customizing your report according to the client's brand colors and more
- Combining multiple metrics into one widget to show the overall performance (e.g., merging follower count for LinkedIn, Facebook, and Instagram)
- Adding notes and comments within your report to suggest next steps or provide more context for a metric (e.g., erratic graph)
- Sharing your report via email, URL link, or PDF
Busy marketers use DashThis to create multi-channel reports, gain back time, and create more value for clients.
Try it for free. It’s yours for 15 days.
Updated on July 2024. The original article was written by Sean Martin, marketing manager at Directive Consulting.

Ready to automate your reporting?
Read More
Don’t miss out!
Follow us on social media to stay tuned!
Automate your reports!
Bring all your marketing data into one automated report.
Try dashthis for free