What is a KPI Dashboard? Examples, Benefits and How to Build One in Minutes

How long until we see results from our marketing team?
How will we know our marketing campaign is working?
If you’ve worked in marketing for any time, maybe you’ve heard your CEO, a client or a team member ask questions like these.
Tools like key performance indicators (KPI) dashboards help define how you’ll measure progress toward business goals and confidently address these questions. This guide will show you how to build a marketing dashboard to help you make better decisions.
What is a KPI dashboard?
According to Forbes Council Member Steve Ohanians, “CMOs must navigate an intricate maze of consumer behavior, market dynamics and trends. And they expect their (agency) partners to join in on this process”.
CMOs and business leaders aren’t the only ones dealing with information overload. CMOs need agency partners to turn raw data into meaningful information to help them justify costs and optimize marketing spend.
That's where KPI dashboards come in to give you actionable information.
A dashboard visualizes your marketing data using graphs, charts and tables, providing a clear and concise view of the right KPIs relevant to a business objective at a glance.
Get this executive report template with your own data!
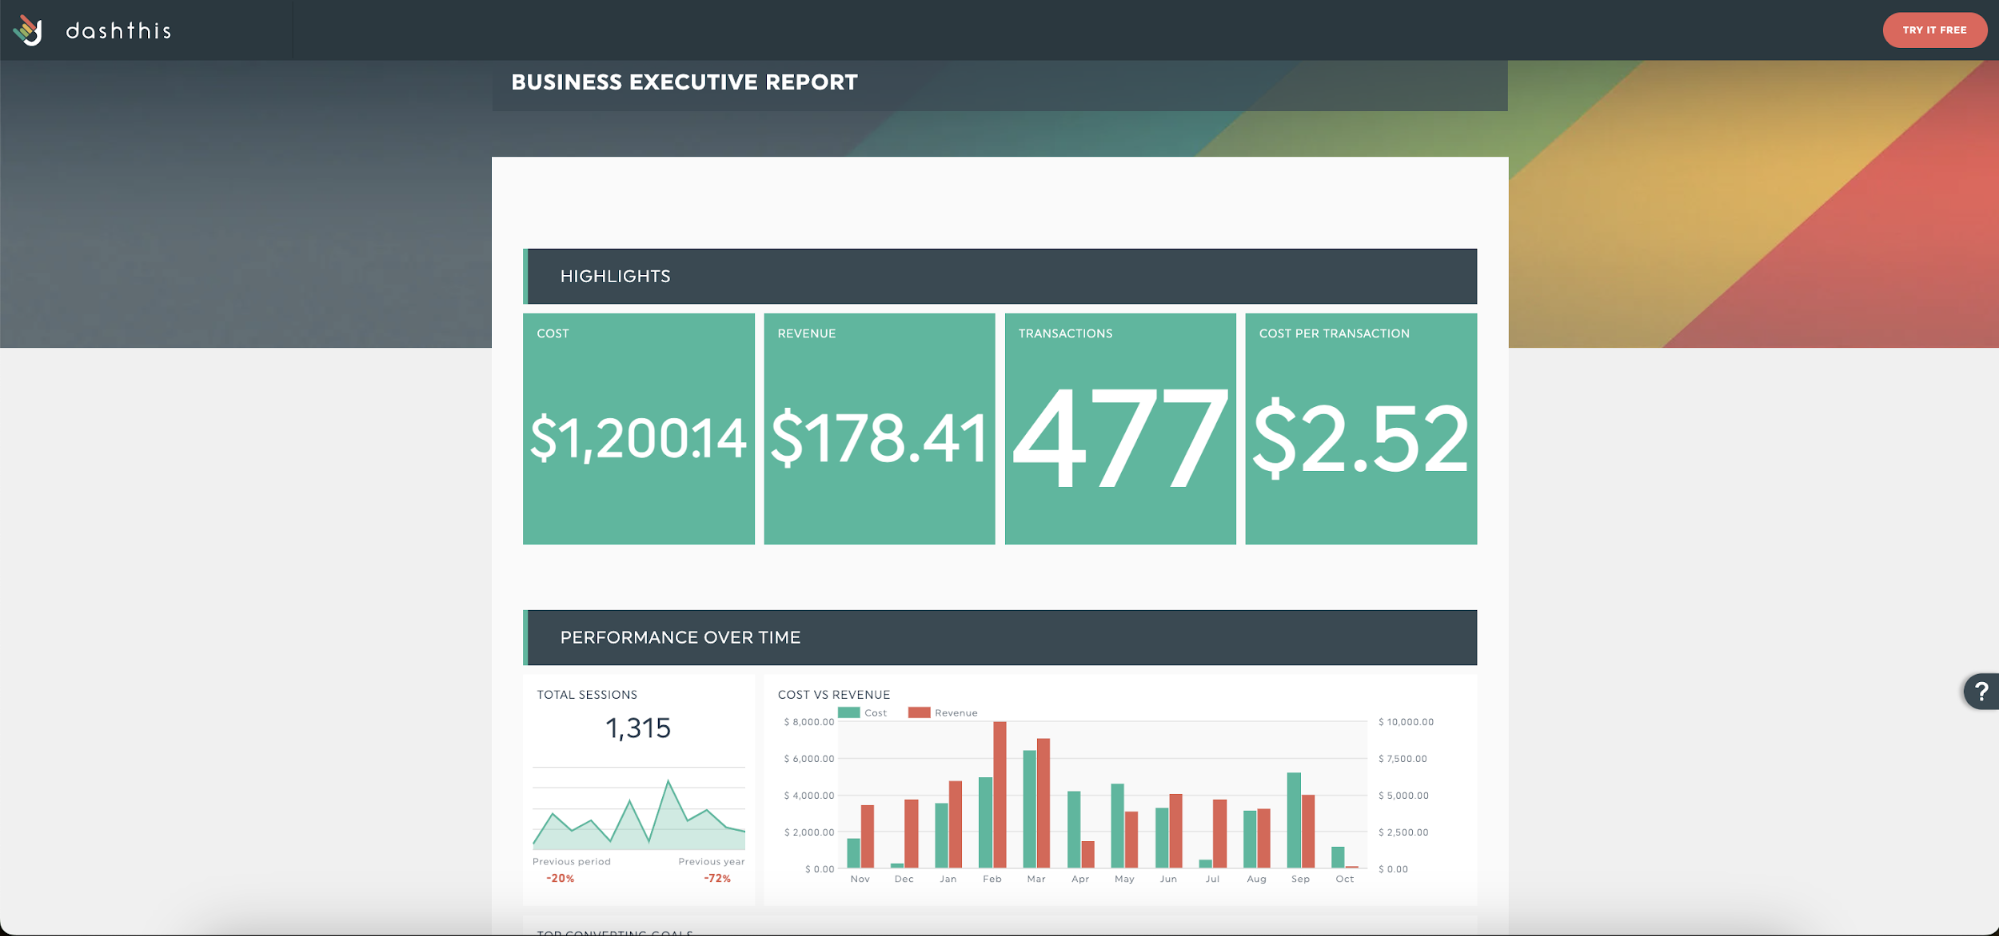
Say your company executive wants a weekly update on business metrics to make a product pricing decision.
Instead of sifting through business intelligence apps and data sets, you could send a link to DashThis’s on-demand executive dashboard with their financial KPIs in one place to review for business decisions.
Essential components of an effective KPI dashboard
1. Clear goals and relevant KPIs
Your marketing strategy, tactics, and reporting needs will differ depending on your company's goals and resources.
Hence, ask yourself who you are designing your KPI dashboard for and what they want to know.
A KPI dashboard for your CEO focused on understanding business financials, the latest profit margins and the marketing team’s performance differs from presenting the intricacies of an ongoing SEO campaign to an SEO specialist, for example.
We’re big fans of the SMART goal method for metrics analysis to narrow down a specific goal for your dashboard.
Once you’ve written a goal, pick 5-10 metrics to measure to ensure you’re heading in the right direction. Align your shared metrics with your department heads so everyone agrees.
2. Visuals and a layout that's clear and concise
Professional-looking dashboards aren’t only more effective at conveying information.
They also reflect well on your client reporting skills and your agency’s quality of work.
If you’re not an Excel or Google spreadsheet wiz, not to worry! Dashboard software like DashThis can help you create visually appealing reports with real-time data.
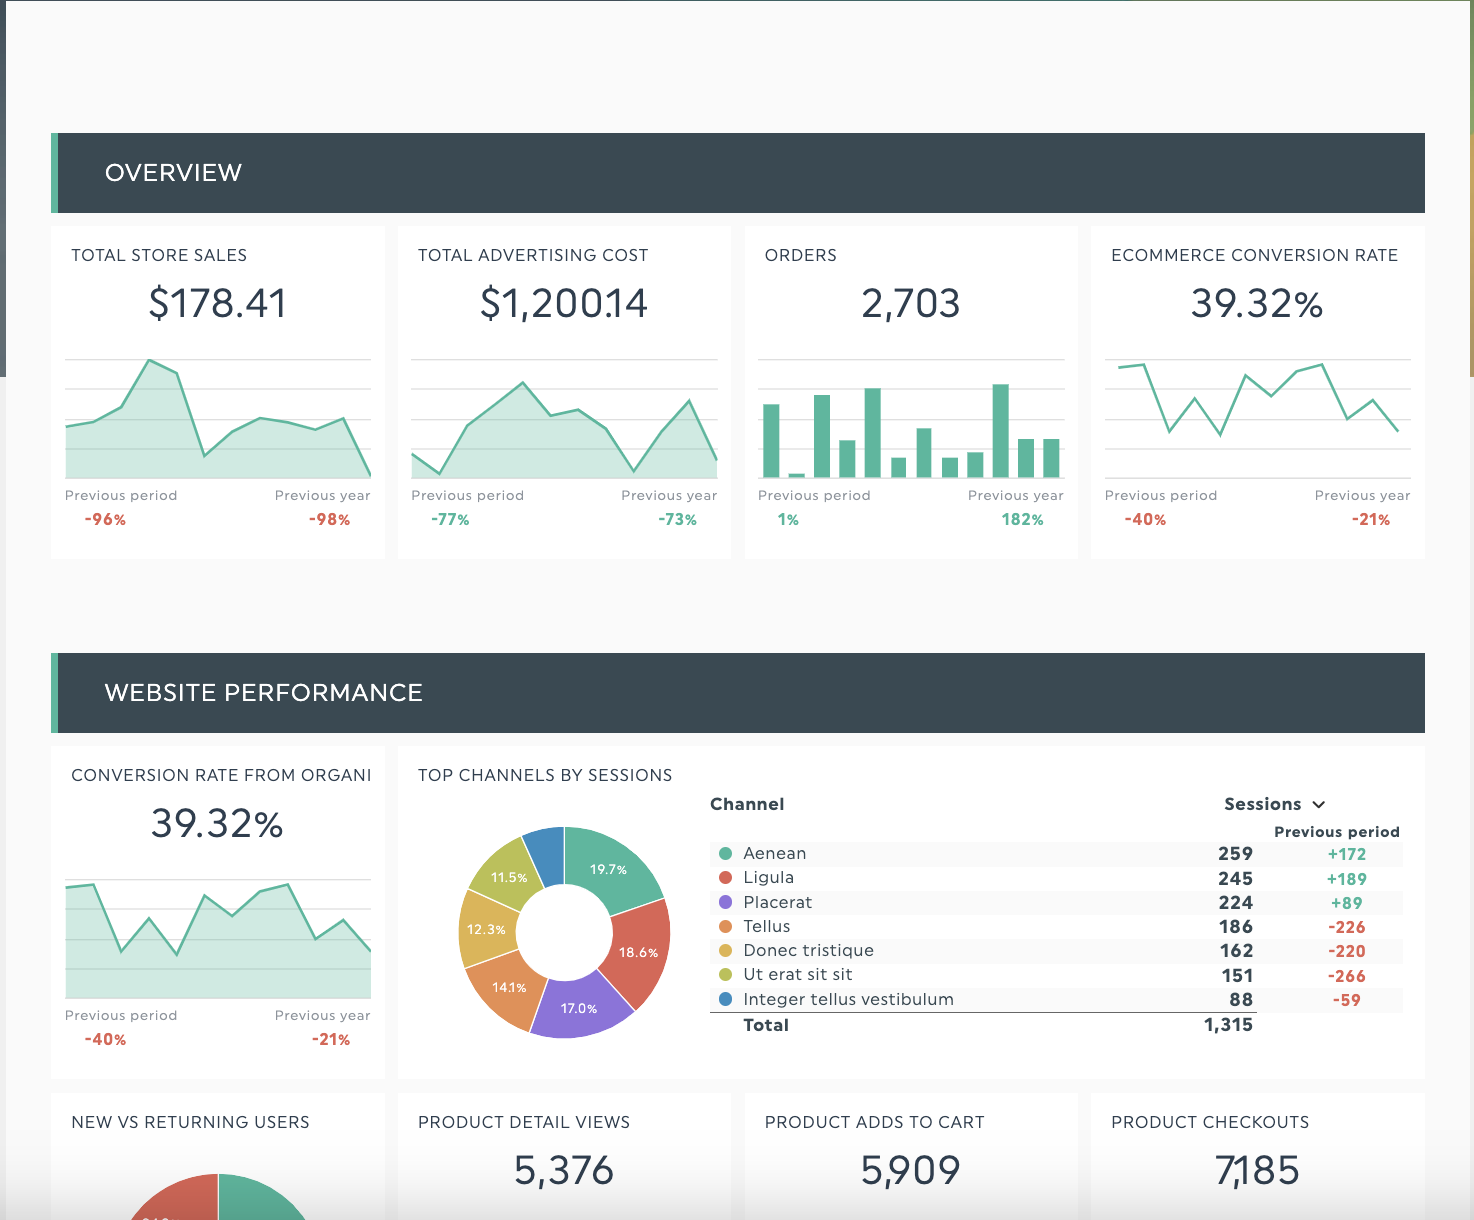
Get this e-commerce report template with your own data!
For example, our e-commerce sales dashboard keeps essential KPIs on the top with lower priority items and details towards the bottom. Color and section headers draw attention to different report segments.
Tip: Add a summary box or key takeaways further to aid retention for the sales team or merchandising team to follow your presentation or get top-level answers about how marketing is going at a glance.
More resources on dashboard design principles:
3. Explain contextual information with annotations
Sometimes, you need more than visuals to explain your data, whether it’s:
- Summarizing key results
- Adding contextual information like KPIs, observations or actions taken on a specific date
- Defining a term for easy understanding
DashThis offers two features to help your clients understand metrics' significance and implications: a comment box and adding notes to widgets.
To embed a comment box in your DashThis report, go to Static Widget > Comments.
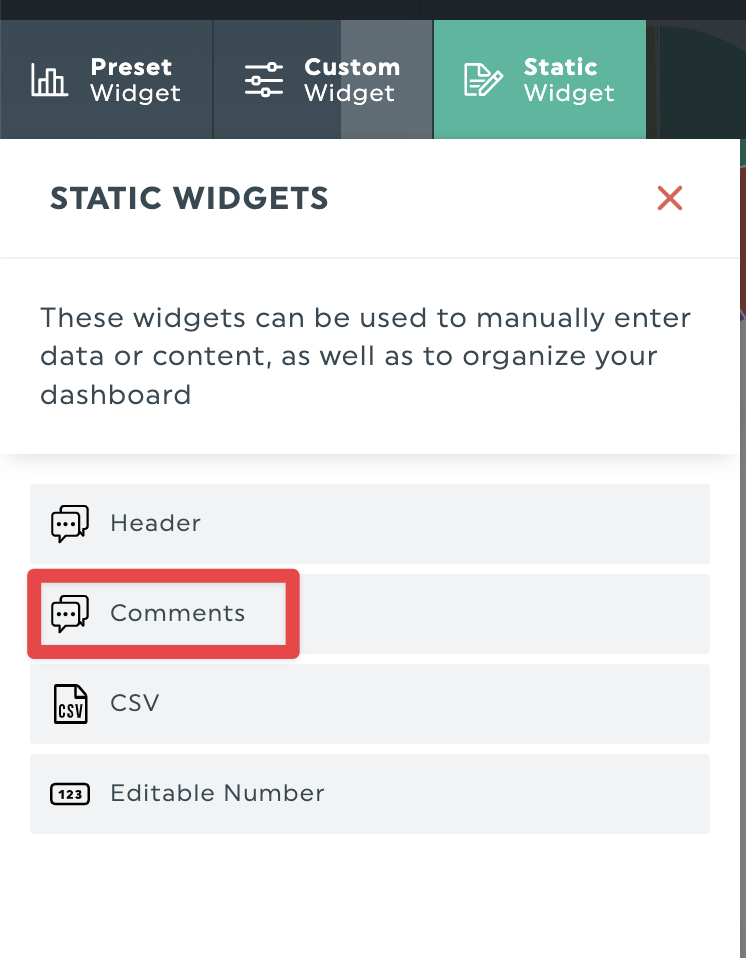
You can add high-level insights, like explaining this month's work, how your KPIs have progressed, or proposing the next steps.
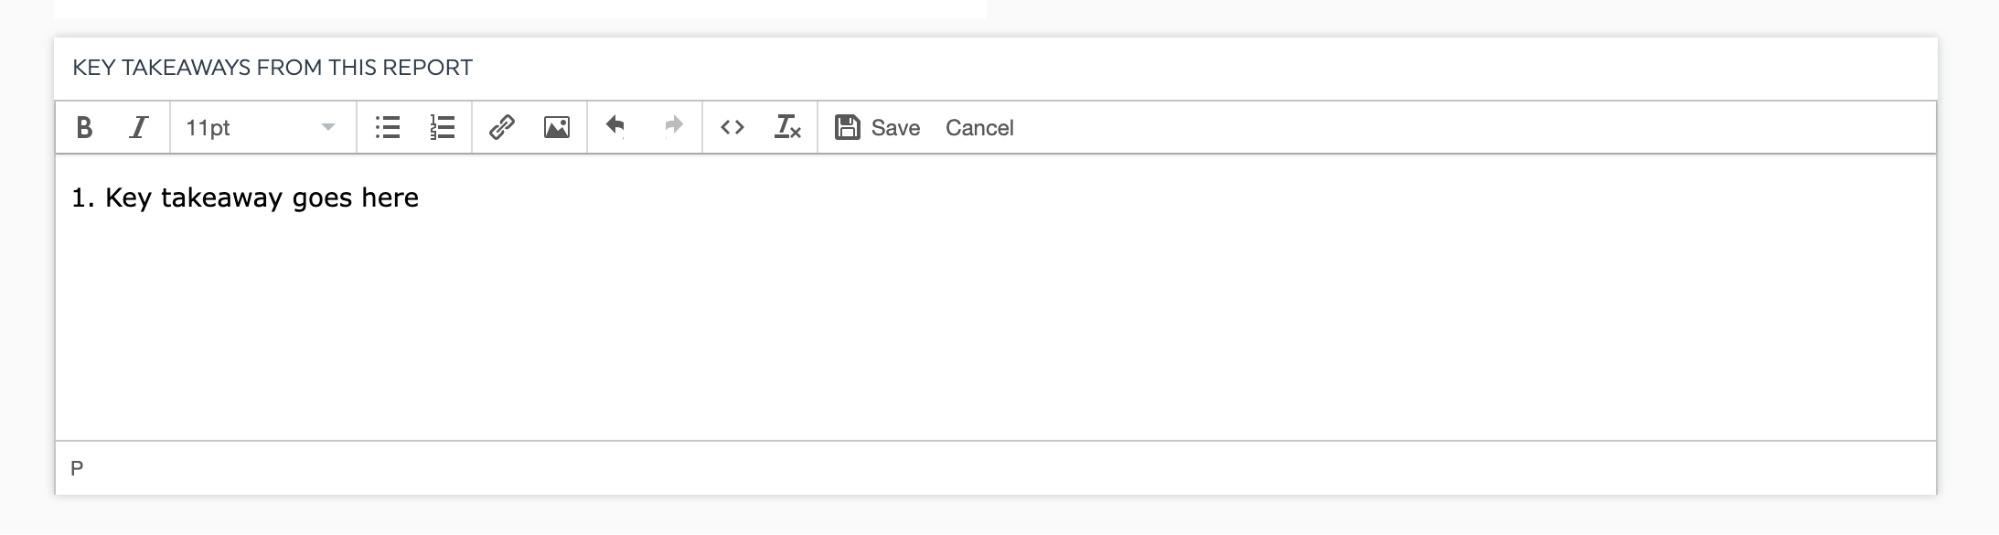
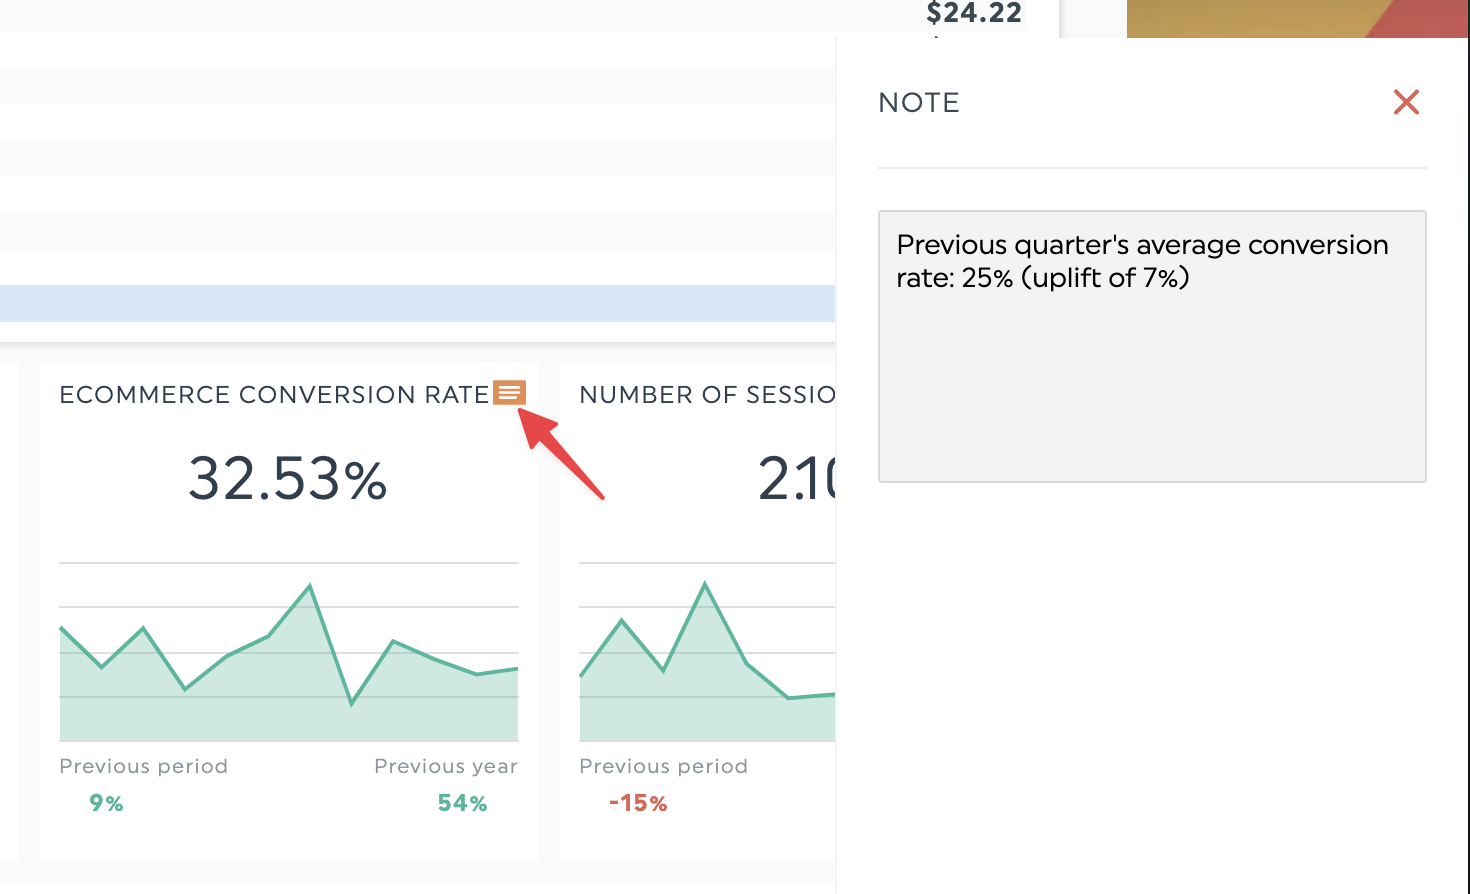
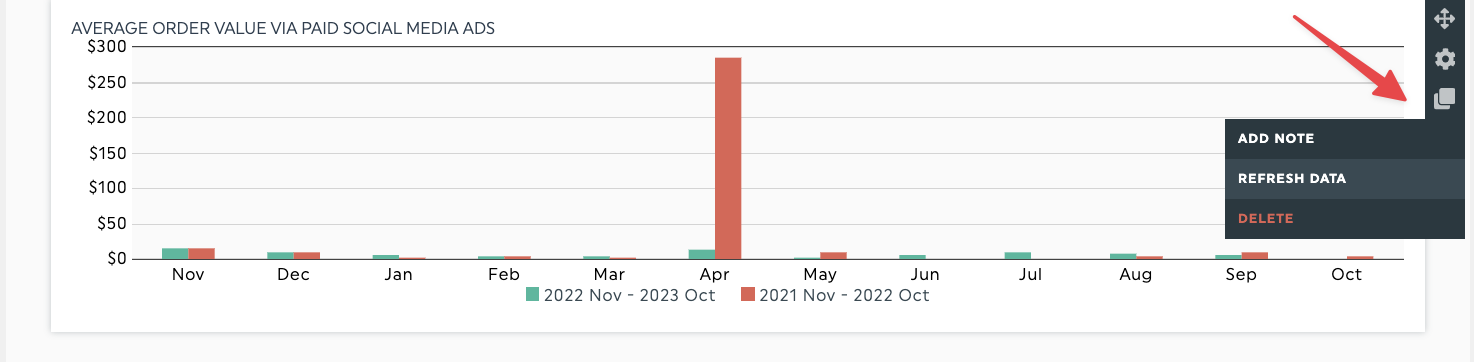
You can also add a note to a widget to explain each chart or add context.
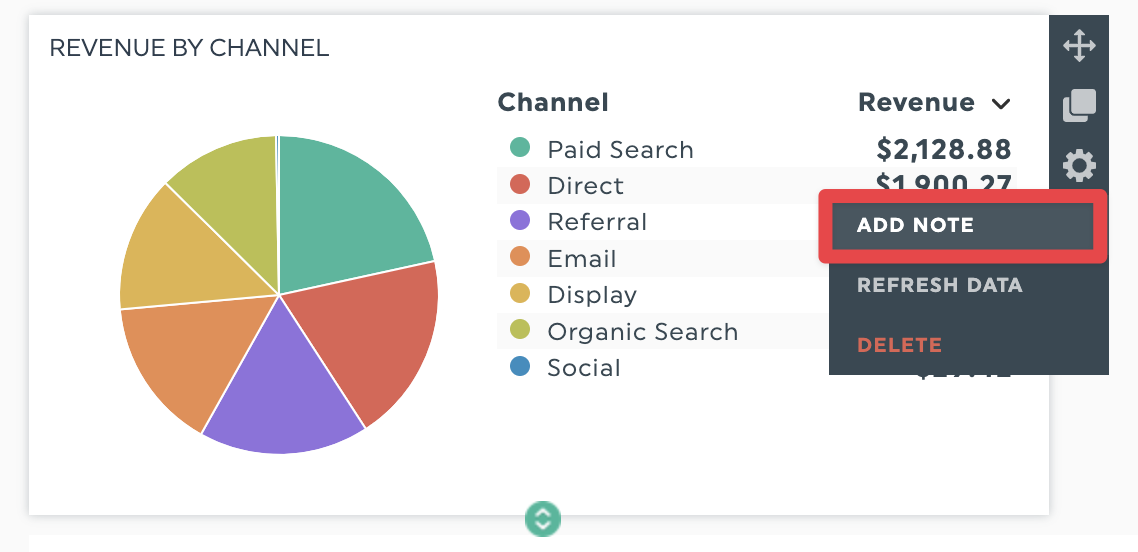
The added note will appear on the right side of your screen in a separate panel, accessible in view mode.
4. Updated data from all sources in a single dashboard
The best KPI dashboards ensure they work off updated data.
Who has spent hours redoing work after discovering you’ve copied and pasted data wrongly or made a formula error?
We’ve been there before, and to be honest, it sucks.
That’s why DashThis exists to save you hours copying and pasting data. Data in DashThis dashboards refreshes daily, so you can be sure you have the most up-to-date results when you open your dashboard.
You can even refresh data manually for specific metrics.
The benefits of using KPI dashboards
Improved data-driven decision-making
Working with marketing data spread across multiple tools is like working on a jigsaw puzzle with pieces scattered across different rooms.
You know you’re working towards a complete image, but you're wasting time moving between rooms and trying to make sense of disjointed fragments.
Working like this is frustrating and inefficient.
KPI dashboards have interactive data to drill down into your company's performance on specific months or compare metrics over time without creating a separate KPI report.
Zoom into the intricacies of your company performance on particular months or compare KPI metrics over time without creating a separate report.
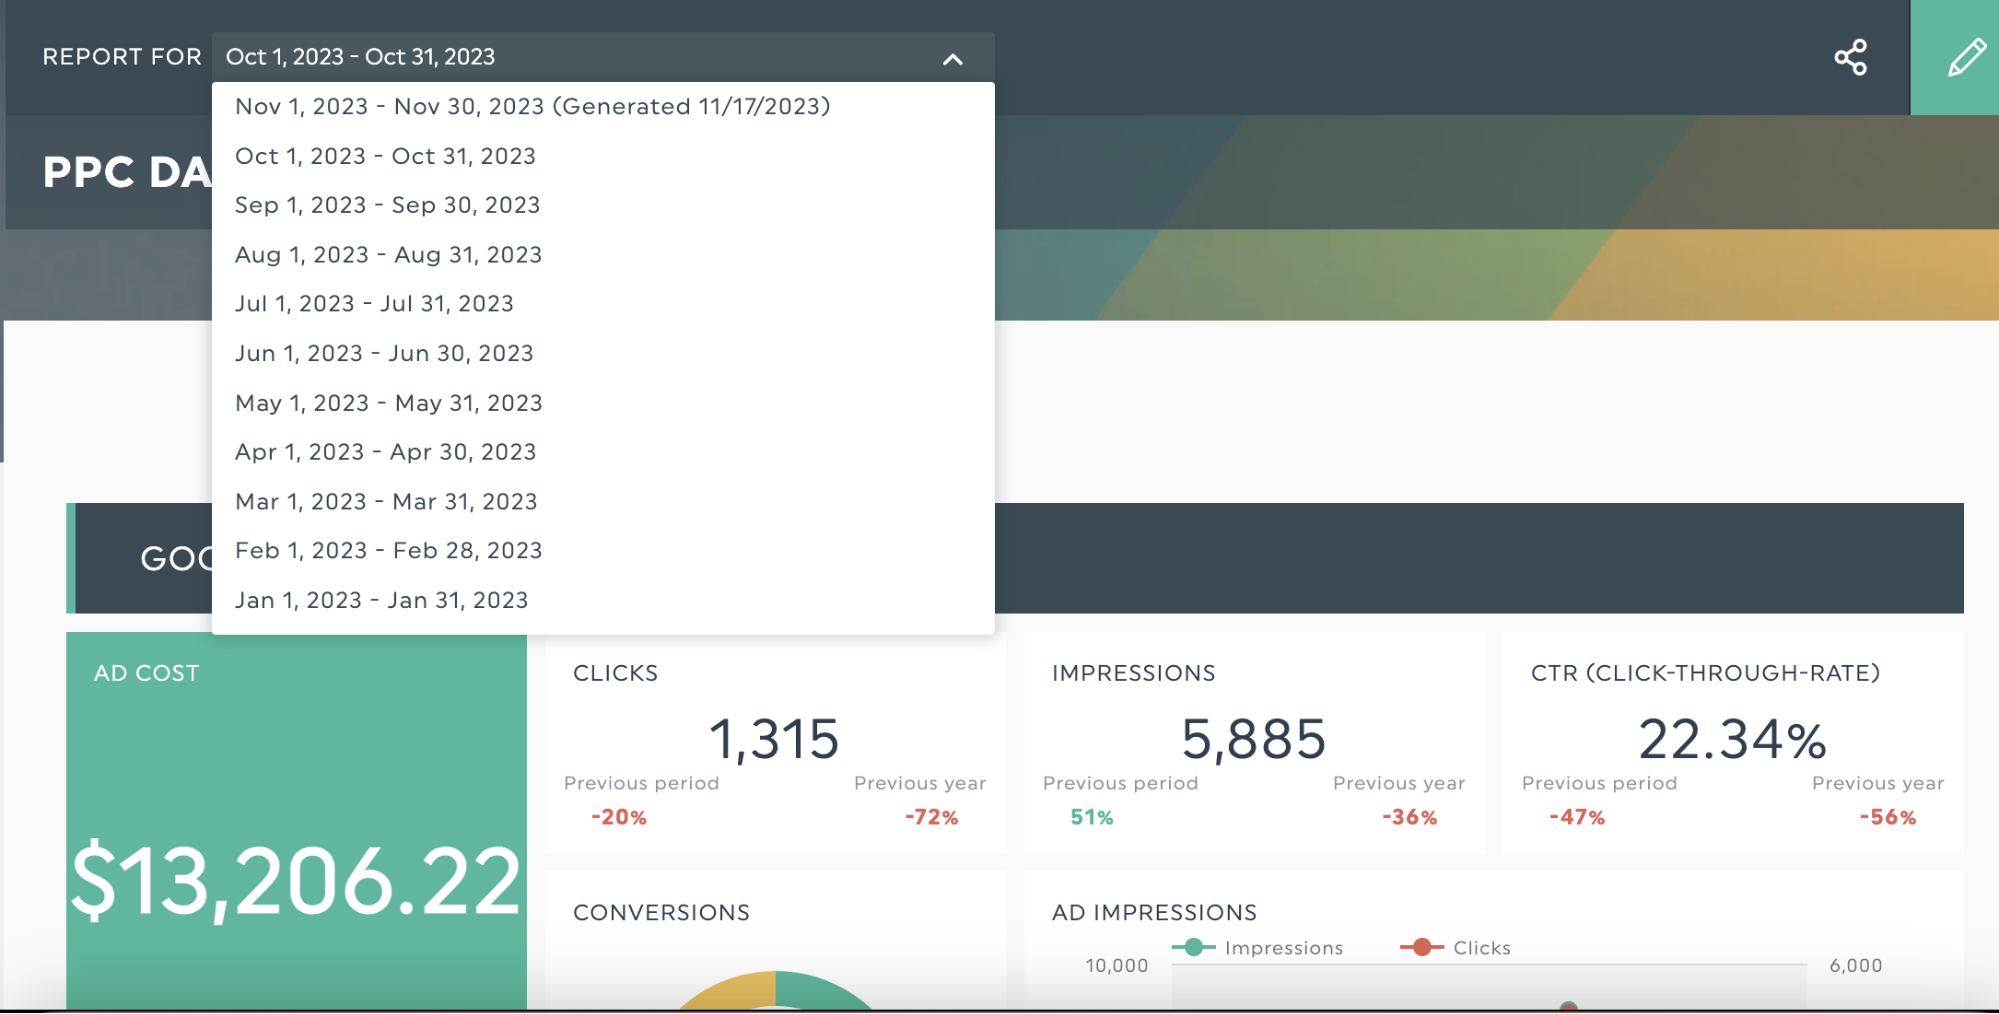
An easy dropdown menu to change the time period of your KPI dashboard in DashThis. Get your KPI dashboard with your own data here
It’s better for informed decision-making and perhaps your sanity.
Identifying trends
Trend analysis helps you predict what will happen based on past data.
DashThis has a couple of ways to show different KPIs compared over time:
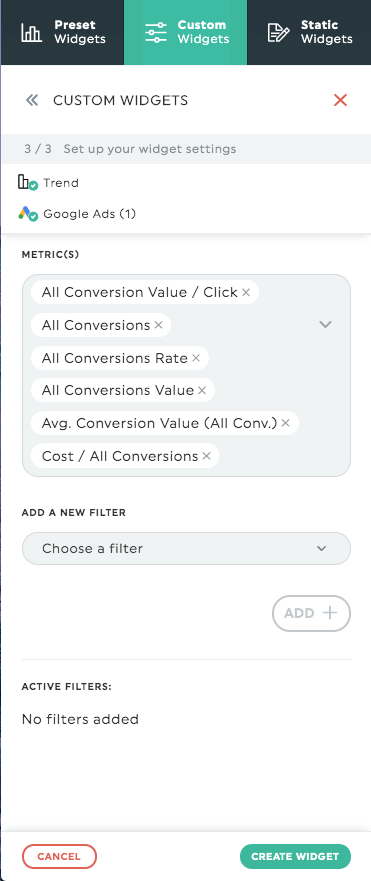
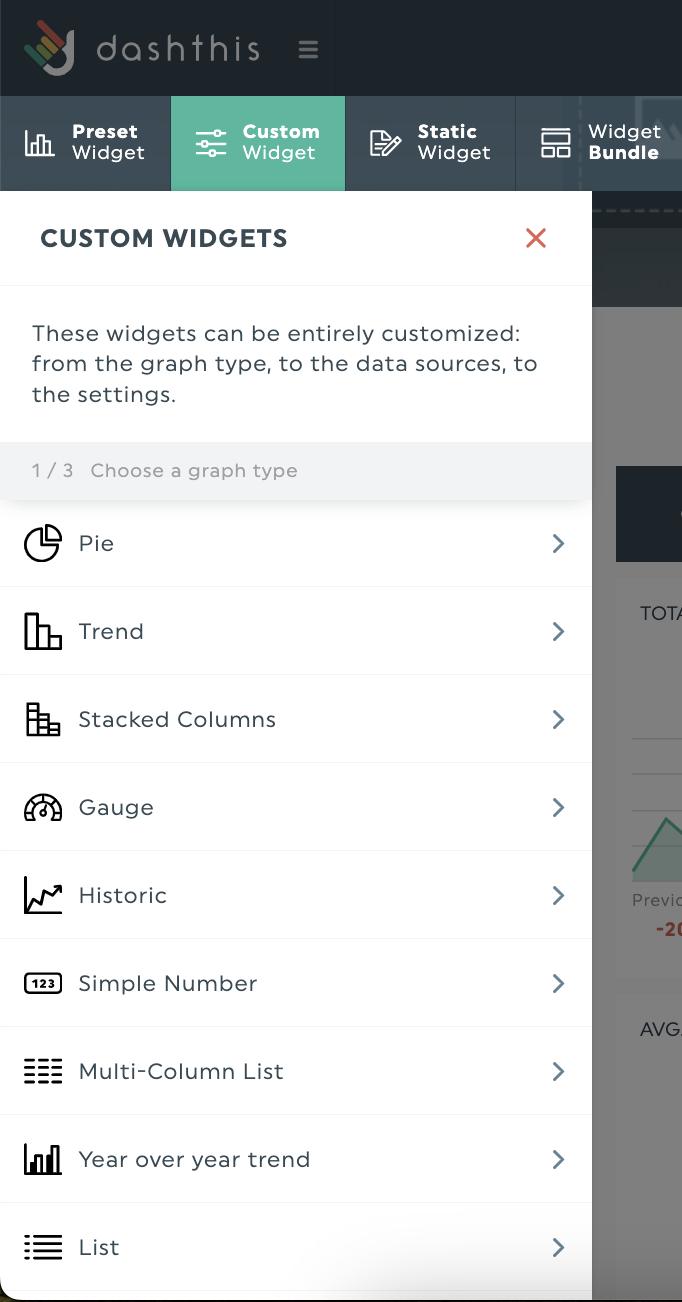
1. Use the Trend widget to visualize up to 6 metrics
See the trend widget in action comparing different conversion metrics over time. For example, analyze this year’s conversion rate trends for your Google Ads pay-per-click (PPC) campaigns.
In your DashThis account, you’ll find this in the Custom Widgets panel.
Visualize your KPIs using your preferred graph type.
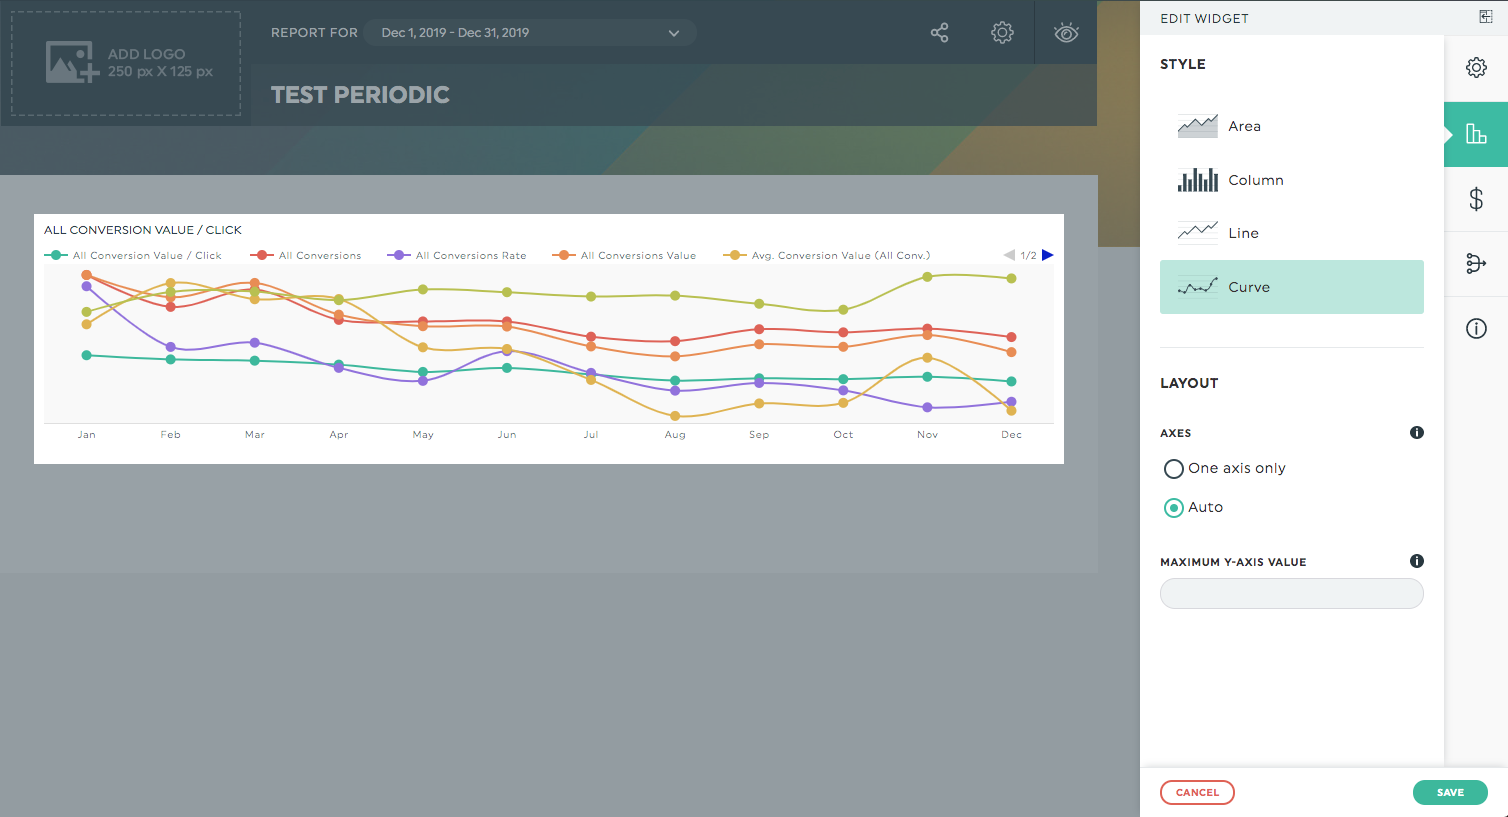
Some ways data visualization helps in marketing reporting:
- Track the correlation between 2 metrics: For example, track if returning or new customers bring in more revenue by tracking both metrics over time
- Visualize how a metric changes over time. Track KPIs like average order value or conversion rate over time to identify hidden opportunities
2. Changing the date range of your dashboard
Useful primarily for preparing for client business performance meetings or end-of-year reviews as you can visualize a trend of a metric over different date ranges.
Check out our guide on cloning an existing dashboard with different time periods
Time and cost efficiency
KPI dashboards make large amounts of data clear and concise
Ask yourself: is presenting a handful of Excel spreadsheets or one visually appealing dashboard at client meetings easier and more efficient?
Test it out for yourself. DashThis customer Jelly Marketing turned their Excel spreadsheets into interactive KPI dashboards, saving over 20 hours of work per month.
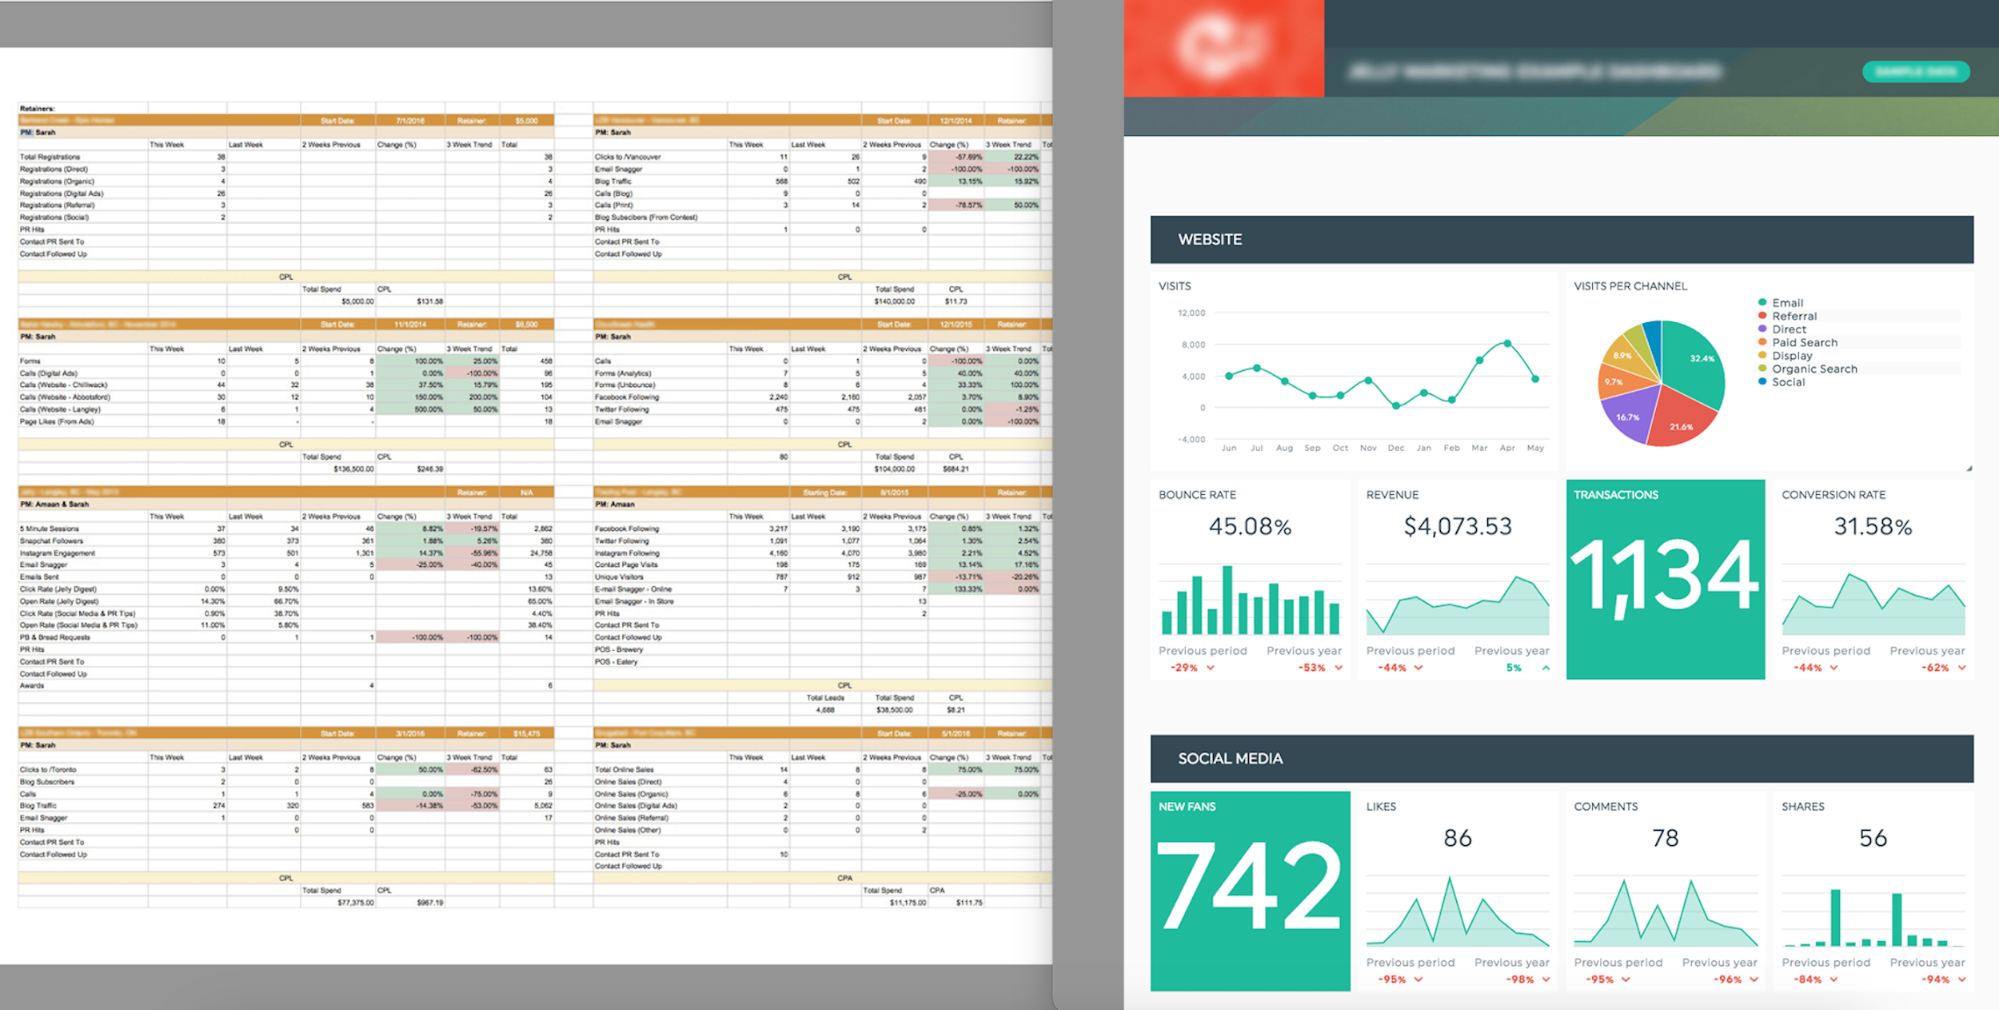
Left: Jelly Marketing’s previous reporting method before using DashThis.
Right: Jelly Marketing’s marketing reporting made simple in a KPI dashboard
If you're marketing across multiple channels simultaneously (although, why wouldn’t you?), a KPI dashboard is a must-have to visualize and track different KPIs. A study with 39% of 372 B2B marketing professionals report having a dashboard and data visualizations essential for multi-channel strategy success.
How to create a KPI dashboard with DashThis
Get started with DashThis in 4 steps:
1. Sign up for your 15-day free trial here
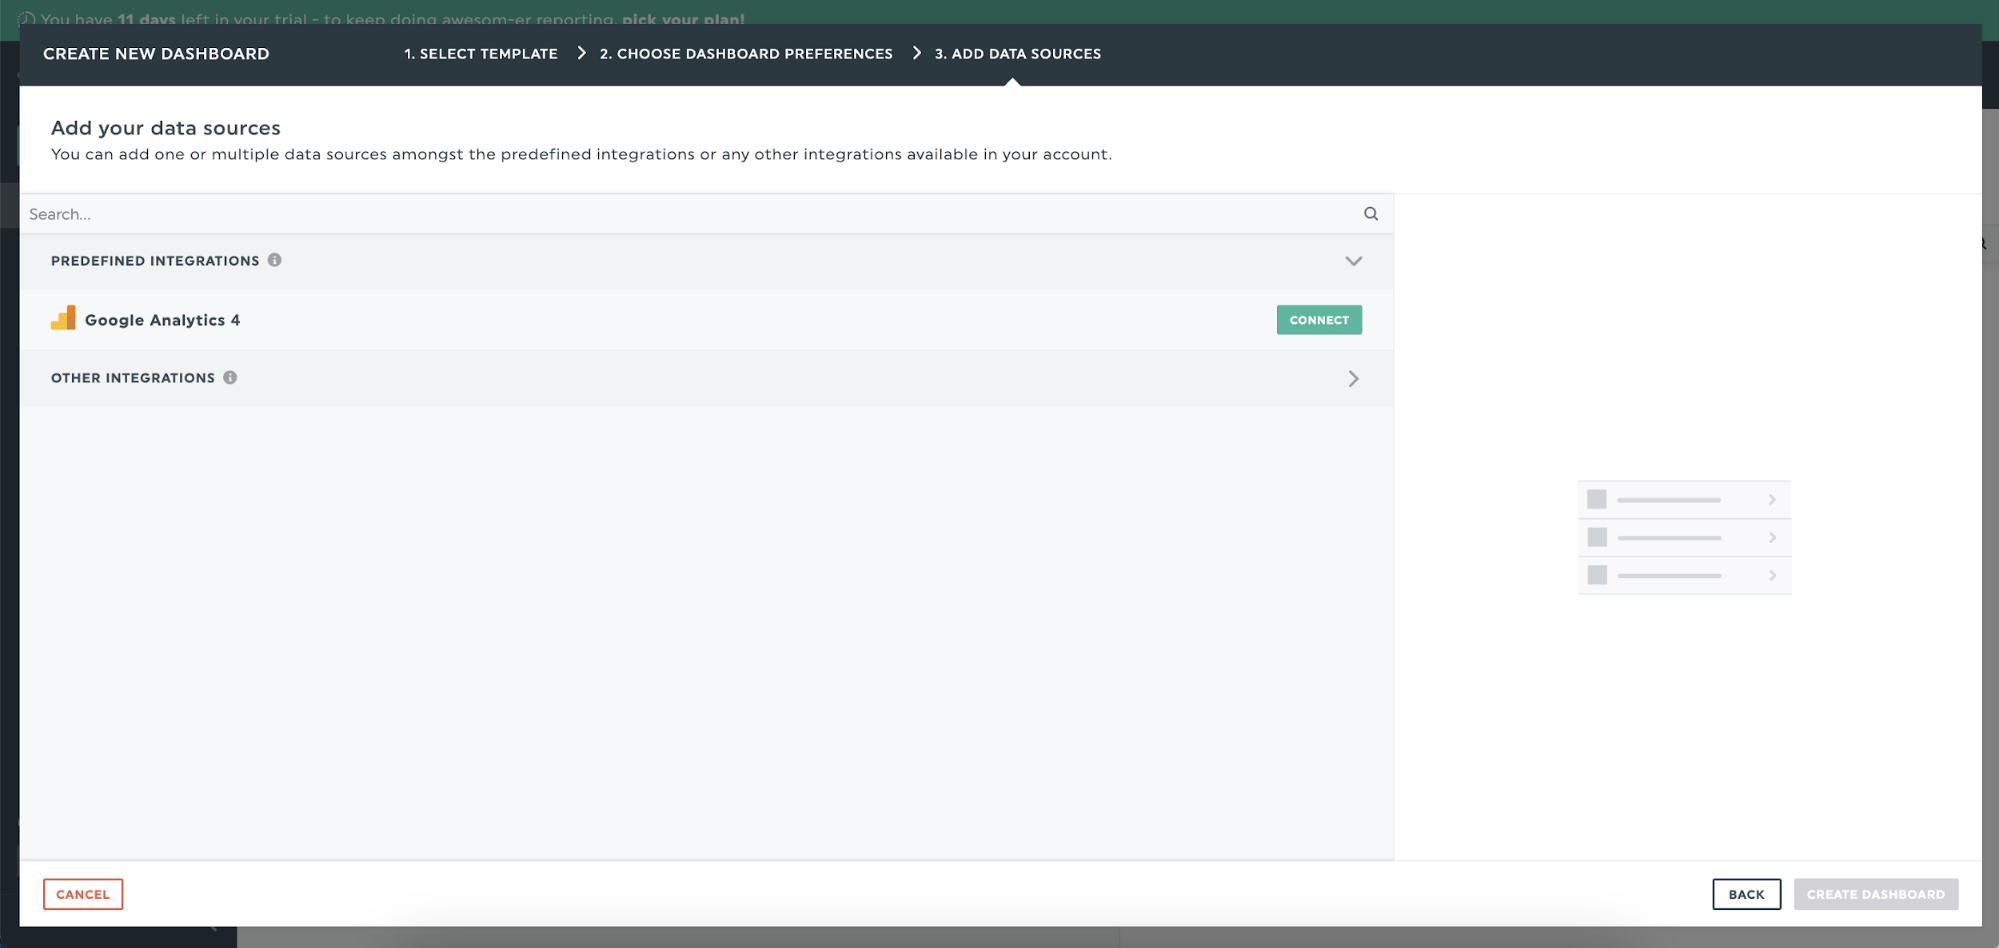
2. Connect your data sources
Say goodbye to manual exports and headaches. DashThis integrates multiple marketing tools to get all your data in one place.
Once you’ve connected your digital marketing accounts to DashThis, click on Create Dashboard.
3. Build your report
Use our report templates to quickly get started with popular metrics, or customize the dashboard with our preset widgets.
DashThis has multiple data visualization options to speed up comprehension. Visualise trends with line and column graphs, while a pie/doughnut chart visualizes individual parts of an aggregate metric.
4. Schedule it!
Finally, after all the work you’ve put in, don’t forget to send off your report!
Set up DashThis to deliver your report every week or month. You won't have to worry about forgetting to send your report again.
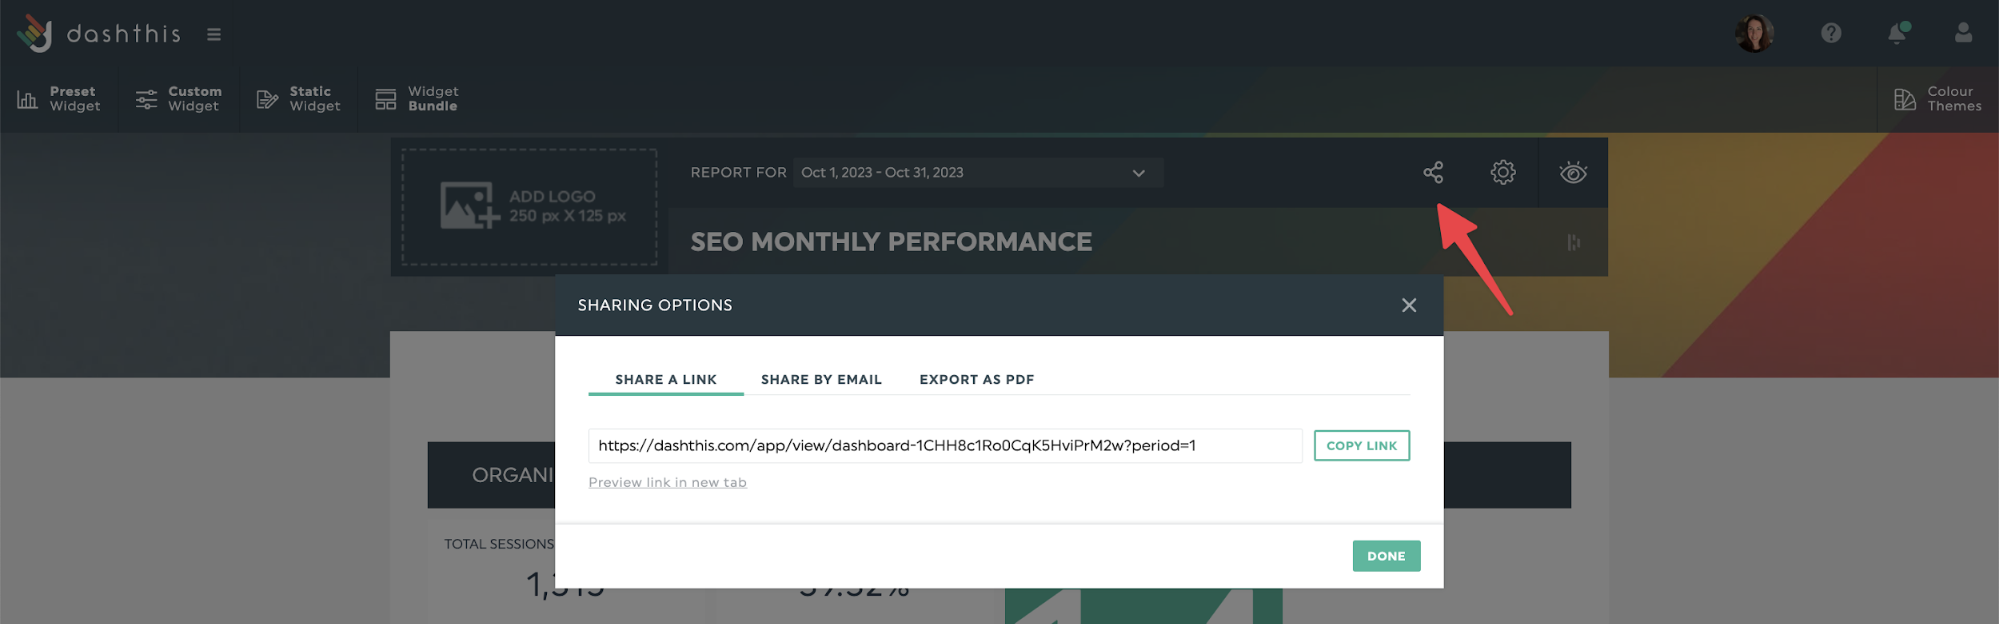
DashThis offers multiple report-sharing options, like
- Automated email dispatch
- A URL link to the report for clients to view online in real-time, perfect for client review meetings
- Export the report as a PDF to attach to your email or upload to a client folder.
KPI dashboard example for digital marketing
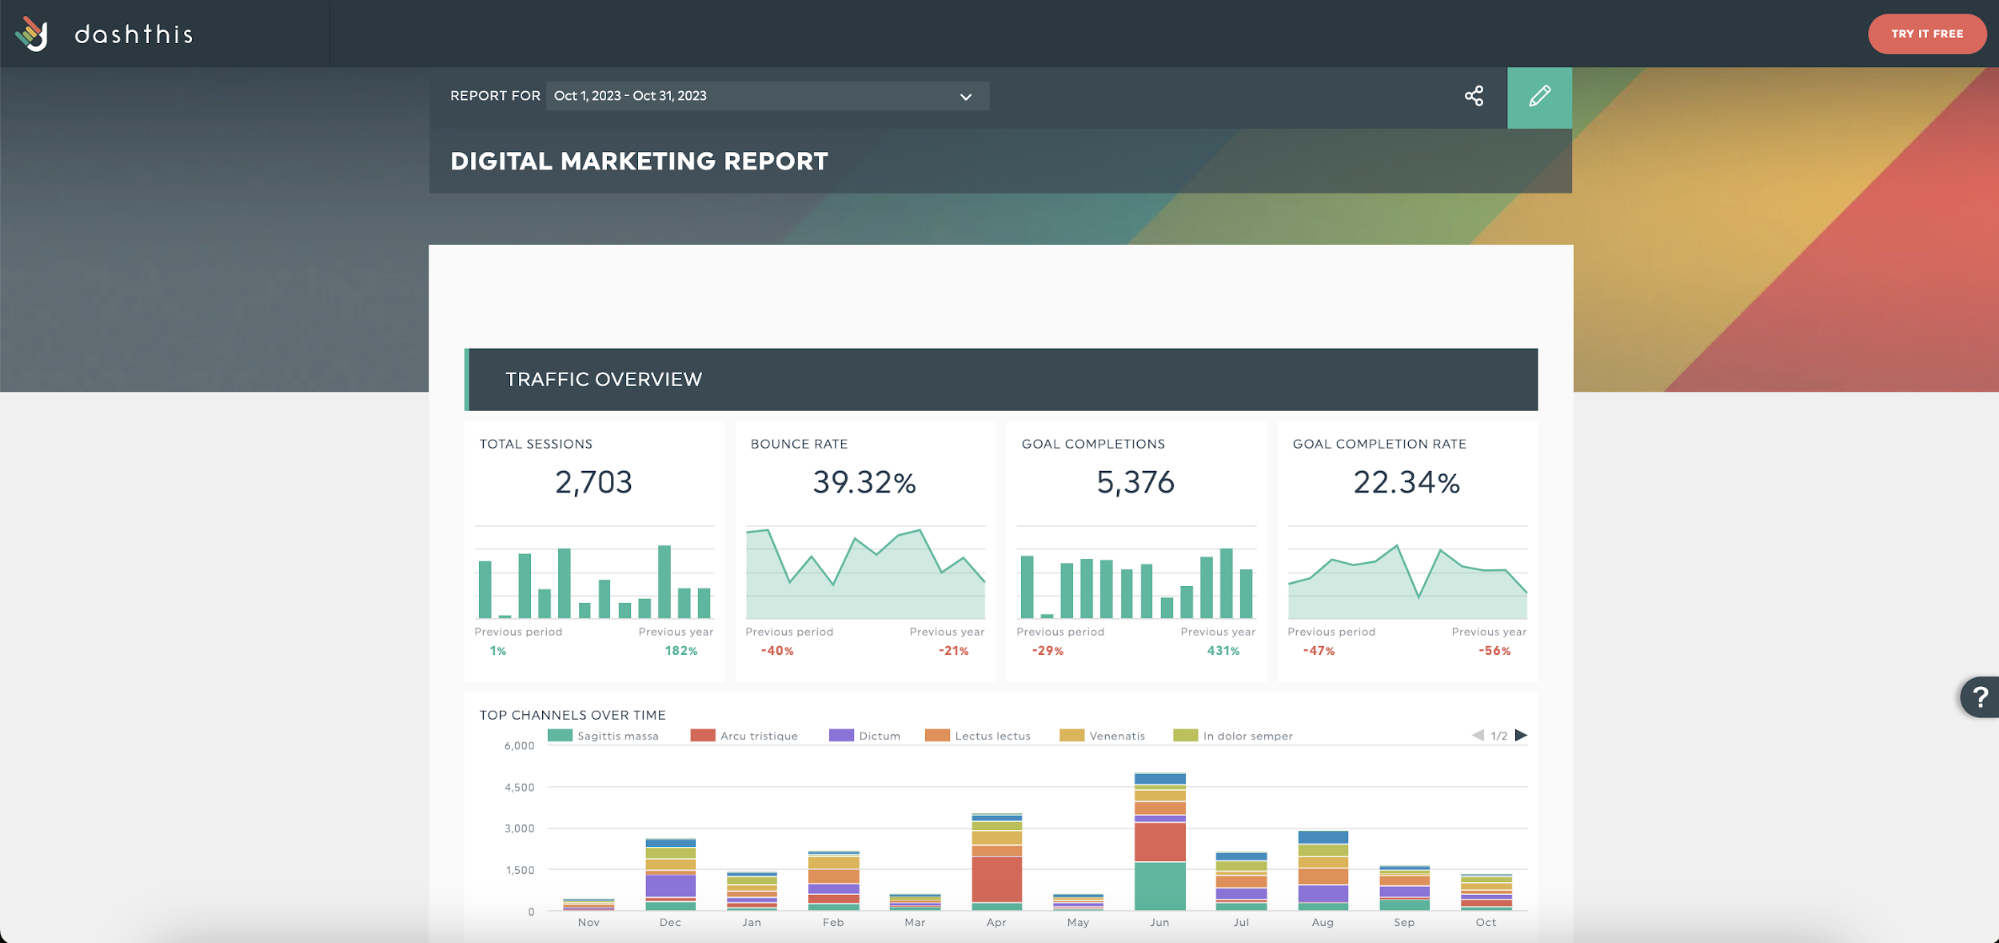
Get this digital marketing report with your own data!
Build your digital marketing KPI dashboard in minutes with our KPI dashboard template. Handy for cross-channel marketing reporting or giving your CEO a complete overview of your marketing activities.
It's as easy as signing up and connecting your favorite marketing integrations. Boost your efficiency and impress your boss or client with your reporting skills. Isn't that great?
Automate your KPI dashboard reporting
A KPI dashboard saves time and simplifies business decision-making.
But manually creating dashboards takes hours and doesn’t look as professional. Create visually appealing dashboards and save time with DashThis.
Give it a try! Get your 15-day trial of DashThis today.

Create your own KPI dashboard today
Read More

Don’t miss out!
Follow us on social media to stay tuned!
Automate your reports!
Bring all your marketing data into one automated report.
Try dashthis for free