A Quick Guide to PPC Metrics

Does populating your pay-per-click (PPC) campaign performance reports make you nervous?
Well, fear not. We’re here to help.
While reporting your PPC advertising efforts, your stakeholders, clients, or senior management want to know.
- How much of our marketing budget did we spend?
- How many total conversions did we get this month?
- How are our campaigns performing, and what can be optimized?
You need to have a firm grip on your PPC metrics to answer these questions. We’ll also show you how to track important metrics and automate this otherwise manual reporting process with DashThis in this guide.
- What are PPC metrics
- How to track PPC metrics with Dashthis
- Top PPC metrics to track
- - Clicks
- - CPC
- - Click-through-rate
- - Impression share
- - Conversion rate
- - Cost per conversion / per acquisition
- - ROAS
- - Quality score
- Automate it
What are PPC metrics?
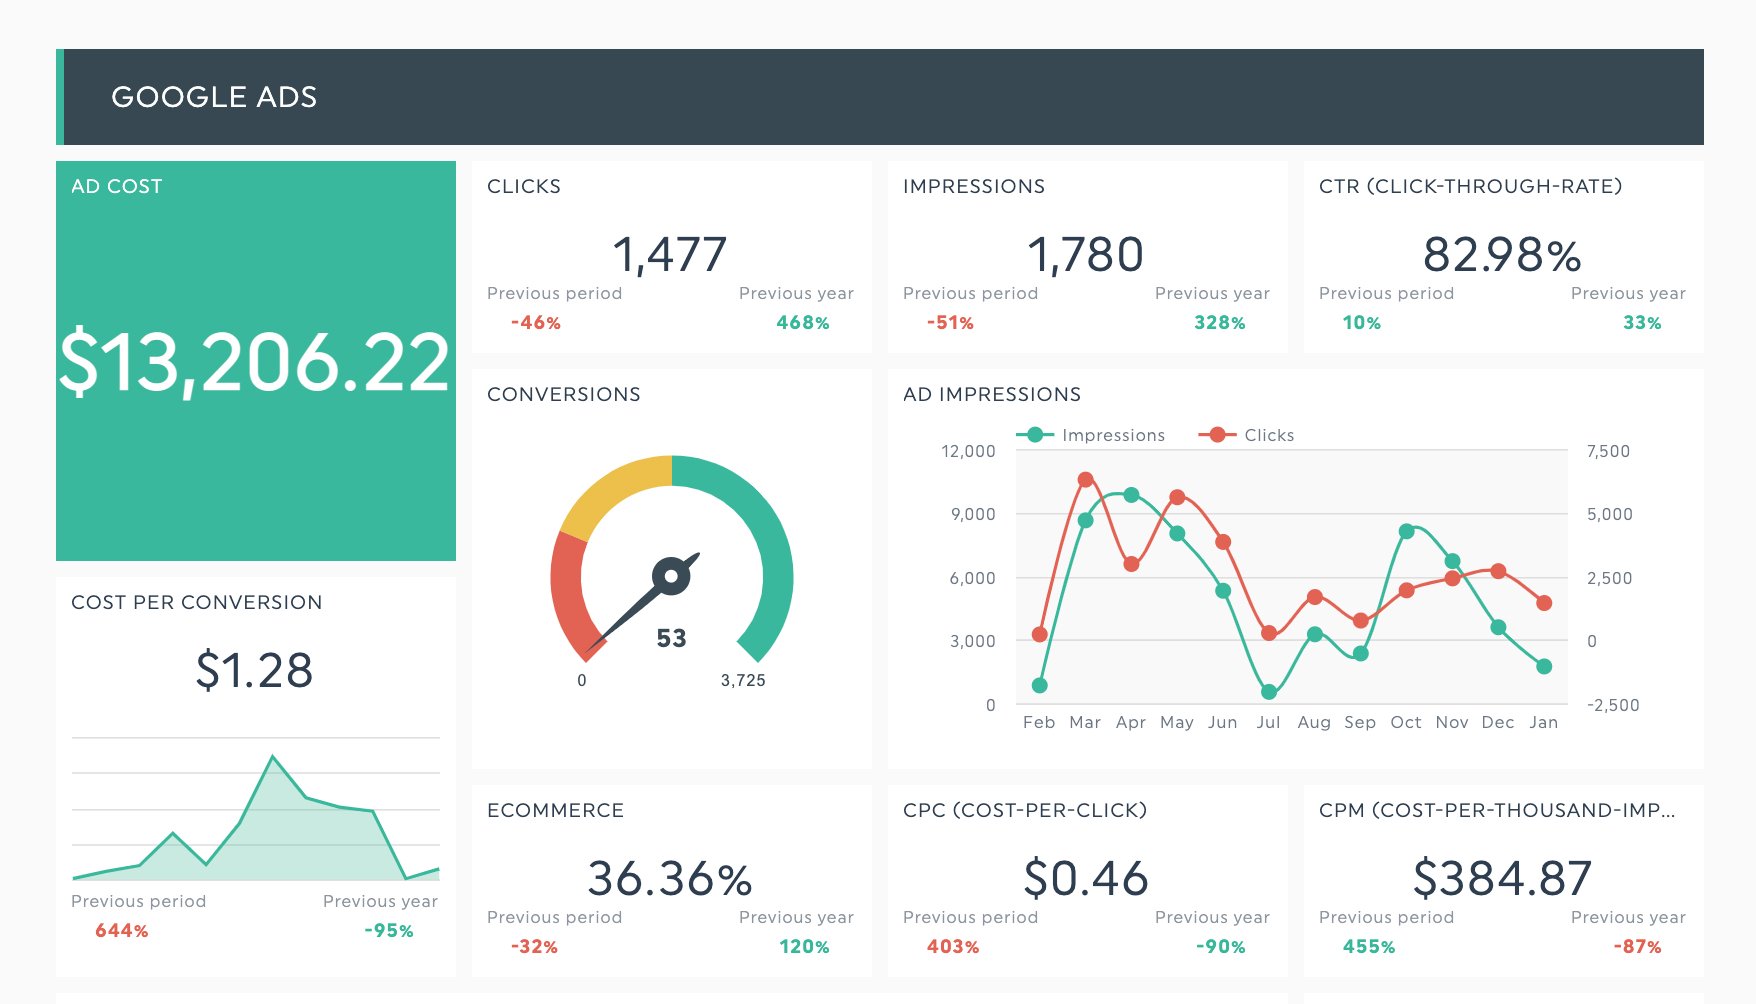
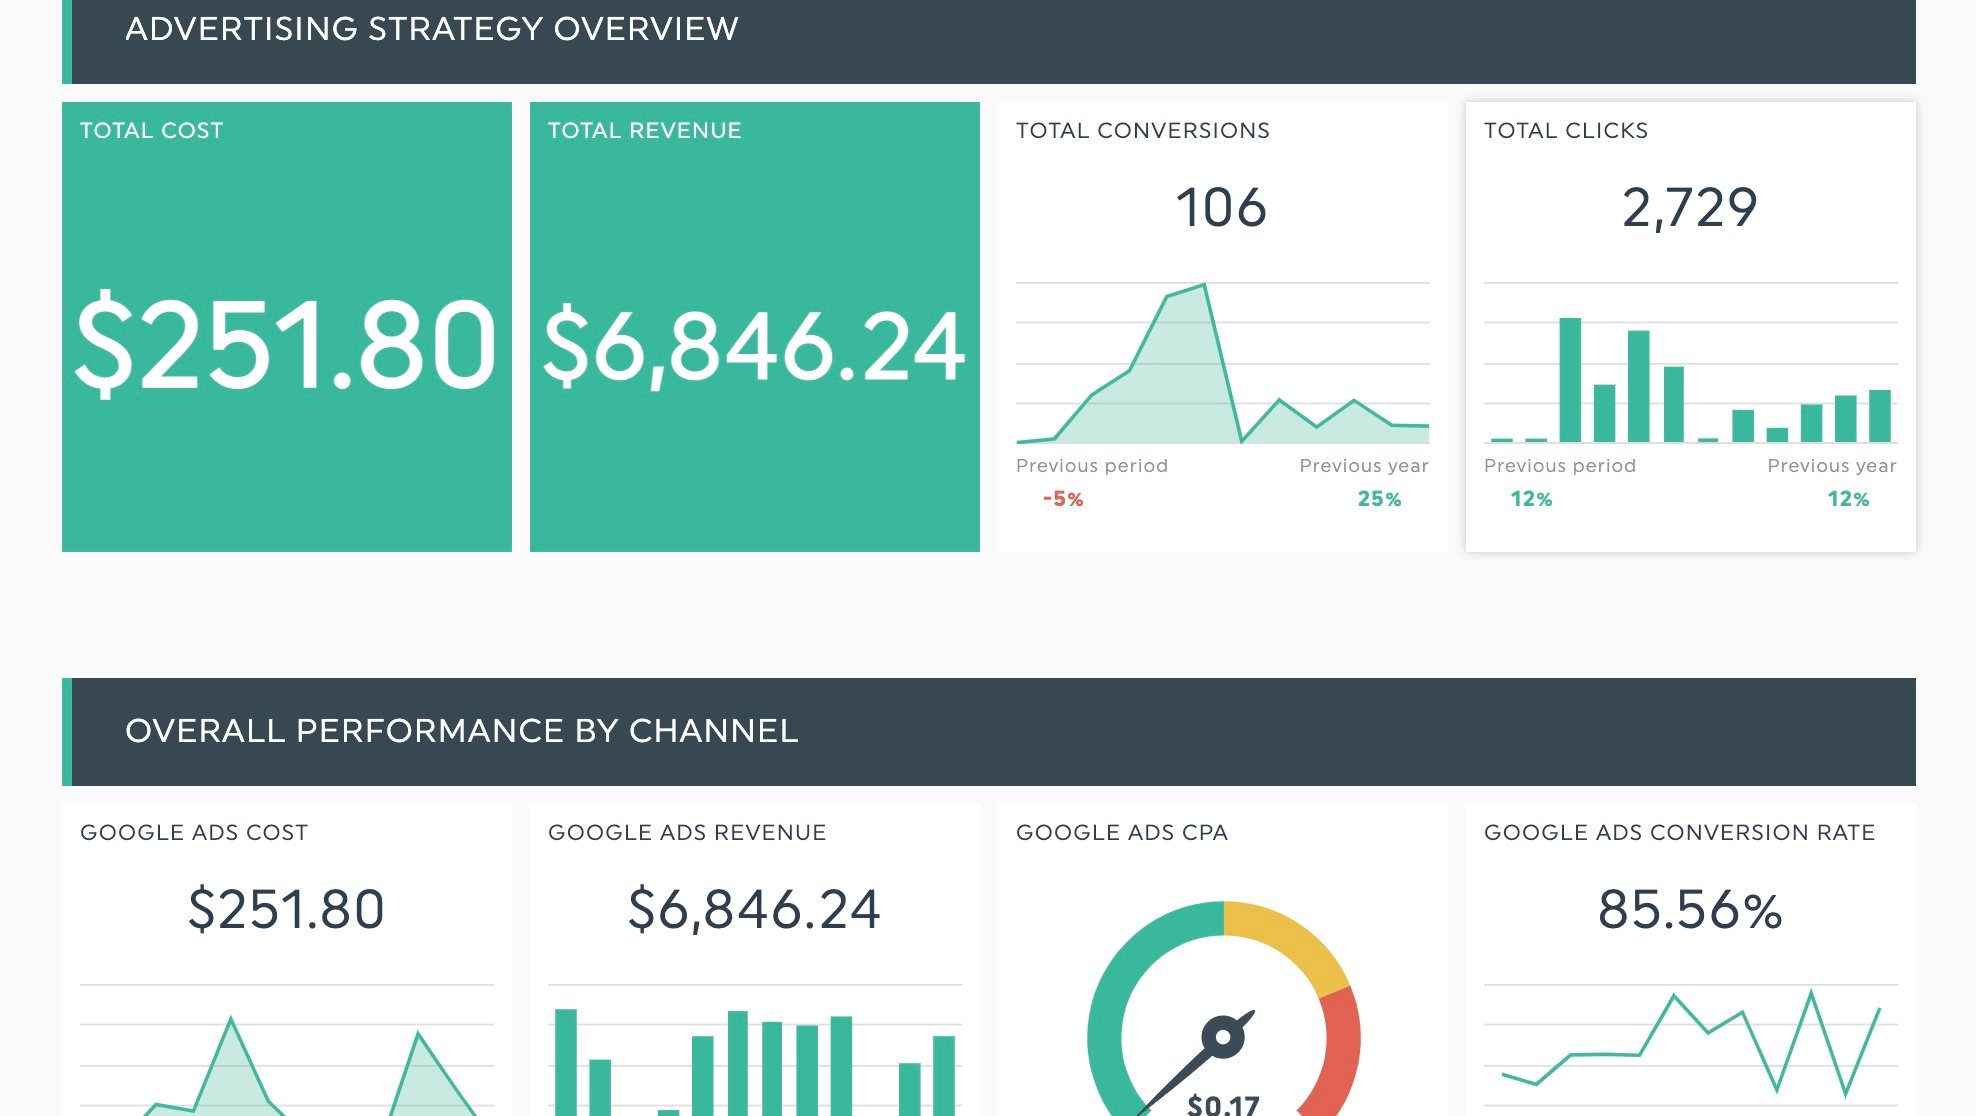
DashThis’s PPC report template. See this template with your data.
Pay-per-click (PPC) campaigns, also known as paid ads, are a type of online advertising where advertisers pay each time someone clicks on their ads. It’s a rapid method of putting an offer in front of your target audience and a popular form of digital marketing to complement search engine optimization (SEO) efforts.
Pay-per-click metrics are the key performance indicators of your PPC campaigns. You can determine if a campaign is performing if you know which metrics to measure.
You know how much you’re spending and how much your campaigns contribute to your marketing or business goal, and you have the correct data to answer questions during your reporting meeting. They also help you set and measure concrete targets for your campaign.
How to track PPC metrics with DashThis
Step 1: Sign up for an account with DashThis (your first 15 days are on us!)
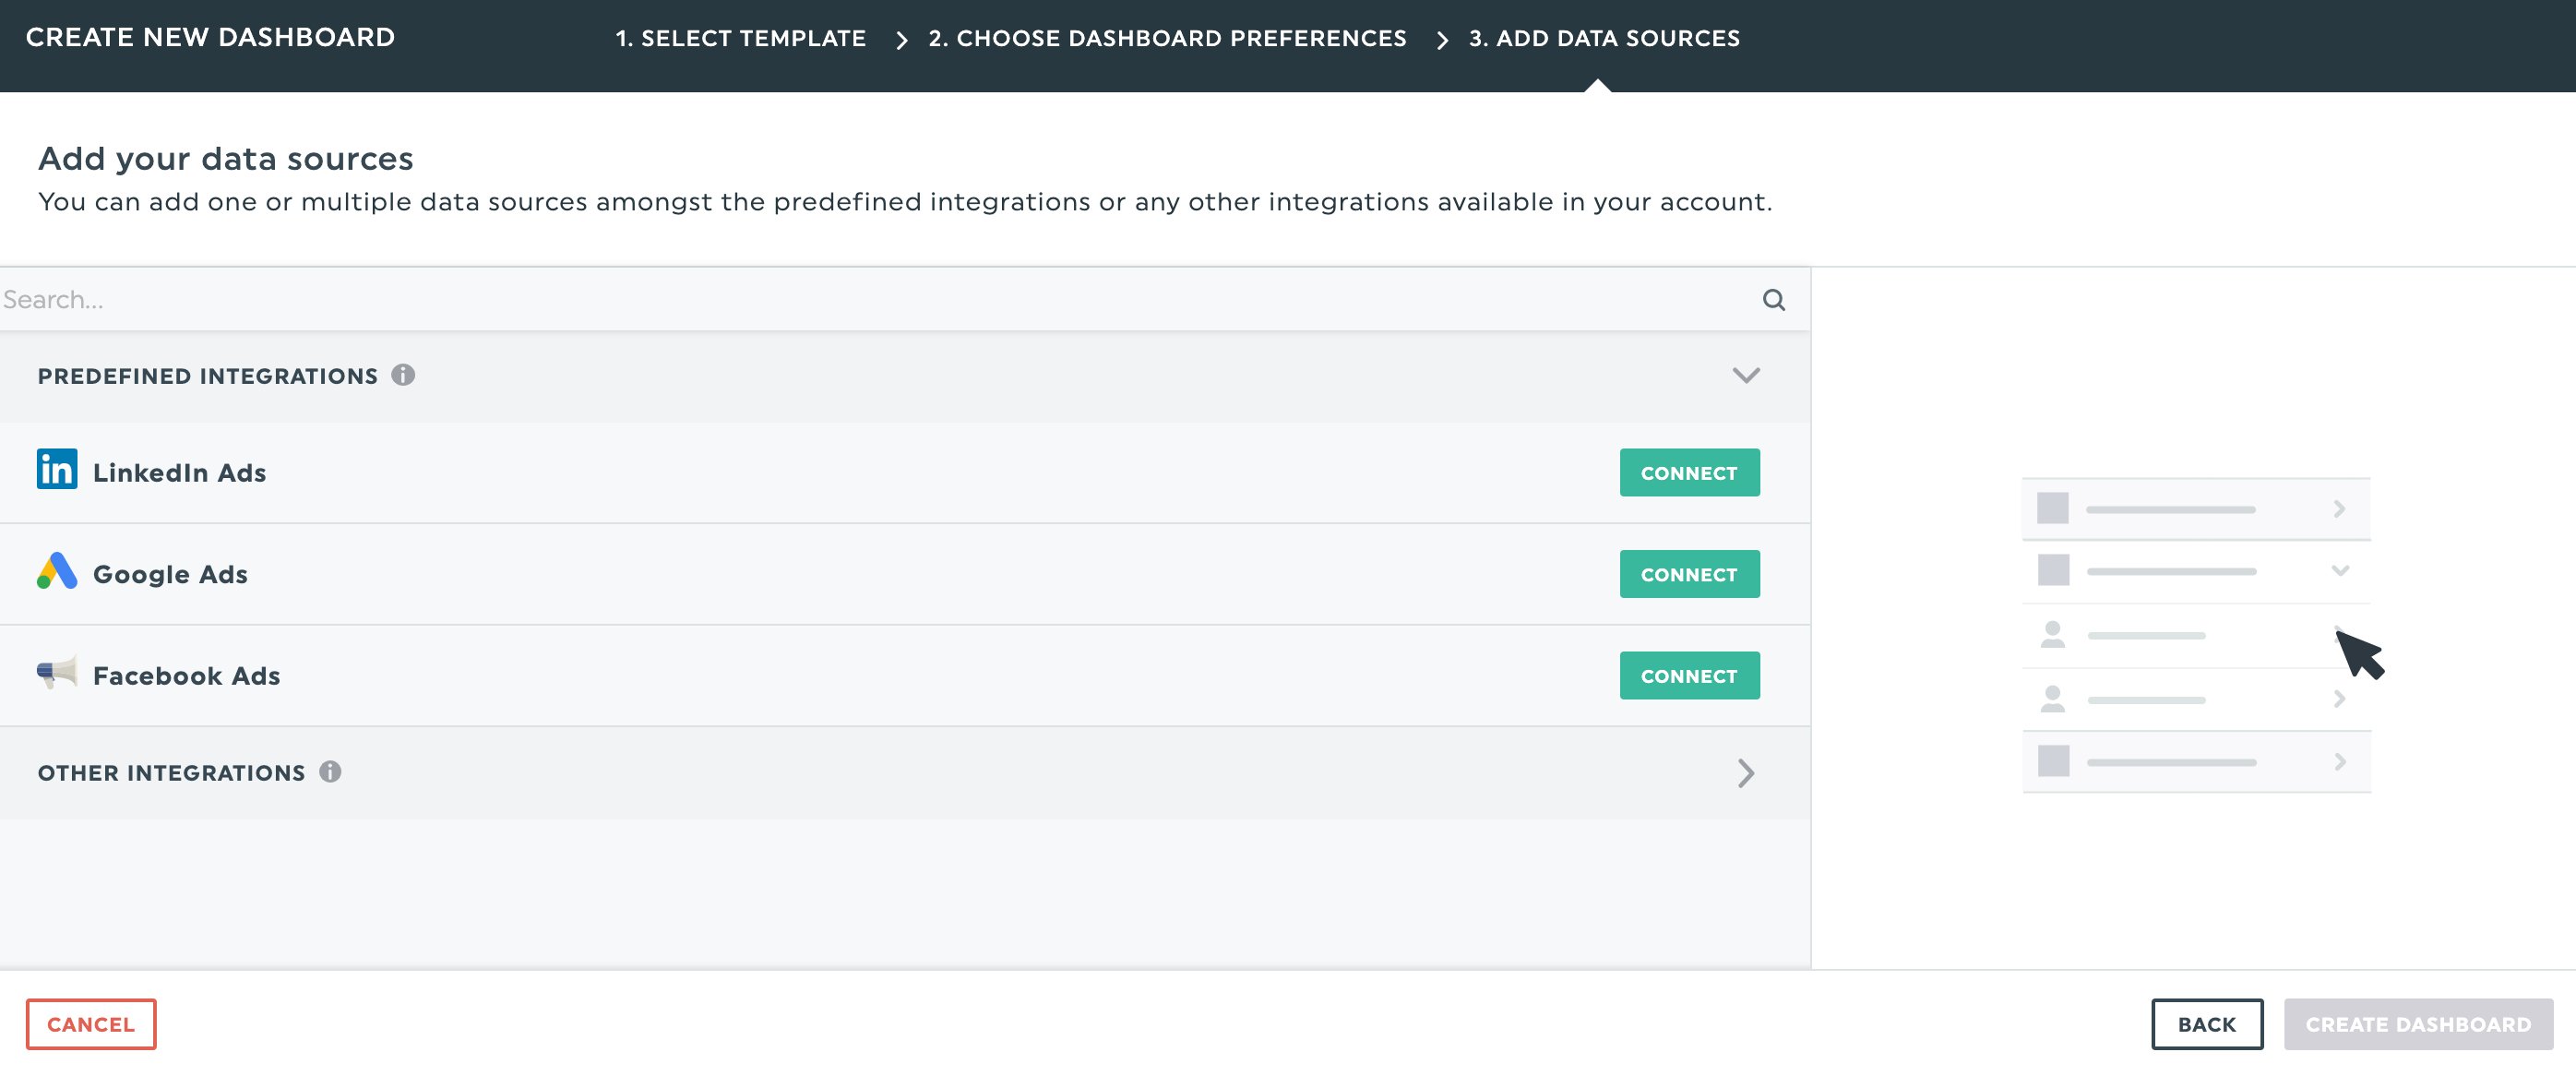
Step 2: Connect your favorite paid marketing tools in seconds (we support over 40 integrations, including major PPC platforms like Google Ads, Facebook, Instagram, and LinkedIn ads.
Step 3: Select your metrics from DashThis’ preset widgets
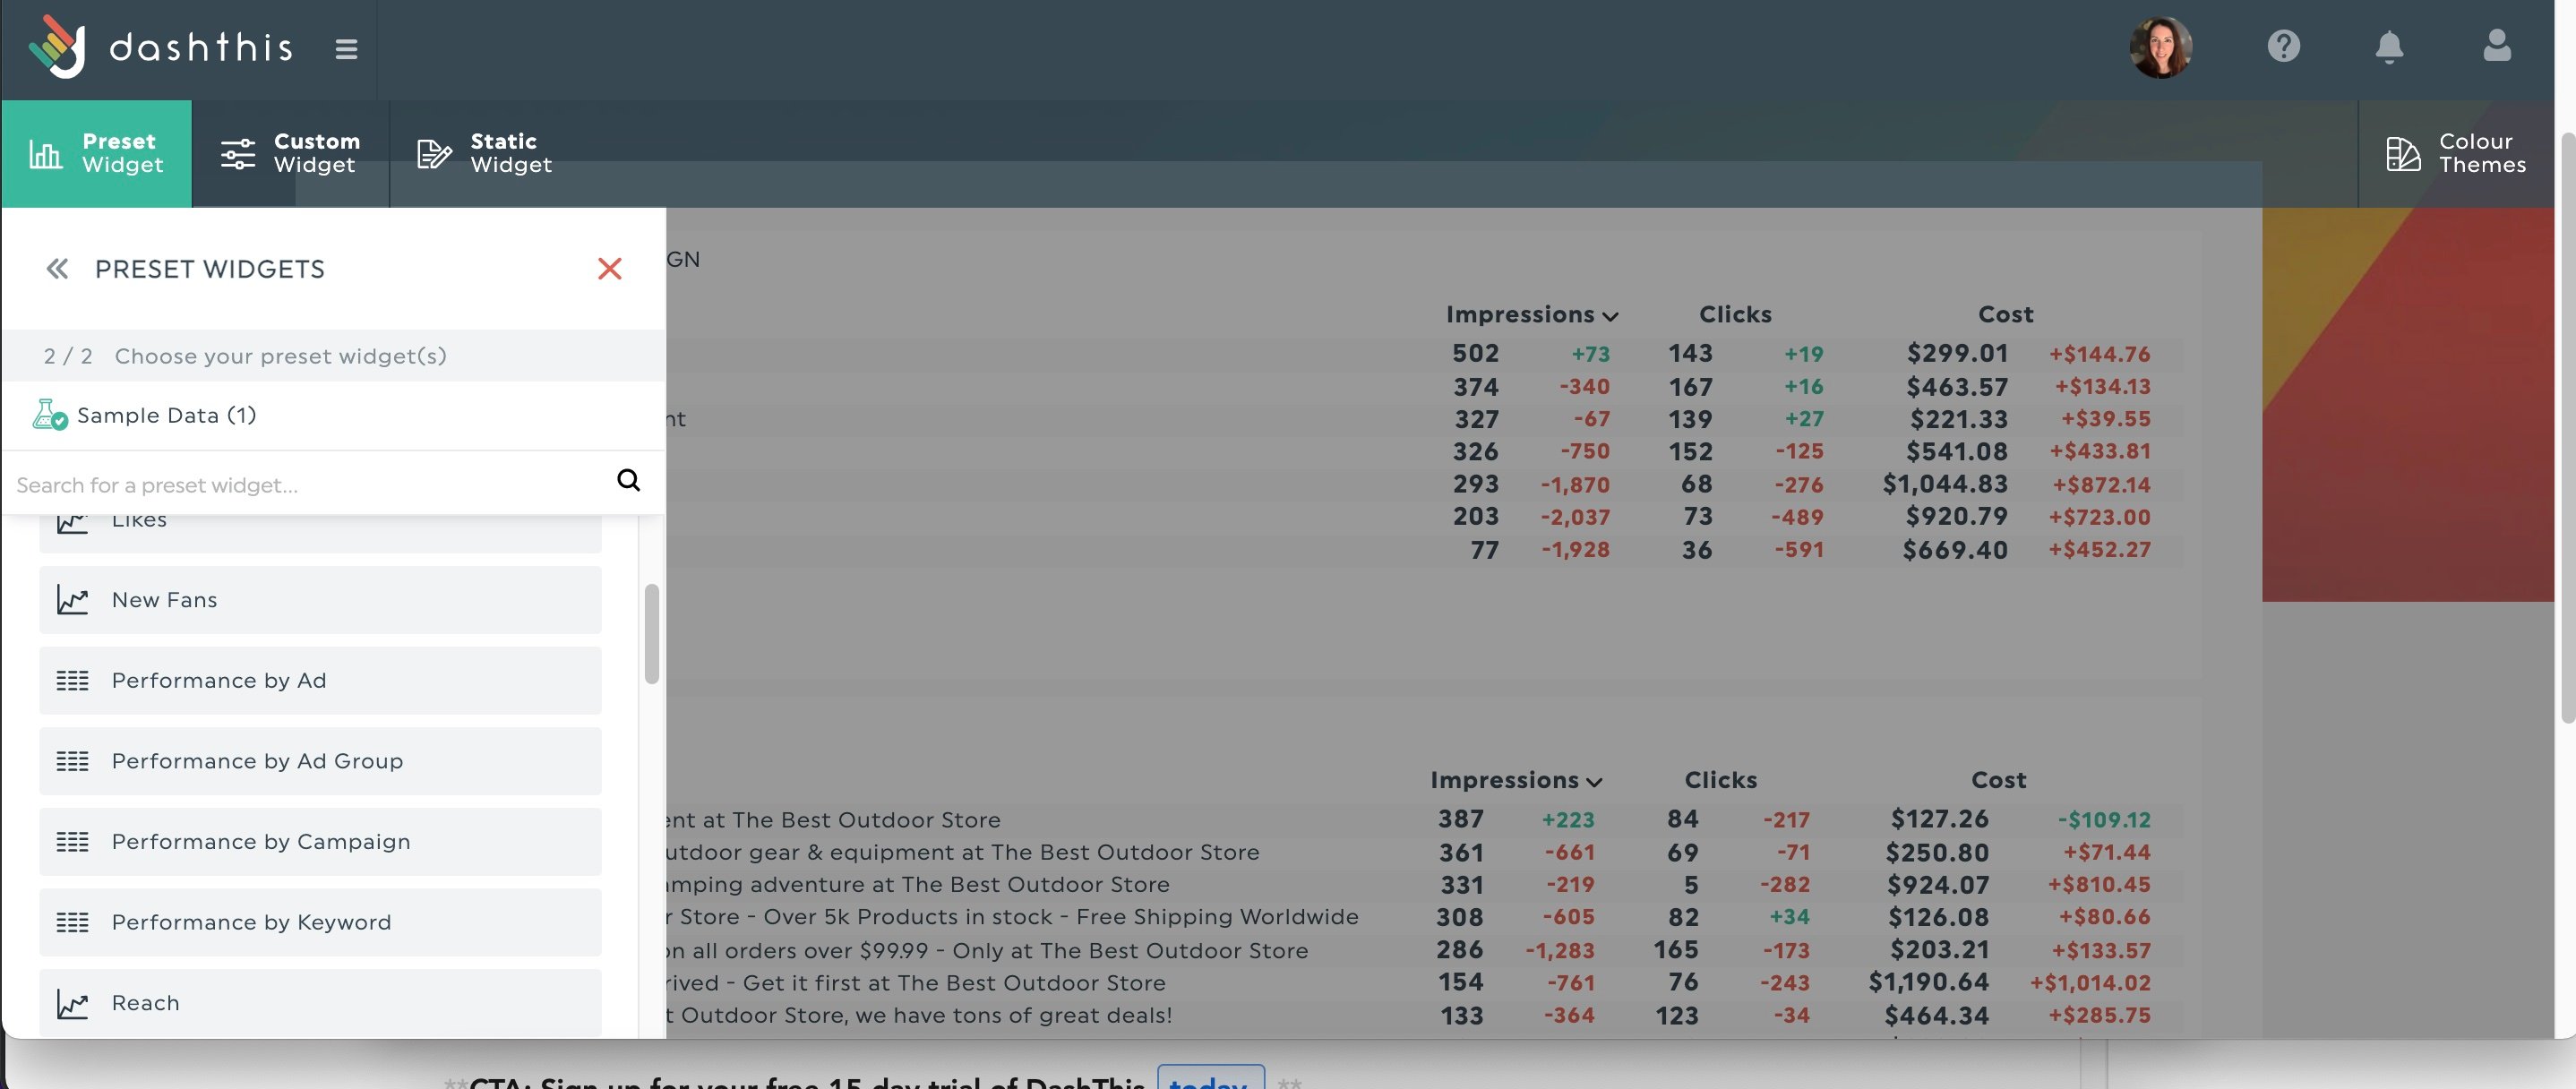
Step 4: Drag and drop as many metrics as you desire to create your own personalized PPC campaign dashboard!
Sign up for your free 15-day trial of DashThis today.
The top PPC metrics to track, explained
1. Clicks
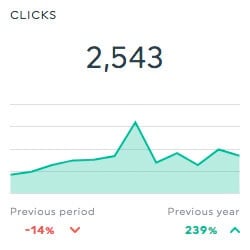
Clicks act as your first point of contact between your ad campaign and your target audience. People click on ads if the ad captures their interest. Measure clicks to understand if your ad messaging resonates with your target audience.
However, clicks are just the first step of engagement.
They don’t give you the entire story of whether your campaign is a success. For example, if you’re running an ad campaign to increase average order value for an e-commerce product line, you want to know how many of these clicks influenced order value.
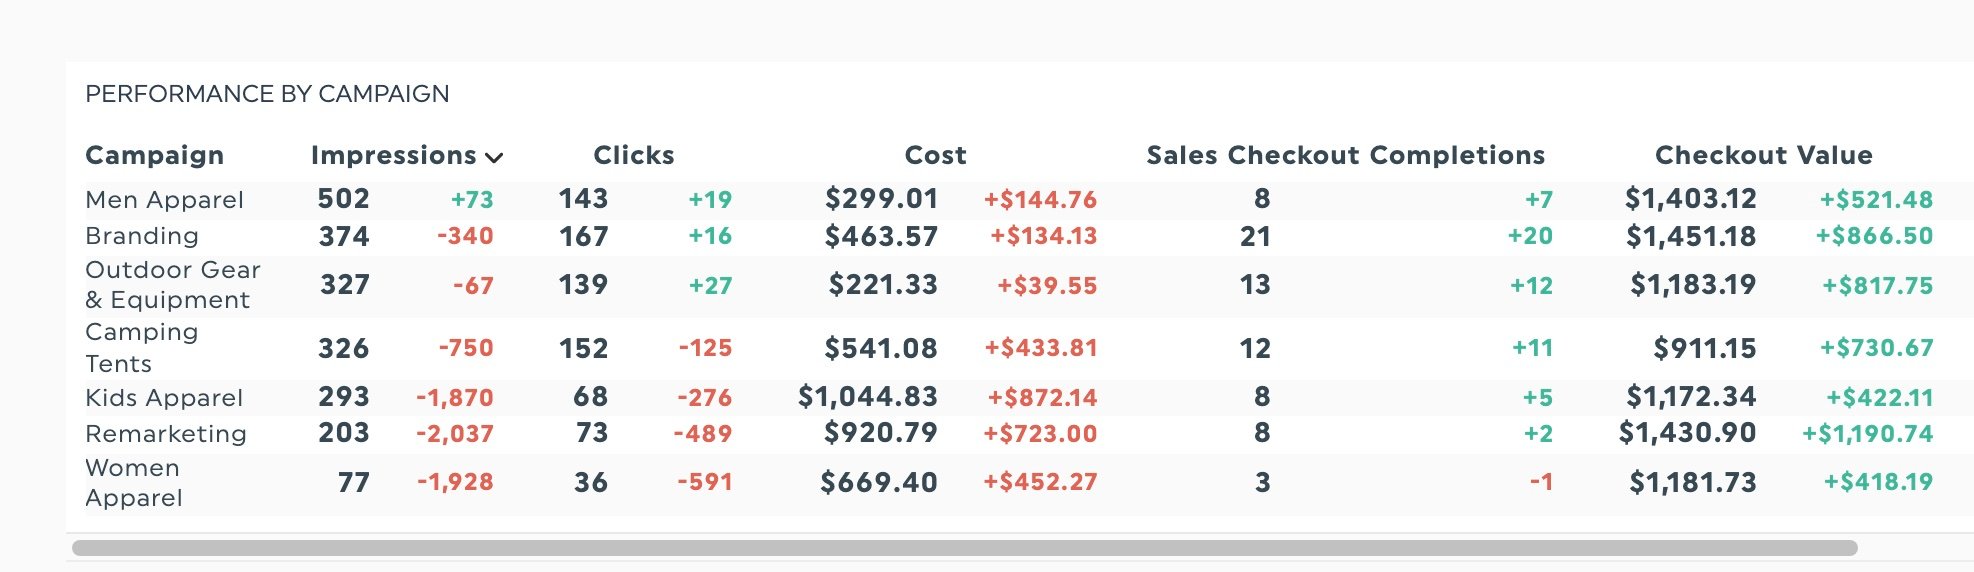
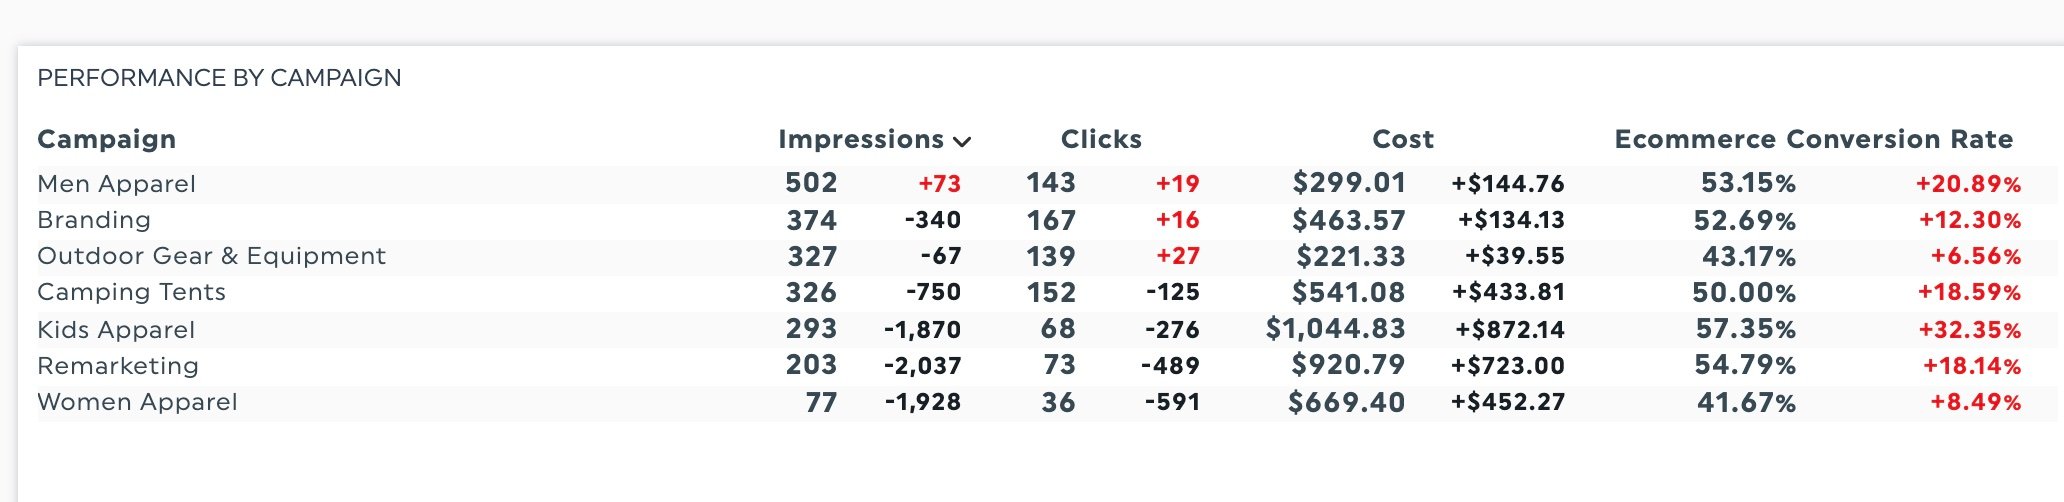
Tracking the effectiveness of an e-commerce ad campaign in DashThis
To do this, track other metrics alongside clicks like impressions, cost, successful checkouts, and their overall value to understand how many sales your ads bring in.
2. Cost-per-click (CPC)
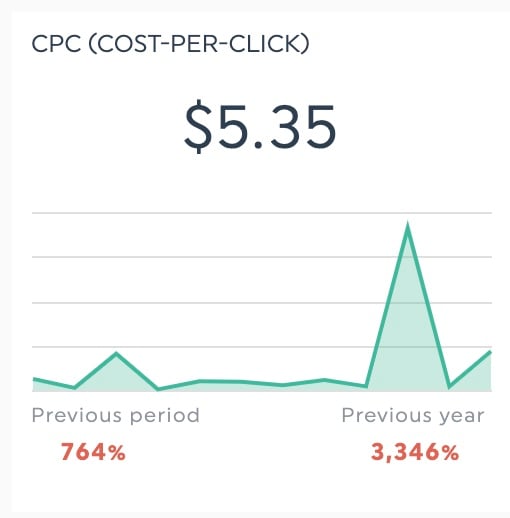
CPC is a cost-efficiency metric calculated by the total cost/number of clicks.
It tracks how much you pay when someone clicks on your ad and relates to the return on investment of your paid campaigns.
Track your CPC to understand:
- How much you’re paying for your traffic
- Whether your clicks bring in relevant, quality traffic for your campaign goal
- The quality of your campaign assets. For example, Google Ads gives better prices to higher quality ad campaigns
- Your eventual cost-per-conversion
3. Click-through rate (CTR)
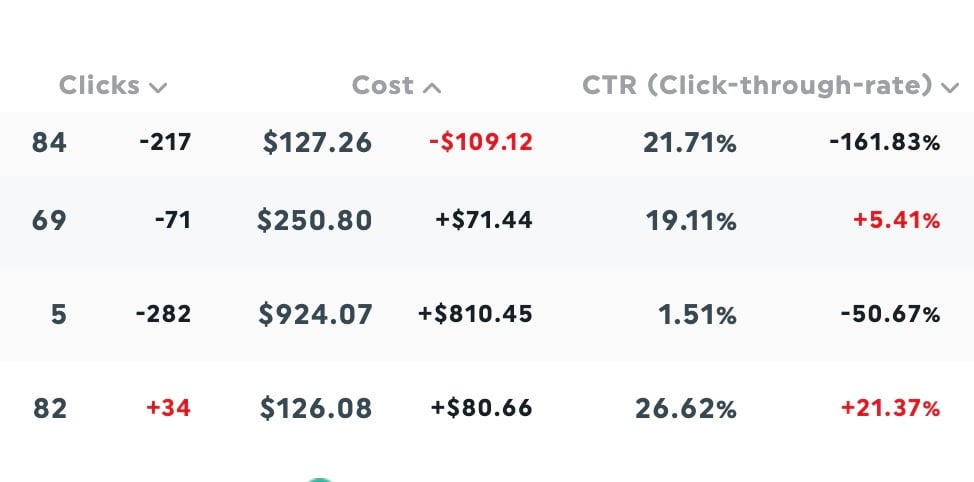
Click-through rate is the percentage of impressions leading to clicks.
It’s a sign of ad relevance.
A high CTR signals your ads are helpful and relevant for the targeted keywords. Conversely, a low CTR means your ads aren’t engaging, which indicates:
- Your ads aren’t appealing enough to your target audience to engage with
- You’re targeting the wrong audience
- You’re spending money on the wrong keywords (Tip: add underperforming keywords to your negative keyword list)
Tip: Good PPC clickthrough rates vary by industry and the keywords you’re bidding on. Look at your industry’s average clickthrough rates, then analyze how your campaign performs against these benchmarks. Start by looking at these 2021 industry benchmarks
4. Impression share
Impressions indicate how many people saw your ads. Impression share shows how many potential impressions you could have earned against how many ad auctions included your ad.
It’s a measure of potential opportunity. Knowing which areas of your account remain eligible to receive more impressions gives you valuable insights on optimization opportunities. Take note of this metric mainly if your campaign contains branded search queries.
Calculation for IS: Impression share = impressions / total eligible impressions
5. Conversion rate
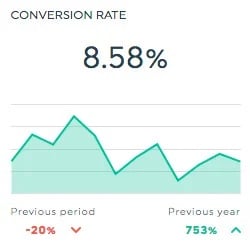
The conversion rate describes how many people did what your campaign wanted them to do. It’s a measurable action that takes the visitor closer to becoming a paying customer.
Some everyday conversion actions depending on function or industry:
- E-commerce: Making a purchase
- Membership: Signing up for a subscription
- Service business: Submitting a contact form or downloading a content asset
- Marketing: Signing up for a newsletter
- Software-as-a-service: Signing up for a free trial or sales consultation
Conversion rate and its optimization (CRO) is perhaps the most influential PPC metric for your ad campaign as it’s the PPC metric most associated with business revenue. For stakeholders, it’s the most direct measurement of your ad campaign’s effectiveness.
6. Cost per conversion/cost per acquisition
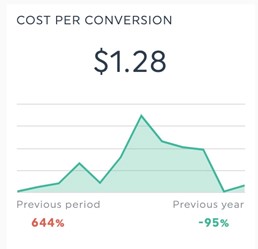
If conversion rates are the most influential PPC metric, cost per conversion is the second most.
Why? It’s an indication of the effectiveness of your marketing spend and has implications on your budget.
For example, spending $1,000 versus $10,000 for 100 conversions tells a very different story for your ad campaign. The second could indicate your campaign is delivering too little results for the budget spent, and you’ll be looking for ways to lower costs. The first is excellent.
Calculation: Cost per conversion = Total cost of ads/number of conversions
If your cost per conversion is too high, it’s time to review every aspect of your ad campaign; from your creatives and ad copy to targeting and the time your ads are shown.
7. Return on ad spend (ROAS)
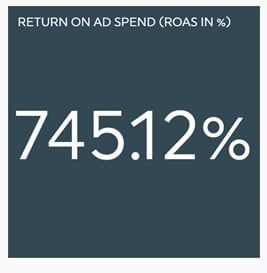
Another crucial metric to include in your report for non-marketing people is ROAS. It measures the revenue earned for every dollar spent on ad campaigns. It’s an essential indicator of a campaign’s profitability and contribution to a business’s bottom line.
ROAS can either measure marketing channels as a whole or go into specifics based on specific ads or campaigns.
Benchmarks vary across industries, but if you’re unsure, e-commerce company BigCommerce uses a 4:1 ratio - meaning every $1 of ad spend must contribute $4 in business revenue.
Calculation: ROAS = Revenue attributable to ads / Cost of ads
8. Quality Score

Quality Score evaluates the journey a searcher has with your ad if they engage with your ad. determines how relevant your ads and website are to answering a searcher’s intent.
Quality Score influences:
- How often do your ads show in a search result
- Ad position (and how visible your ads are)
- Ad rank
- Average cost per click
Quality Score is one of the best indications of how strong your ads are and uncovers optimization opportunities if the score falls short.
Three primary factors determine its score of 1-10:
- Expected clickthrough rate (CTR): Whether searchers find your ad engaging enough to click on
- Ad relevance: How relevant your ad content is to your target keyword
- Landing page experience: How well searchers find the answers they’re looking for on the destination page after clicking on your ad. Page load speed, bounce rates, website experience, and content all influence this factor
Grab this template to track your PPC metrics right away
Automate it!
Now that you know which PPC KPIs to track, you can follow and present these metrics in seconds with an automated tool like DashThis.
Sign up for your free 15-day trial to automate your PPC reporting in a visually-pleasing format that’s easily shareable with your team. Showcase all critical PPC performance metrics in a single report and ace your report to your clients or key stakeholders.
PPC doesn't need to be a mystery and with DashThis it's as easy as 1-2-3

Ready to automate your reporting?
Read More

Don’t miss out!
Follow us on social media to stay tuned!
Automate your reports!
Bring all your marketing data into one automated report.
Try dashthis for free