How To Use Data Analytics Insights To Power Your Marketing Campaigns

The sheer amount of data and analytics tools you have to draw analytics insights can be overwhelming, but you're not alone.
There’s a way out! Here’s how.
- Analyze the raw data with data analytics tools
- Have all your types of data in one place so you have the complete picture
- Analyze and interpret your data in a way that’s actionable for the business
- Communicate your valuable insights in a well-structured report
Let’s dive into each step and how DashThis can help you spend less time on your reporting.
Why is it essential to track analytics insights?
One reason digital marketing is so powerful because you can collect data sets and trace every action and decision back to your business with advanced analytics.
All this is thanks to data collection.
When used well, data management is a powerful tool to guide your decisions on what’s working and what isn’t. And 94% of 383 marketers agree data improves demand generation efforts according to an Ascend2 survey.
For data-driven marketing to work, you must track and measure performance and act on your insights. 38% of marketers in the same survey say measuring results is a significant challenge when using data to drive demand.
How to use data analytics insights to drive marketing success
Prove marketing effectiveness to your stakeholders and clients
Marketing work requires a lot of daily output - like writing content, scheduling social media posts and creating a multi-channel marketing strategy.
But output’s only half the story.
The other half of your work is communicating the results of your work and forecasting future results for your clients and stakeholders. To do this well, you’ll need a business intelligence system to gather analytics insights and communicate them to your clients.
On the Social Media Marketing Podcast, JJ Reynolds, founder of Vision Labs says marketers need to understand their metrics and prove to their bosses or clients that their work drives tangible results for the business.
He continues: “What you have to do as a marketer is say, this is my plan. This is how I want to achieve that. And here is the outcome of what the plan was.”
Marketers who consistently deliver on these three points will find building confidence with their clients easier.
Analyze trends and patterns in marketing initiatives
Data can help you make effective business decisions and determine what's working. Some examples:
- Social media: Understand which content format (e.g short video or image carousel) drives more engagement and impressions with your target demographic
- Content marketing: Measure time on page or conversion rates on different blog topics to drive content strategy decision making
- Email marketing: Test the open rates of different subject lines or A/B test different email layouts to see which layout has better click-through rates.
This way, you can improve your campaigns and results based on historical data, and make better decisions with the right evidence.
Improve website user experience
Analytics insights come in handy here to optimize your digital user experience.
Look at metrics like bounce rate, Google’s Core Web Vitals metrics, page load speed, time on page and user engagement metrics. Assess your critical lead generation touchpoints like form completion rate to assess if there’s areas to improve in your digital customer journey.
Set effective marketing goals
What is a reasonable conversion rate or engagement rate?
You could set marketing goals using industry benchmarks, but comparing your metrics to the industry averages and your competitors might not be the best way.
Why? Every business is unique. There are many variables out of your control that might influence a KPI. CRO company the good lists the many variables influencing conversion rates in this nifty graphic.
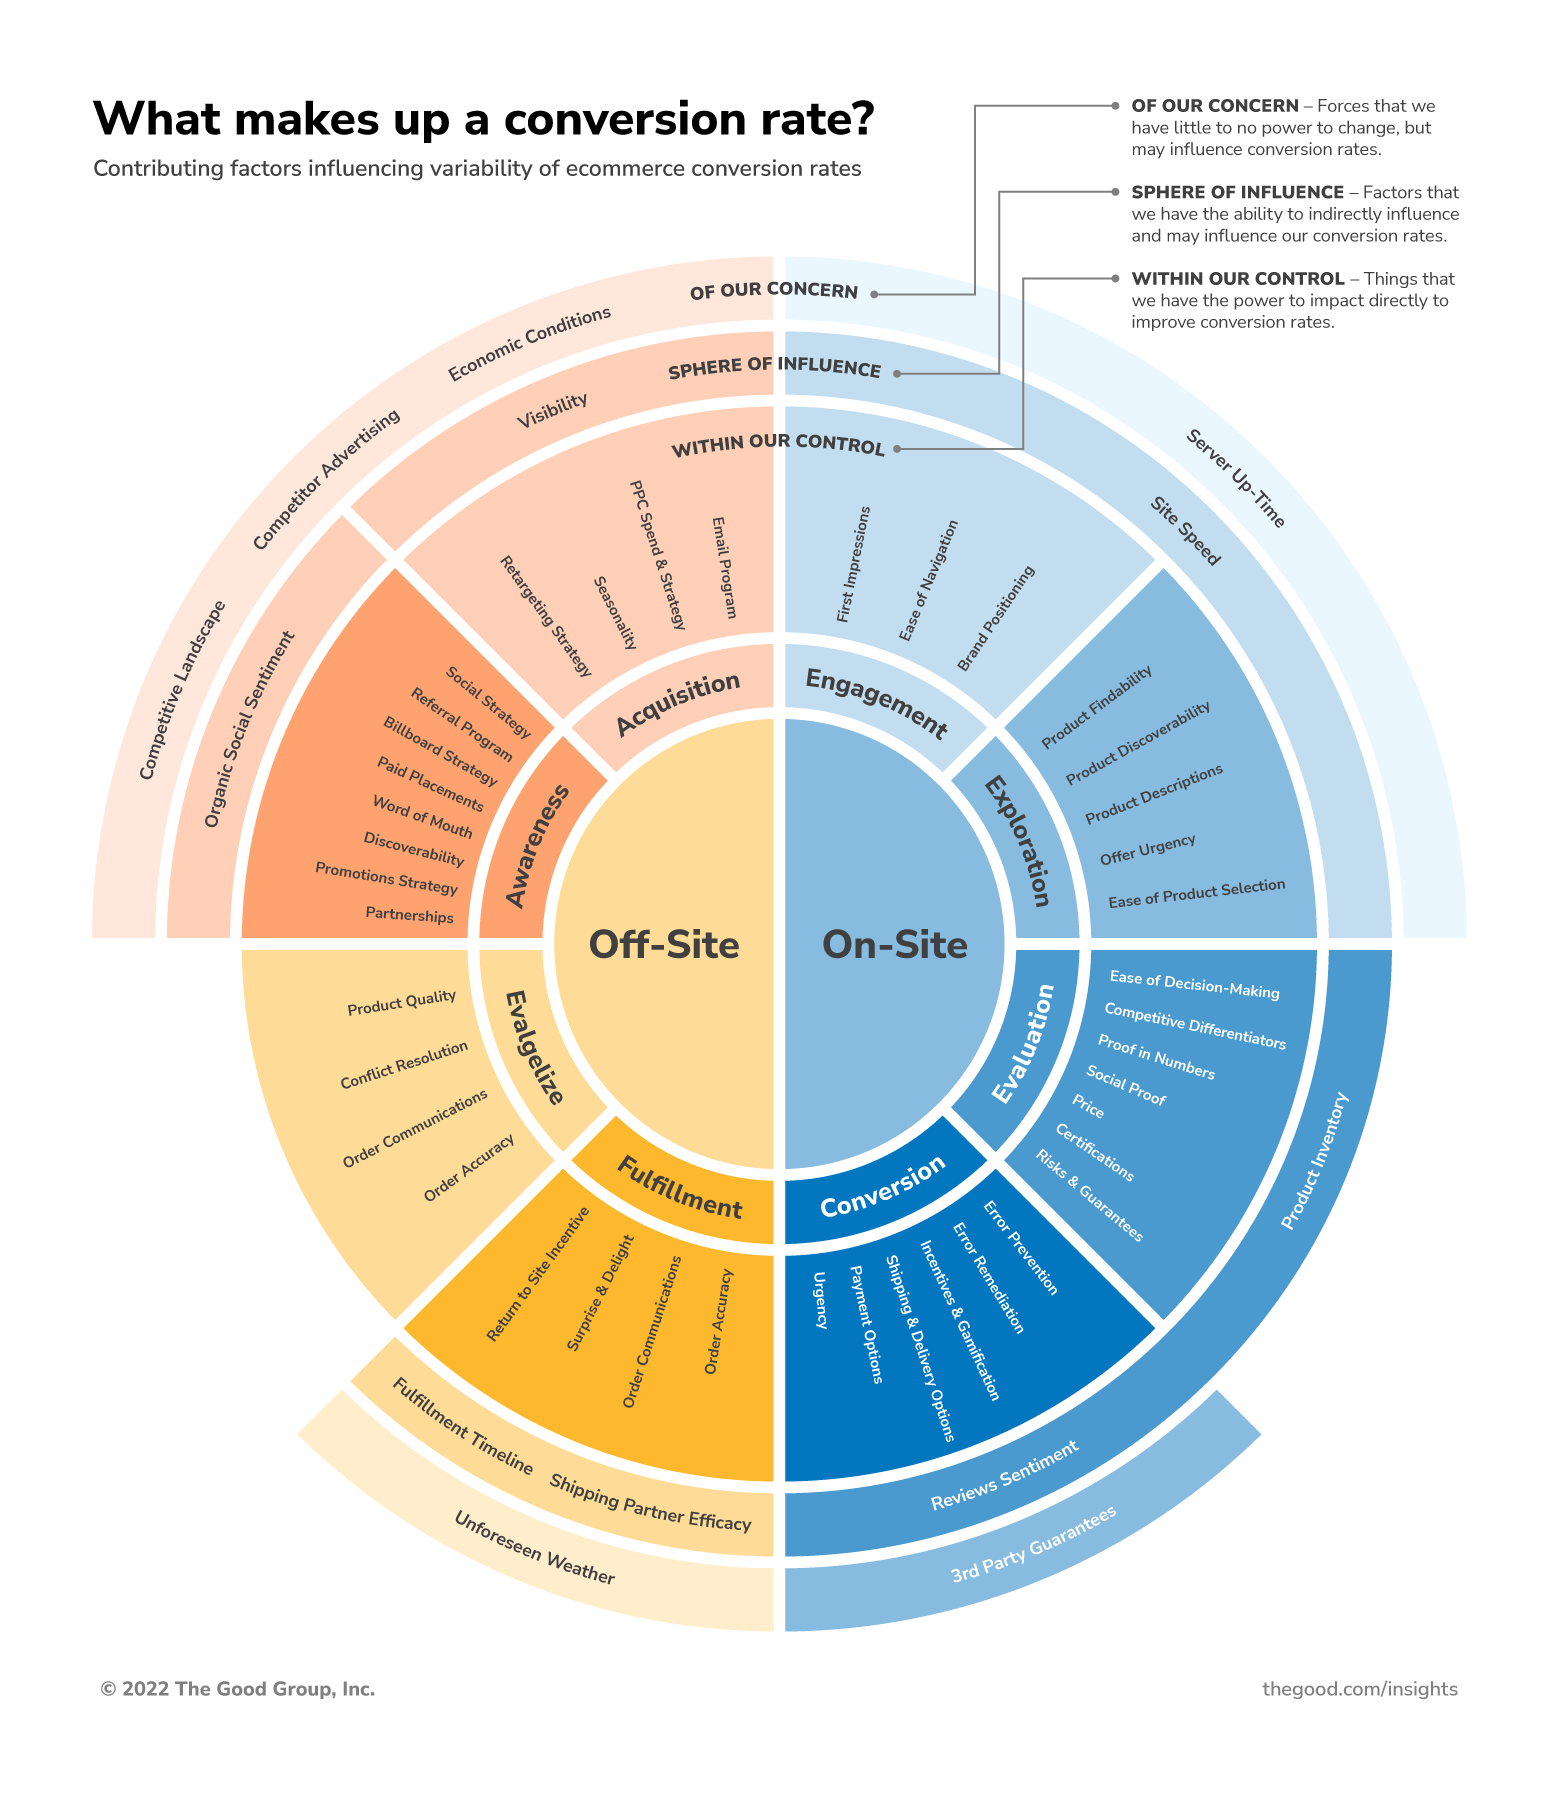
Image source: the good
Notice the many variables within and outside our control? That’s why it’s better to set marketing goals based on your actual performance data instead of relying on industry averages.
Plus, by regularly looking at your data, you can see if you’re on track with your goals or need to adjust.
Read more: OKRs vs KPIs: A comparison of the two popular goal-setting methods
How to get the most out of your analytics insights with DashThis in a 3-step workflow
If all these steps sound like a lot, here’s where automated reporting tools like DashThis help you throughout the data analysis and reporting process. First, let’s sign up for your 15-day free trial here.
Step 1: Gather your data in one place
Every marketing tool has its way of formatting and visualizing data, making data comparisons across tools or getting the complete picture a pain.
Well, good news: configuring DashThis’s 34+ integrations makes it easy to connect all your different digital marketing tools (from Google Analytics 4 to social media platforms and paid advertising tools) to get all your data in one place, making these essential steps much easier.
No more manual exports and formatting. Just connect your data sources and import your data into your dashboard. You can even update widgets with a click, saving more time on report creation.
Step 2: Visualize the data
DashThis has multiple data visualization options to speed up comprehension (and make your dashboard look amazing). To do this, DashThis allows you to use different custom widgets and graphs to do this. You can manually enter data or organize your dashboard with a static widget.
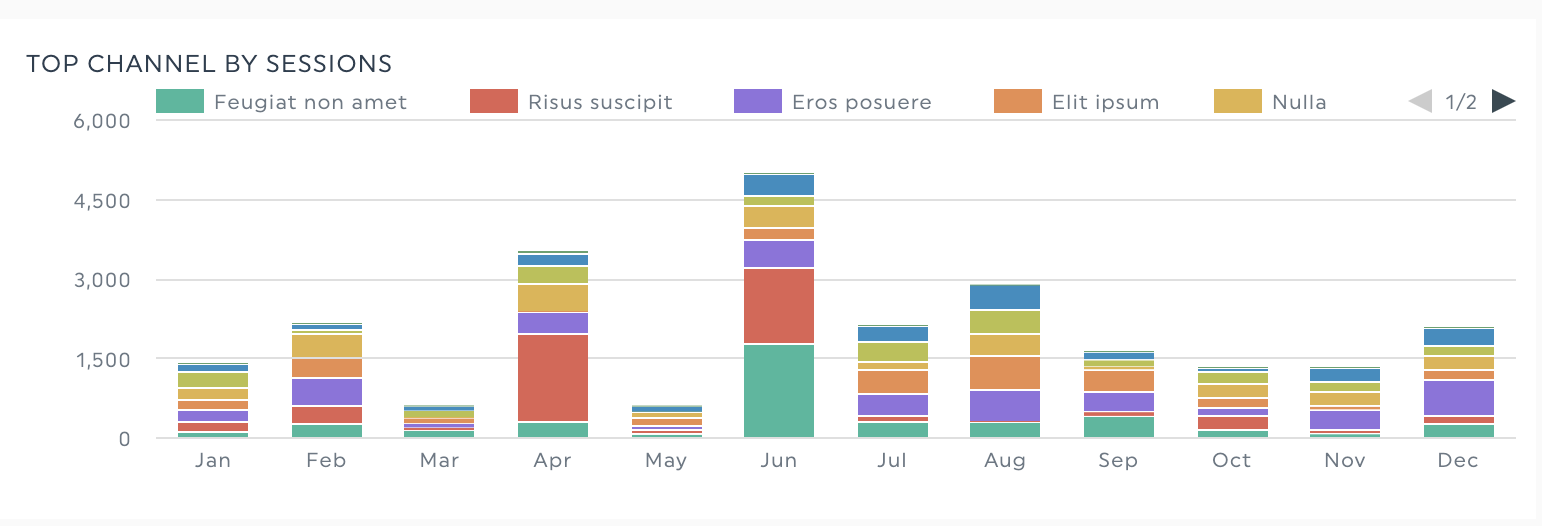
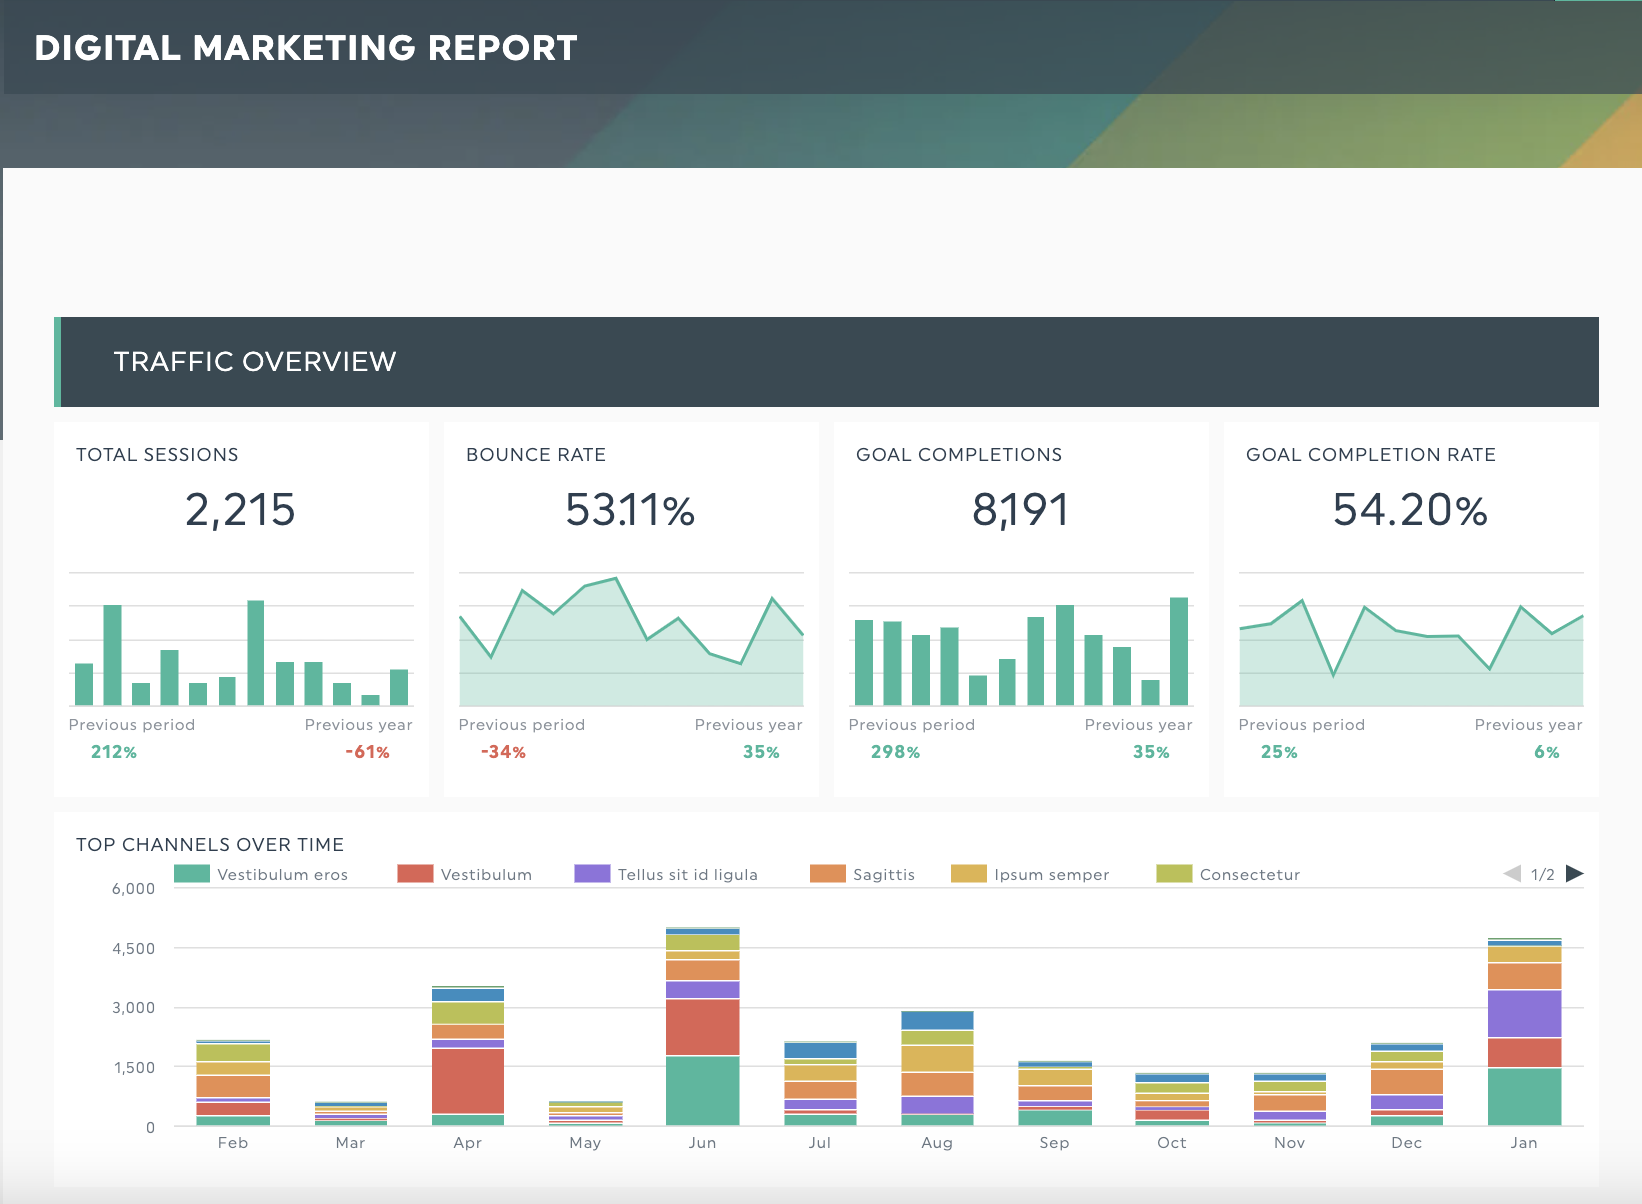
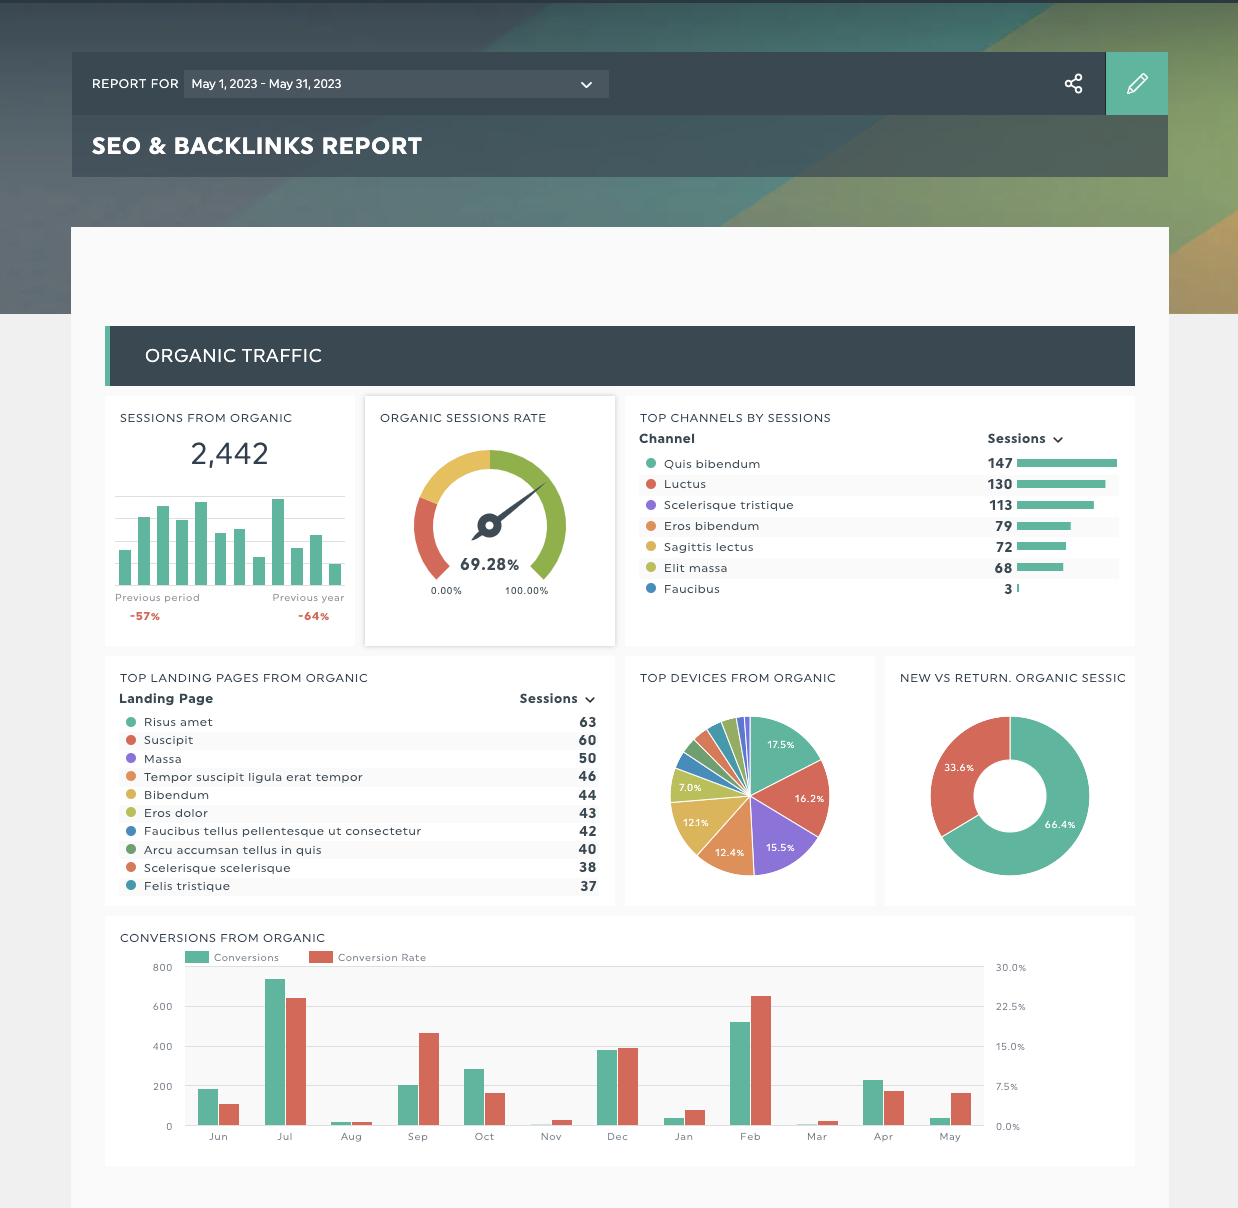
For example, you could set up a bar chart to visualize your organic traffic channel performance over the past 12 months to justify your SEO results and give them tangible proof why they should continue investing in your SEO services.
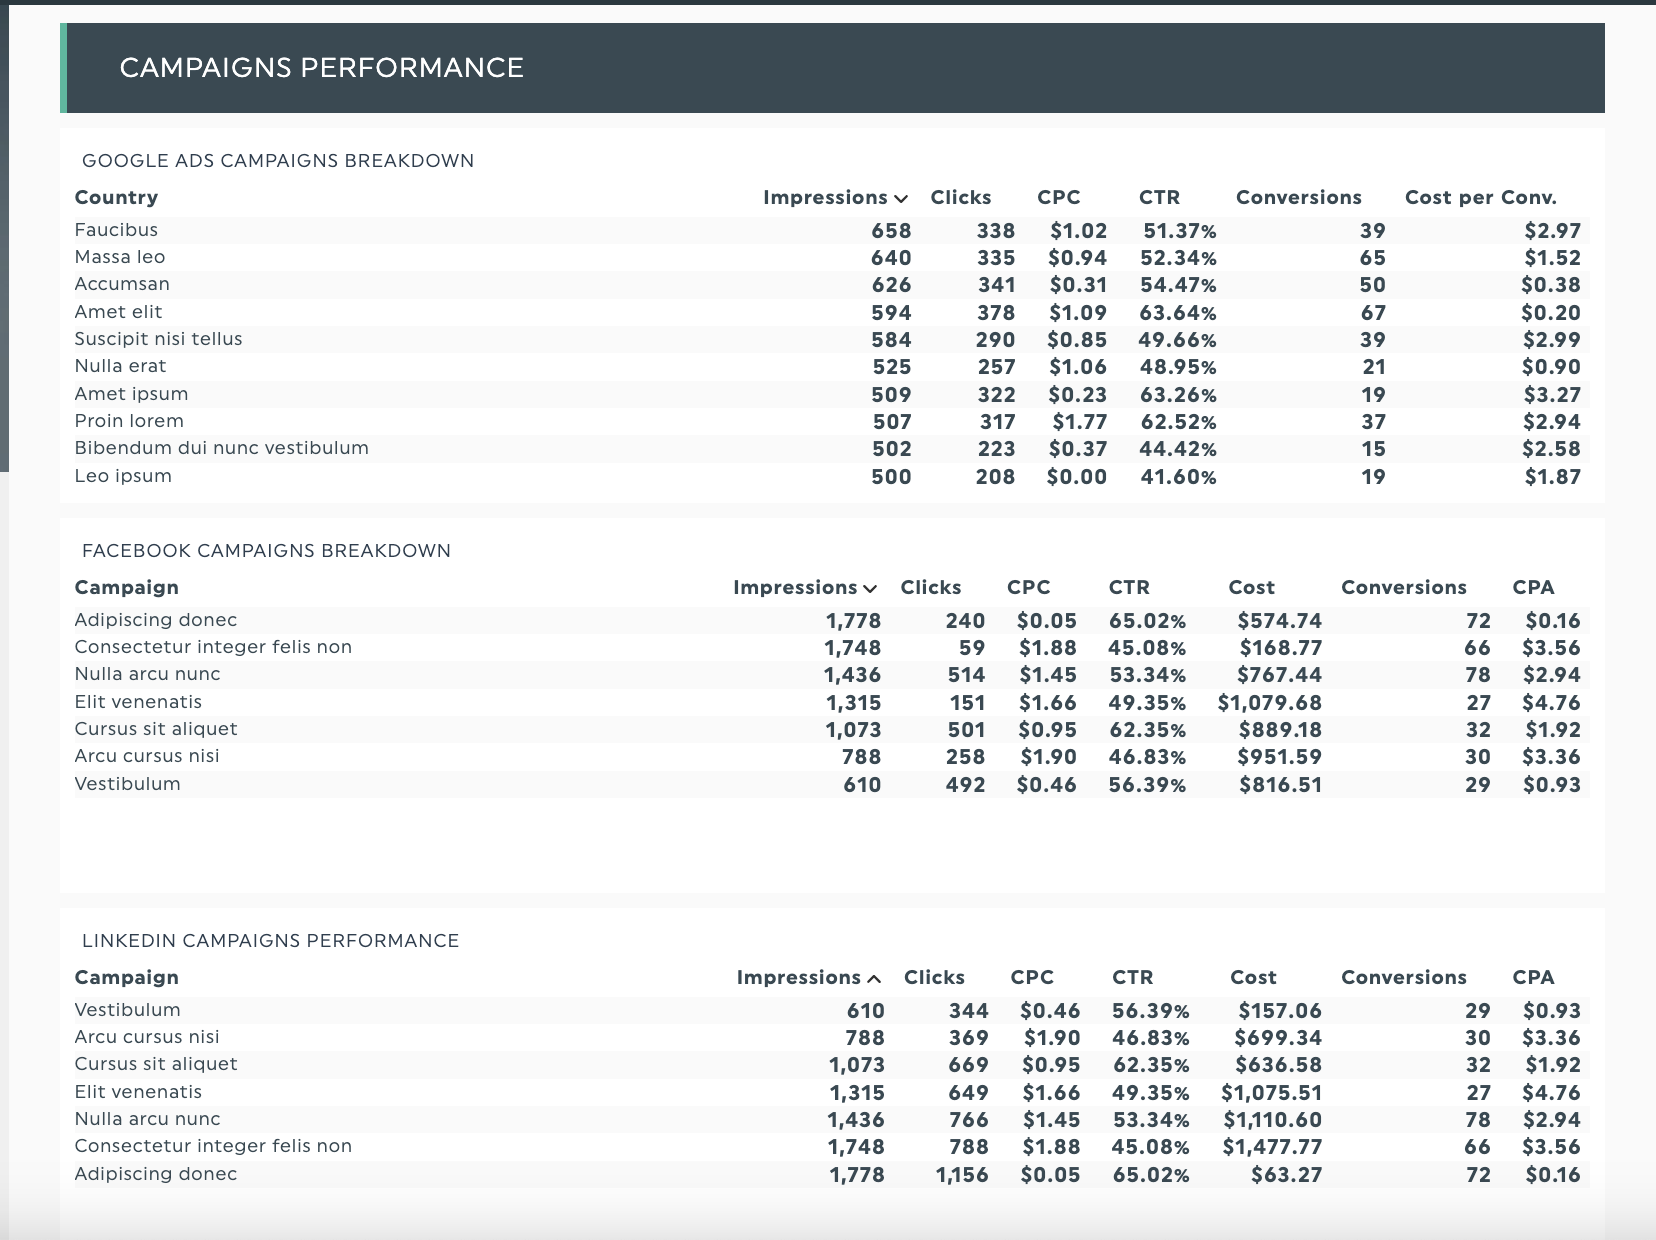
Or you could compare the conversion rates of LinkedIn advertising campaigns with your other digital marketing channels to understand which campaign approach works best or which ads to invest your remaining ad budget into.
Experiment to see which data visualization method works best for you!
If you’re new to data visualization, don’t fret. Start with these resources:
Step 3: Interpret and communicate actionable insights from your data through reporting
After you've visualized your data, it's up to you to report on your analytics insights.
This step is critical, for it tells your client or stakeholder how the data you’ve gathered applies to them.
It’s also a vital opportunity to show the value of your work and professionalism by curating an excellent reporting experience, from the moment your client receives the report to how it’s structured, to maximize their understanding of their report.
See excellent client reporting in action: Digital marketing agency Jelly Marketing uses DashThis’s reports to save over 20 hours of work per month and play more proactive roles with their client’s portfolios and digital marketing campaigns.
Let’s go into specific examples of how you can deliver analytics insights to your clients and maximize the value of your client reporting.
Best practices to communicate analytics insights to your clients
Keep your reports simple and focused
You’ll need to know two things:
- What’s the aim of your report?
- What does your audience want to see in your report?
Let’s say you’re presenting to a local service business owner who wants to know if their marketing generates bottom-line revenue and lead pipeline health.
You’ll want to focus your report and analysis on key performance indicators (KPIs) like conversion rate and other cost/profit-related metrics like customer acquisition cost or lead generation.
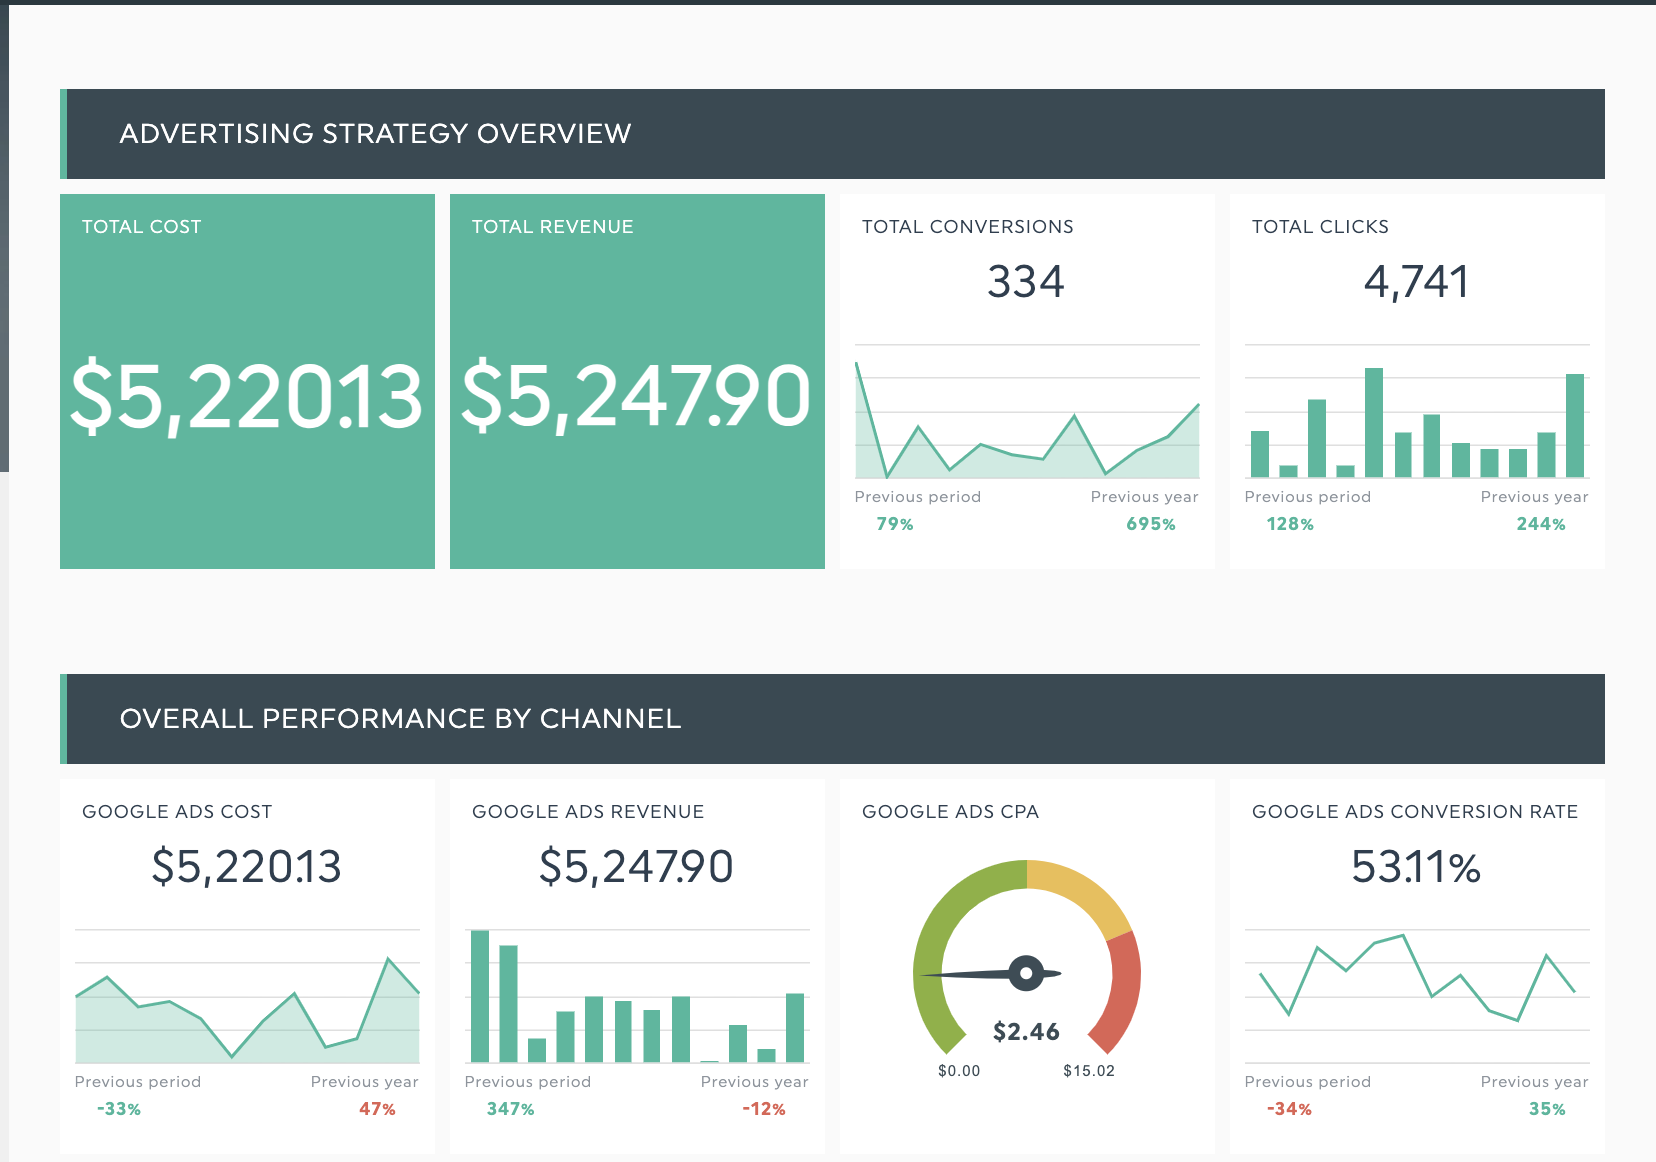
Headers organize your report and make it easier for your client to follow to make informed decisions. Get this advertising report template with your own data!
Monitor and report regularly
Your marketing dashboards are only helpful if you check and act on the data within, so set a 15-minute reminder in your calendar to review your campaign performance and take action on any insights you see.
Use DashThis to automatically schedule your weekly or monthly reports and send them to your team for internal analysis. You can also schedule reports to your client at a regular time.
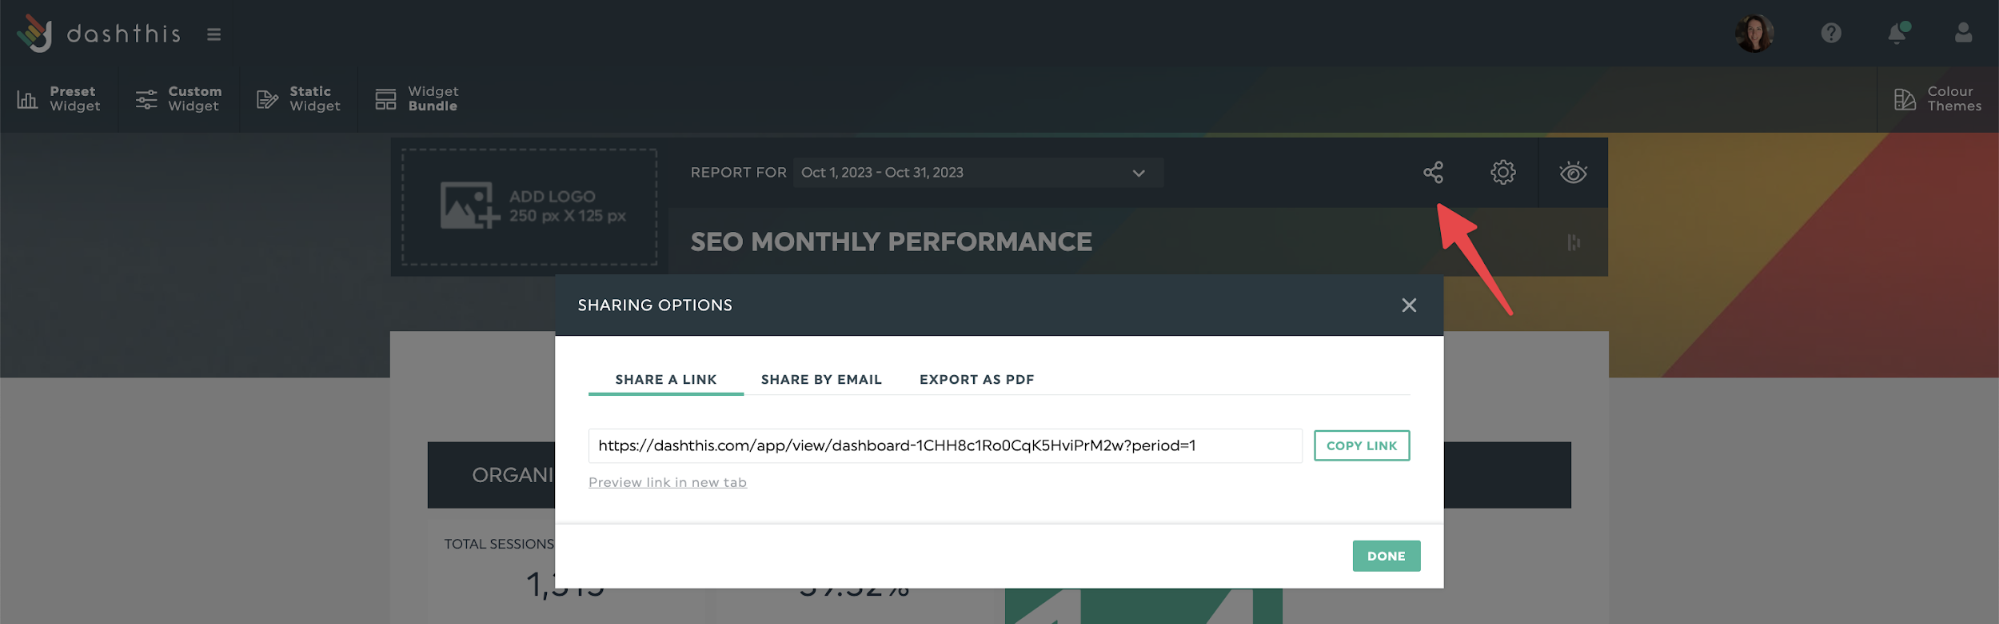
DashThis offers multiple report-sharing options, like
- Automated email dispatch
- A URL link to the report for clients to view online in real-time, perfect for client review meetings
- Export the report as a PDF to attach to your email for your client to download or to upload to a client folder.
Use reports to deepen client relationships
Reporting is also an exercise in communication, and if you nail this crucial part of client communication, you’re more likely to build stronger relationships with your clients.
Naturally, stronger relationships translate into better clients.
Think back to your best clients - you’re more likely to enjoy working together and consider these collaborative partnerships. A report by Aprais and WARC found strong client-agency relationships delivered more effective work. Likewise from the agency's perspective, effective client relationships score higher on trust, communication, and accountability.
The results are clear: you need to develop stronger client-agency relationships to do more effective work. And effective client reporting is a powerful tool to develop these golden relationships.
By sending regular, value-packed reports, you’ll have ample opportunities to discuss the latest analytics insights, save time on meetings and develop a closer relationship with your clients.
We put these principles into practice with our own clients at DashThis. Our account management team reaches out to their clients regularly to stay hi and check in with them to see how things are going and eliminate any issues someone might have before they become actual issues.
Use time-period comparisons
Analytics insights and data analysis come alive through comparisons.
Data comparisons help answer the all-important question: are we doing better than we used to before? Let’s illustrate with an example.
Let’s say you’re a clothing retail store and you’re measuring the performance of your recent spring sale campaign. In this e-commerce report, you’ll compare your sales and average order value from March to the previous year.
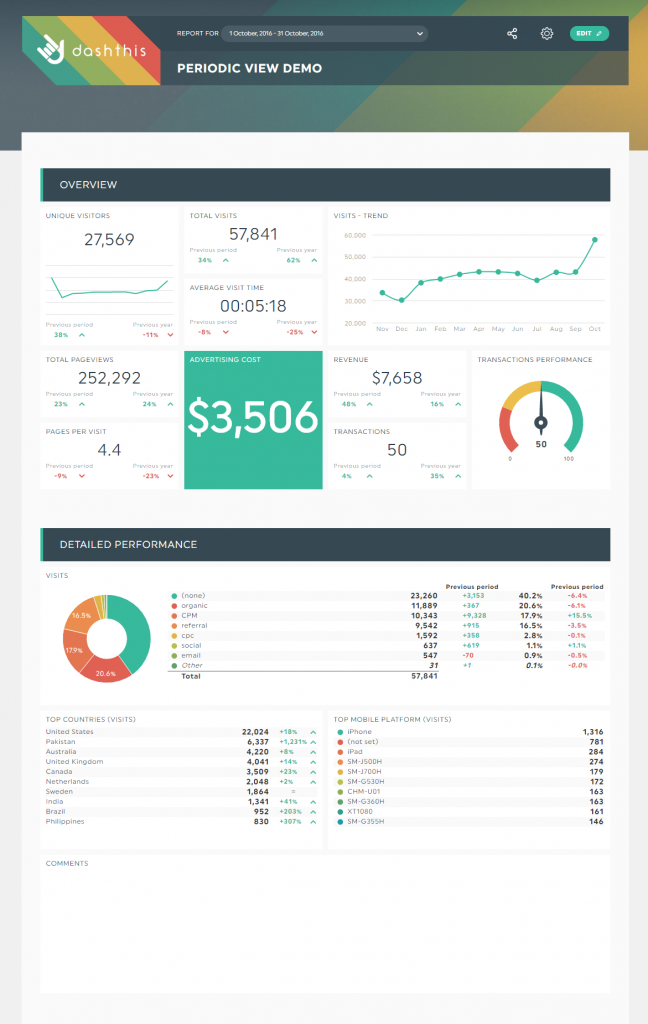
Tip: Using DashThis's Periodic Report, you can create reports for every day, week, month, quarter or year. You can also browse past periods, and it's easy to print for record-keeping.
Besides yearly comparisons, you can also compare across time periods like:
- Quarterly reports
- Monthly reports
- Weekly reports
3 DashThis report templates to help you get the most out of your analytics insights
Google Analytics 4 report template
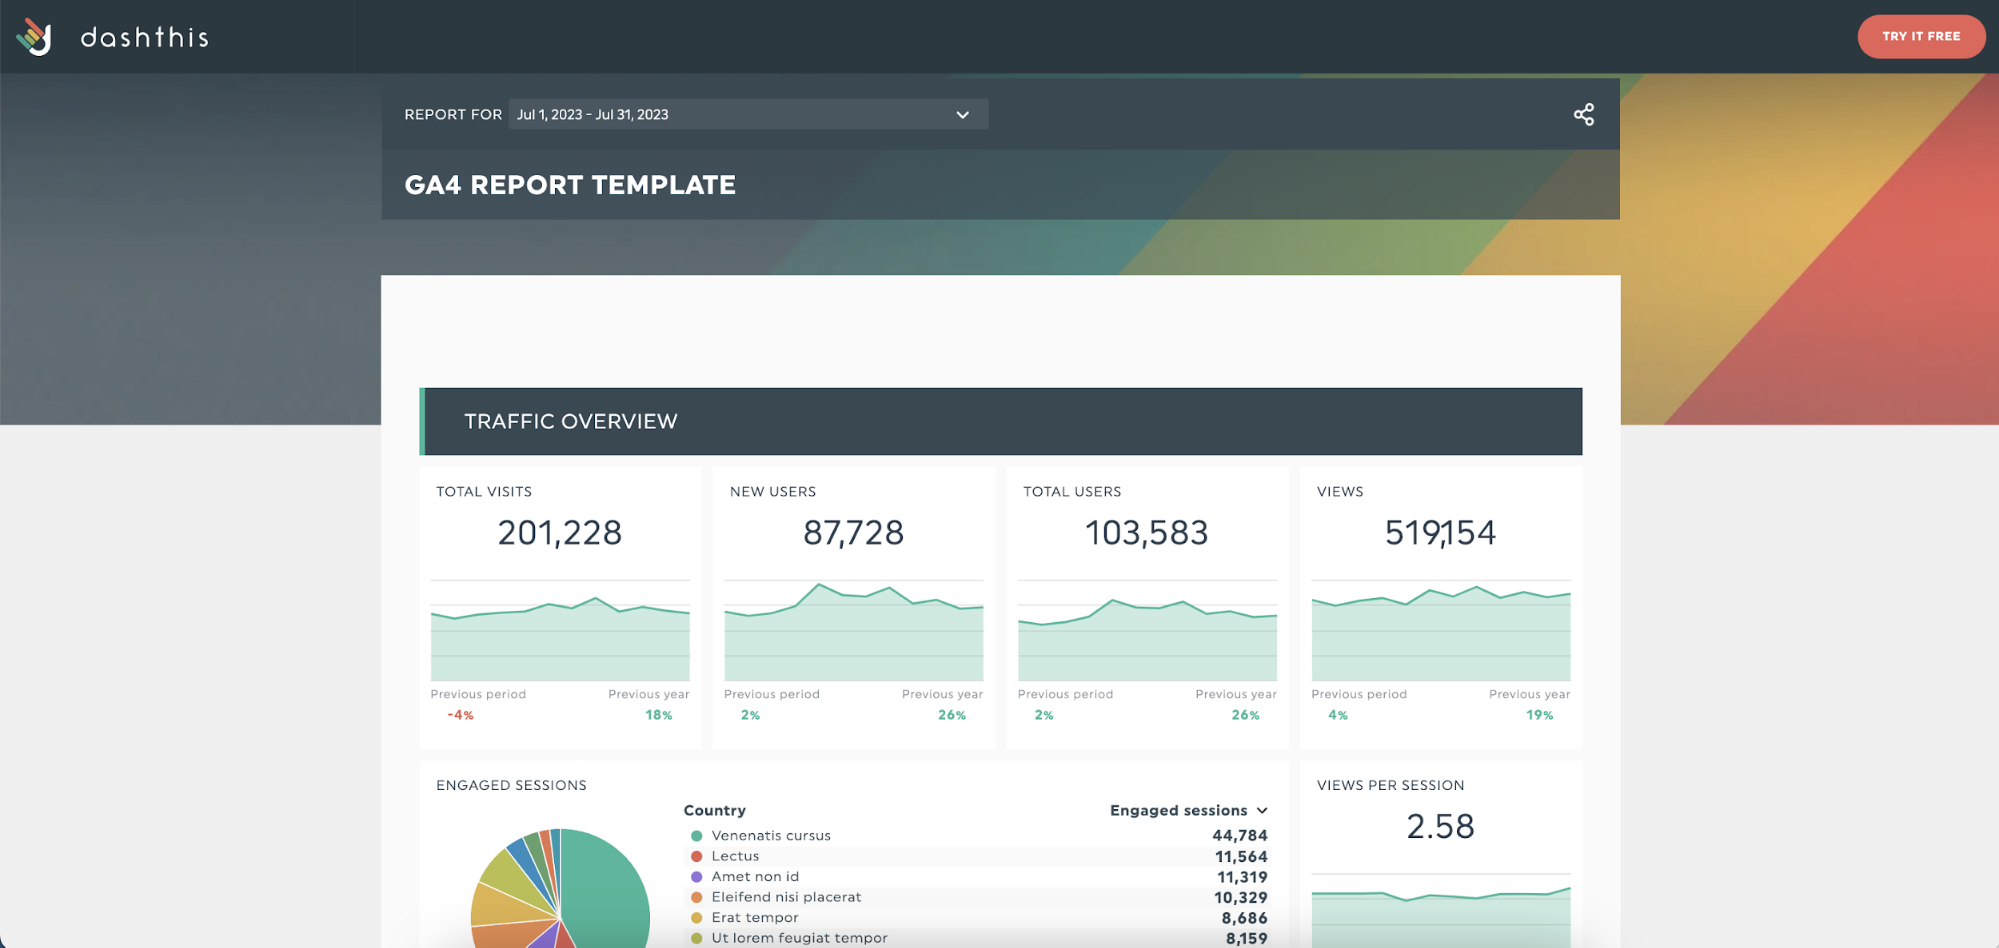
Get your GA4 report template with your own data!
Use our GA4 report to easily get your website metrics in one place and track how your website and mobile apps are performing.
What’s more, you get to see your GA4 data points alongside all your other marketing data like paid advertising solutions, SEO tools and content marketing analytics thanks to DashThis’s 34+ integrations.
Web analytics report template
Get your web analytics report with your own data!
Suppose you need help getting your data across SEO, Google Analytics 4, paid ads, email marketing and so on in one place for easy analysis. In that case, our web analytics report is here to help!
Build your web analytics dashboard in minutes with this report template. Handy for cross-channel marketing reporting or giving clients or stakeholders a complete overview of your marketing activities.
SEO report template
Get this SEO report template with your own data!
Google has over 200 SEO ranking factors, and it’s easy for clients to get confused. Use our SEO report template to focus on the essential metrics during SEO or content marketing discussions.
We've put together an infographic and guide explaining our SEO report template, why we chose these metrics, and widget styles.
Plus, DashThis integrates with popular SEO tools like Ahrefs, SEMRush and more. No more toggling between SEO tools; simply connect your SEO tools with DashThis and automate away the painful parts of analysis.
Automate your analytics insights with DashThis
Unlocking data analytics insights can take your marketing from good to great. Done well, you’ll build confidence with your clients and deepen client relationships.
Automate your reporting so you can focus on these important tasks. If reporting and analytics is something you struggle with, let us help you! Give DashThis a try with our 15-day trial, no credit card required.

Ready to track your analytics insights?
Read More

Don’t miss out!
Follow us on social media to stay tuned!
Automate your reports!
Bring all your marketing data into one automated report.
Try dashthis for free