The fundamentals of the ideal SEO reporting dashboard
In the first part of our Ultimate Guide to SEO Reporting, we discussed in depth what search engine optimization is and how important it is for your business. As a part of your larger web marketing strategy, SEO is a crucial investment to make. However, like any investment, you don’t want to make it without understanding what your return is!
That’s where SEO reporting comes in! SEO reporting dashboards are the tools you need to analyze your SEO effectiveness and make informed and strategic decisions.
But what exactly is an ideal SEO reporting dashboard? What does it mean and how do you even start? Remember, we aren’t getting into choosing specific metrics and KPIs in this piece yet – there are way more important, broader considerations to have in mind before we even get into those details!
Let’s get into that, shall we?
What’s the difference between a report and a dashboard?
In the general sense, both reports and dashboards are used to communicate data and information. However, where dashboards are intended to be a quick overview, reports are usually more complex and comprehensive.
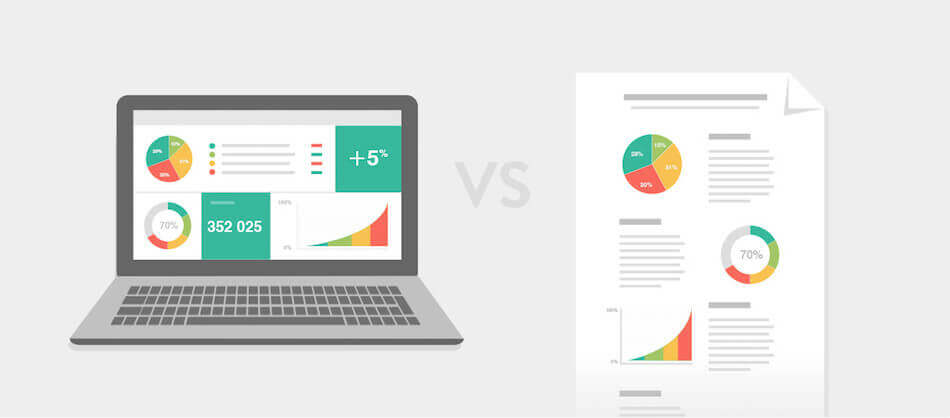
A dashboard, which can be displayed to your team in real-time, is useful in your day-to-day operations. Meanwhile, a report, which can be presented monthly, quarterly, or yearly, is more useful in planning your future operations and seeing an overview of the business.
Think about it this way, if a dashboard is like your car’s actual dashboard (showing your speed, the amount of gas you have, etc.), a report is like your annual car maintenance check-up (showing you how old your brake pads are, when your tires might need to be replaced, etc.).
What is a SEO reporting dashboard
A reporting dashboard is a little bit of both a report and a dashboard.
It looks like a dashboard with graphs and charts constantly updated with your data, however, there are also client reporting features like static widgets to add comments, sections, and custom numbers.
So it tracks all your data like a dashboard but you can also add notes, benchmarks and various explanations for your boss, colleagues, or for your clients if you're in a marketing agency.
A SEO reporting dashboard more precisely is a marketing dashboard you use to track all your different SEO efforts from backlinks, organic traffic, SERP, rank tracking, and much more. With an automated report, you can automatically pull data from all your different SEO platforms (Google Analytics, Google Search Console, Moz, Ahrefs, SEMrush, bing, etc.).
Your SEO reporting dashboard can contain different widgets, all displaying different metrics and KPIs in regards to your SEO performance and SEO campaigns. The best SEO reporting dashboard would be a custom dashboard created with an automated SEO reporting tool, including data that's well separated in easy-to-read sections.
How do you start the creation of a SEO reporting dashboard?
Creating a good SEO reporting dashboard isn’t just about throwing some generic metrics and KPIs on a page and calling it a day. You need to choose the right metrics for your business.
But how do you start?
What should an SEO reporting dashboard be showing you?
The easy way to choose your KPIs
The first and easiest way to choose your KPIs is to use preset report templates. You're in luck, DashThis has all the SEO report templates you may need, and they include all the most important KPIs.
For example, you can choose a SEO reporting dashboard template, a Google Analytics report template, or a digital marketing report template if you'd like to include all your different marketing efforts like PPC, ecommerce, social media, etc.
If you decide to go with the SEO dashboard, your report will look like this:
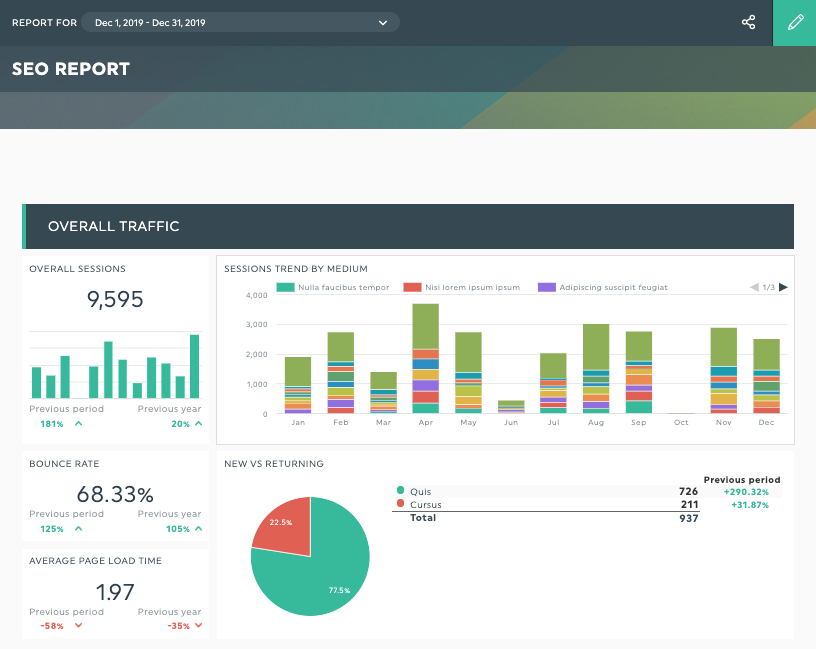
Some of the KPIs included in our SEO report template are:
Overall Traffic
- Overall sessions
- Sessions by medium
- Average page load time
- New vs. returning visitors
SEO / Organic traffic
- Sessions from Organic
- Visits by device
- Revenue from organic
- Average session duration
- Pages per session
Backlinks
- Referral sessions
- Backlinks
- Conversion rate
If these KPIs are not for you, you can create your own custom report based on your specific goals. To do this, you simply have to follow these steps:
First, your reporting dashboard should have realistic goals using concrete metrics and Key Performance Indicators (KPIs)
A SEO reporting dashboard is how you’re going to know whether your digital marketing strategies are working or not. It’s easy to say you want more visits, more conversions, and more sales… but that isn’t concrete enough. The ideal SEO reporting dashboard has SEO metrics and KPIs that aren’t answerable by a “yes” or “no”, but rather ones that allow you to use real numbers to identify trends over time and see where you are improving or failing in your strategy.
In order to get the most out of your SEO dashboard, though, you need to ask yourself the right questions: what are the overall business objectives? What are the SEO strategy objectives? What channels do you need to use to reach these objectives? Which keywords does your site rank high for and which ones bring the most converting users? Are these two the same?
Start by writing these overall objectives down and which channels and elements need to be measured for each. After this, the KPIs will be pretty simple to find.
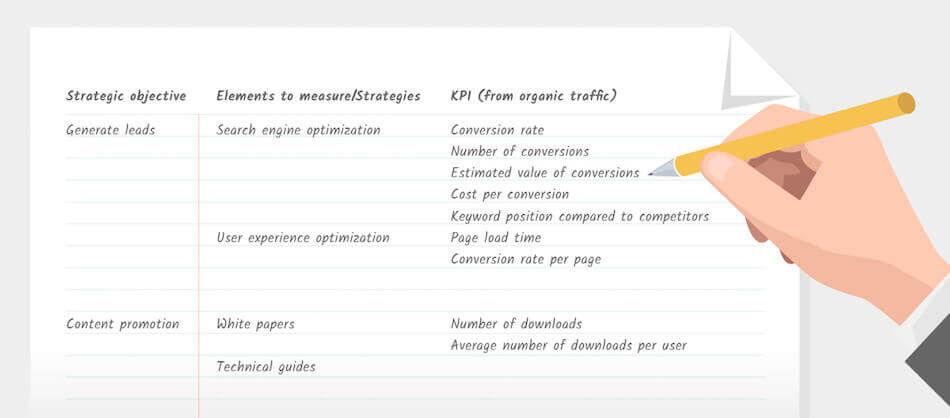
Once you know your objectives, you simply set up the most relevant KPIs for them. As an example you could include; keyword ranking, search traffic, traffic sources, search results, search query, bounce rate, pageviews, organic search traffic, organic search, the performance of your landing pages, your link building efforts, or any other available data that would portray your SEO efforts in regards to your objectives (with the perfect SEO dashboard reporting tool you will be able to fetch these high quality KPIs from Google Analytics, Google AdWords, and even other customizable data sources from Excel or Google Sheets’ CSV files.)
After that, you need to set yourself some realistic goals for each KPI in question based on your overall objectives.
Second, you need benchmarks for those goals
The goals you just set for yourself dictate your final results. But these goals also need a particular deadline. As such, you need benchmarks along the road before you actually reach those final goals in order for you to understand the trends in your data, and whether you’re following a decent rhythm to reaching your final goals.
To do this, decide how long it should take your strategy to bring you to your goals, and what pace your data should keep to get there within your deadline. This way, every week, or month, or quarter that you check your SEO data points, you’ll know whether you’re likely to reach the final end point of your goal completion or if you need some mid-strategy adjustments in order to do so.
Finally, your reporting dashboard needs to be adapted to its audience
It is important to remember to whom you will presenting your SEO data – not everyone is equipped to understand the details in the same way, and not everyone wants the same type of data and the same type of presentation. As such, it’s important to remember who your audience is and adapt your reporting dashboard to that specific audience.
If you’re presenting your information to SEO experts, you can go into greater detail, perhaps showing them metrics such as MozRank or MozTrust. On the opposite end of the spectrum, if your audience consists of managers and C-level executives, you should use KPIs that affect the business as a whole, namely things like ROI and Cost. In the middle of these two extremes are marketing generalists; if this is your audience, you can afford to provide some relatively detailed yet overarching KPIs such as Traffic from Organic Sources, and Conversion Rate from Organic Traffic.
Understanding your audience will not only dictate the type of analytics data you should put in your reporting dashboard, as well as the type of insight you want to include with it, but also the issues you want to highlight. Each type of audience can be a type of decision-maker; the purpose of your SEO reporting dashboard is to encourage discussion and lead to a decision.
Basically, once you know who your audience is, you’ll understand what they need to know, and how you want them to analyse your SEO information to make an informed decision.
Where do we go from here?
This entire piece has been about asking yourself the right questions: who am I reporting my SEO data to? What are my SEO goals? How long should it take me to reach them?
These are broad questions, but they’re imperative to ask, and answer, before getting into the nitty-gritty details of KPIs and reporting dashboard layout.
You want to know more about SEO Reporting? We put together the Ultimate Guide to SEO Reporting - feel free to share the love on social media!
Part 1 - The Ultimate Guide to SEO Reporting: Starting with the Basics
Part 3 – What does the Perfect SEO Report Look Like?
Now that you know everything there is to know about SEO reporting dashboards, what are you waiting for, go ahead and create your own for free with DashThis!

Ready to automate your reporting?
Read More

Don’t miss out!
Follow us on social media to stay tuned!
Automate your reports!
Bring all your marketing data into one automated report.
Try dashthis for free