Data Visualization Dashboard

A data visualization dashboard allows digital marketers to track multiple data sources and visualize the data, ensuring a solid data set for decision-makers.

Start your free trial

Get 10 dashboards for 15 days

marketing dashboard background

A great data visualization dashboard for marketers

Data analytics doesn't need to take up all your time. Using data visualization tools makes it easy to track your data, do data analysis and ultimately make better business decisions. Take a look at what a data visualization dashboard entails!

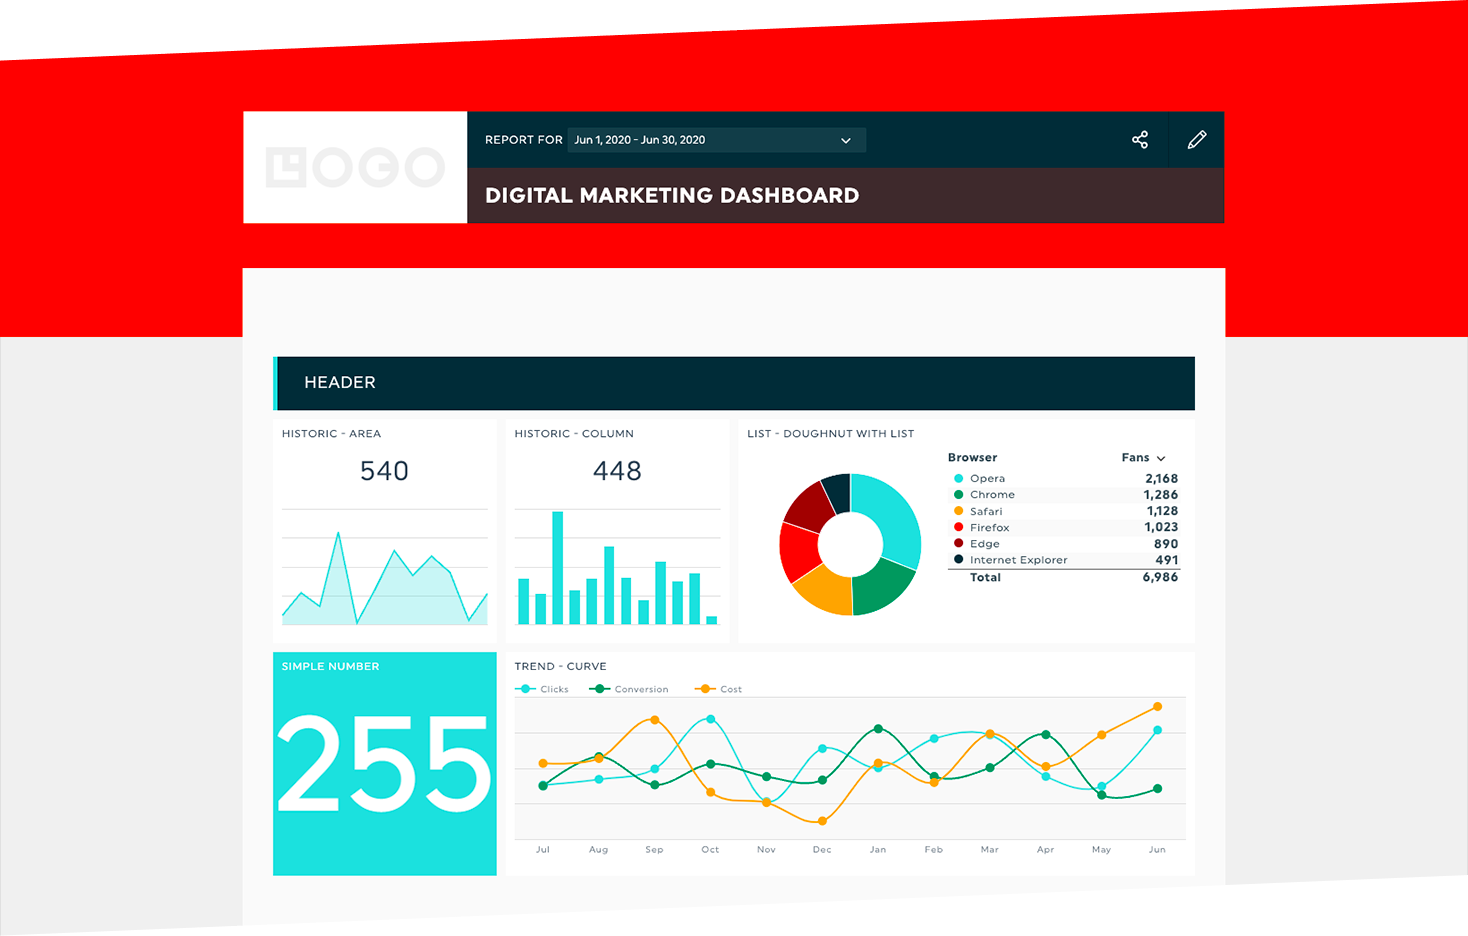
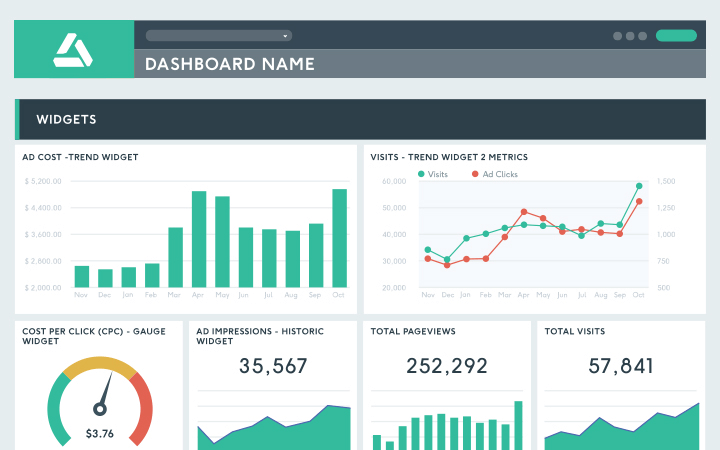
What is a data visualization dashboard?

A data visualization dashboard is an interactive dashboard that allows you to track key metrics across multiple marketing channels, visualize the data points, and create reports for your clients that outline all your hard work.

what is a data visualization dashboard

Why use a data visualization dashboard?

Creating reports for your clients is one of the best ways to build a solid working relationship with them. Using a data dashboard with interactive visualizations your clients will be able to see at a glance how their campaigns are performing.

Why use a marketing dashboard?

What are the benefits of using a data visualization dashboard?

In addition to having all your data in one dashboard, a data visualization dashboard helps you explain to your clients what you're doing and why, build a relationship with your clients and provides a data set to inform decision making.

What are the benefits of a marketing dashboard?

Create your own dashboard today!

Start your free trial

What are the best data visualization dashboard KPIs?

You've probably got at least a few different marketing campaigns on different channels for your clients. Tracking the right KPIs is essential - you want actionable data that gives you genuine insight into your clients' campaigns.

Data visualization dashboard KPIs
  • Website Sessions

    Website Sessions

    Website sessions tells you the number of sessions on a website in a given amount of time.

  • Bounce rate

    Bounce rate

    Bounce rate measures the percentage of users who navigate to a web page and then leave without going to another page on that website.

  • Cost per goal completions

    Cost per goal completions

    This KPI tells you how much you're paying every time a user completes a goal (such as a making a purchase)

  • Return on Investment (ROI)

    Return on Investment (ROI)

    ROI measures how profitable marketing initiatives are. Essentially, it's revenue minus cost.

What are the top data visualization dashboard metrics?

As with KPI tracking, choosing the right metrics to track is key. Try to pick ones that give your clients a good overview of what's happening with their campaigns without overwhelming them with detail.

What are the top data visualization dashboard metrics?

Mobile app users Mobile app users

This metric measures how many users there are for a mobile app.

Google Analytics conversions by channels Google Analytics conversions by channels

This tells you how many conversions each of your channels on Google Analytics is getting.

Google Ads ad spend Google Ads ad spend

This metric tells you how much your Google Ads campaigns are costing.

Social Media engagement rate Social Media engagement rate

This metric measures how many people are engaging with your social media content. 

See these KPIs and metrics in your very own data visualization dashboard!

Start your free trial

What platforms should a data visualization dashboard include?

Ideally, you want to include all your digital marketing platforms. Having multiple data sources in one dashboard will let you see how your marketing campaigns interact with each other, allowing you to make better decisions about how to optimize campaigns.

Data visualization dashboard example

Create your own KPI dashboard with a ton of visualization options, from line charts to pie charts to bar charts to gauges. Best of all, DashThis takes care of the data fetching and visualization for you.

Data visualization dashboard example

How to create a data visualization dashboard

It's super easy - you'll be up and running in no time.

Create your data visualization dashboard

Create your DashThis account Create your DashThis account

Just enter an email address and a password.

Connect your digital marketing tools Connect your digital marketing tools

From Google Analytics to Facebooks Ads to Mailchimp, we support over 34 marketing integrations.

Create your data visualization dashboard Create your data visualization dashboard

Start with our template or create a dashboard from scratch - it's totally up to you. Just drag and drop the KPIs you want.

Create your own data visualization dashboard today!

Start your free trial

White label data visualization dashboard

With our multiple white label options, your dashboards can reflect your company's branding.

Custom domain

Replace the default DashThis URL by one that’s branded to your company, like reports.yourcompany.com.

Custom theme

Fully customize your dashboard design with your brand, your client’s brand, or even your favourite colour schemes!

white label data visualization 100% white label

Get rid of the DashThis branding altogether, add your own logo and even use your own custom email address to send reports. 

More data visualization dashboard

DashThis has a ton of other dashboards you can choose from for every marketing specialty. Here are just a few.

Digital marketer dashboards

Website Analytics Dashboard Website Analytics Dashboard

Collect your web analytics stats into one dashboard with our website analytics dashboard.

Explore this dashboard

Customer Dashboard Customer Dashboard

Track customer interactions and generate business intelligence with our customer dashboard.

Explore this dashboard

Social media dashboard Social media dashboard

Exploiting social media traffic and properly tracking social media campaigns is critical to any digital marketing effort. Our social media dashboard makes it easy.

Explore this dashboard

Check out our blog

We've got a ton of information about our products and a wealth of digital marketing tips and tricks over at our blog.

Marketing dashboard best practices

Join the Club… We Saved You a Seat!

DashThis is the power behind thousands of monthly online marketing reports. Still wondering if we’re really THAT cool? These folks seem to think so!

  • Easy, convenient, and fast to set up.
    Laurent Roumieu - PPC Analyst / Paid Search / Performance Media Laurent Roumieu PPC Analyst / Paid Search / Performance Media 360i Canada
  • The biggest benefit is the time saved in terms of data collection. It's also great that the design is very pretty out of the box.
    Jonas Meister - Digital Marketing Strategist Jonas Meister Digital Marketing Strategist GnuWorld
  • We've played around with countless reporting tools over the years but none of them come anywhere close to Dashthis. The level of integration and customization of reports, as well as their outstanding client support are unrivalled!
    Reef Digital Agency Director Hadrien Brassens Director Reef Digital Agency
  • DashThis allows me to quickly and easily get my clients key multi-channel performance metrics in one easy to digest report!
    Dave Ashworth - Technical SEO Consultant Dave Ashworth Technical SEO Consultant Organic Digital
  • Game changer for client communications and expectations. Also help in the sales process!
    Darian Kovacs - Digital Marketing & PR Specialist Darian Kovacs Digital Marketing & PR Specialist Jelly Digital Marketing & PR
  • We have so much less manual work to do; we save many hours a month that can instead be used for our customers!
    Mariève Masse - SEO Specialist & Project Manager Mariève Masse SEO Specialist & Project Manager O2 Web
  • Saves a lot of time as I can pull data from various channels all within one platform!
    Natalie Martin - Digital Marketing Manager Natalie Martin Digital Marketing Manager Travel Tripper
  • Customer service has been great, quick responses. The dashboard is awesome, looks good, and has everything we need to client reporting. Kudos!
    Nekta Born - Digital Media Trader Nekta Born Digital Media Trader iProspect
  • I like your system, but love the support. It feels that your team is very willing to work with us to accomplish what we need.
    Mark Strong - Vice President of Digital Marketing Mark Strong Vice President of Digital Marketing Clear Marketing Creative Agency
  • Simple, easy, flexible, and versatile tool with a great UI.
    Juho Santala - Digital Planner Juho Santala Digital Planner Redland
  • Phenomenal customer service.
    Niek Van Santen - Managing Director Niek Van Santen Managing Director Bouncing Orange
  • This tool has helped us close new accounts and improve customer satisfaction.
    Jeff Schroeffel - President / Lead Consultant Jeff Schroeffel President / Lead Consultant Pittsburgh Internet Consulting
  • DashThis provides us with the metrics we need as well as an easy way to automate our client reporting. Also, their customer support is great.
    Tarek Reda - Head of Digital Marketing Tarek Reda Head of Digital Marketing bfound
  • We use so many different reporting platforms - this consolidates what we give our clients.
    Leigh Ann Moltz - Digital Marketing Manager Leigh Ann Moltz Digital Marketing Manager Eighty Three Creative
  • DashThis is a phenomenal tool for communicating with clients and staff. With 10 minutes of set up, I can create a custom report for a client that speaks to their digital marketing goals.
    Michelle Henderson - Founder Bad Cat Digital Agency Michelle Henderson Founder Bad Cat Digital
  • We used to spend 30-40 hrs on monthly reporting. We’re now down to 10-20 hours max while providing even more detailed information.
    Brad Blackburn - Director of Search Engine Marketing at GravityFree Brad Blackburn Director of Search Engine Marketing GravityFree
Data visualization dashboard solution

Get Started Today!

Try DashThis

Made in Canada

DashThis is a brand owned by Moment Zero inc

Copyright © 2011-2024